1140
3D MR fingerprinting with water and fat separation1NMR Laboratory, Neuromuscular Investigation Center, Institute of Myology, Paris, France, 2NMR Laboratory, CEA/DRF/IBFJ/MIRCen, Paris, France
Synopsis
In this study, a fast 3D MR fingerprinting sequence with water and fat separation (3D MRF T1-FF) was developed for simultaneous measurement of FF and water T1 in the skeletal muscles of patients with fat infiltrations. The precision and accuracy of the sequence was evaluated on a multi-vial phantom and in vivo proofs of concept were obtained in the legs of a healthy volunteer before and after plantar dorsi-flexions and at rest in a patient suffering from inclusion body myositis.
INTRODUCTION
The validation of innovative therapies for neuromuscular disorders (NMDs) requires setting-up clinical trials where quantitative MRI biomarkers can play a pivotal role. MR fingerprinting with water and fat separation (MRF T1-FF) has been recently proposed for simultaneous measurements of fat fraction (FF) and water T1 (T1H2O) in fatty infiltrated skeletal muscles1. With this approach, increased T1H2O values were measured in patients with inflammatory myopathies, rendering it a potential new biomarker of disease activity2. During longitudinal trials, inter-scan reproducible positioning is a crucial aspect because the pattern of disease involvement in the muscles is not spatially homogeneous3. Precise slice repositioning represents a difficult task when images are acquired with 2D sequences, especially in children when growth effects between successive visits should be taken into account. In this case, acquiring 3D volumes would be preferable. The purpose of this study was, therefore, to develop a fast 3D MRF T1-FF sequence for simultaneous measurement of FF and T1H2O in skeletal muscles.METHODS
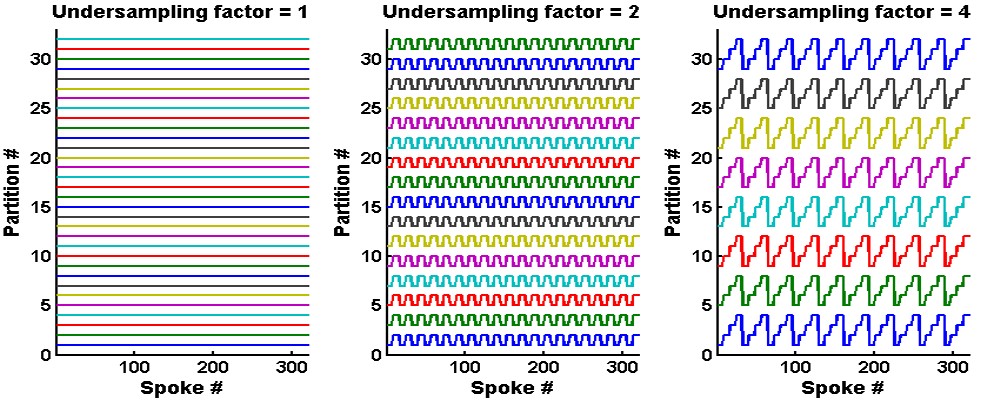
Phase-encoding gradients were added in the partition direction of the 2D MRF T1-FF sequence1 to obtain a 3D version of the MRF T1-FF sequence. Optimal spoiling of the FLASH echo train was achieved by implementing the random RF phase/gradient method proposed by Lin et al4. Uniform undersampling (US) was allowed for accelerating partition encoding5: figure 1 represents an example of this sampling strategy for a FLASH echo train of 320 spokes, an acceleration factor of 1, 2 and 4 and 32 encoded partitions. Highly undersampled volumes were reconstructed by gathering 8 successive spokes, zero filling the data in the partition dimension and applying standard non-uniform fast Fourier Transfer (NuFFT). The MRF T1-FF signal was adjusted using dictionary matching and the bi-component model as described previously1.The 3D MRF T1-FF was first validated in a phantom containing 17 vials with peanut oil/water emulsions at different FF values (from 0 to 1) and NiCl2 concentrations (from 0.375 to 1.2mM). The 3D MRF T1-FF was acquired with the following parameters: echo train of 1400 spokes, golden angle sampling scheme, varying TE, TR and prescribed flip angle (FA), 80 partitions, a TR of 10 sec per partition encoding step and a spatial resolution of 1x1x5mm3. US factors from 1 to 7 were evaluated, corresponding to acquisition times between 13min20sec and 1min50sec. The effect of partition US was assessed by comparing T1H2O and FF values measured within the 17 vials at different slice levels between the fully sampled acquisition (US = 1) and the undersampled ones. The slope, intercept and Pearson correlation coefficient (R2) were assessed from a linear correlation analysis and the bias and repeatability coefficient (RPC) from Bland-Altman plots. The mean increase of the coefficient of variation (Cov) in the vials was also reported for both variables.
For the in vivo proof of concept, the 3D MRF T1-FF sequence was acquired with an US factor of 3 in the right leg of a healthy volunteer before and after an 8-minute plantar dorsi-flexion bout, and at rest on a patient suffering from inclusion body myositis (IBM).
RESULTS
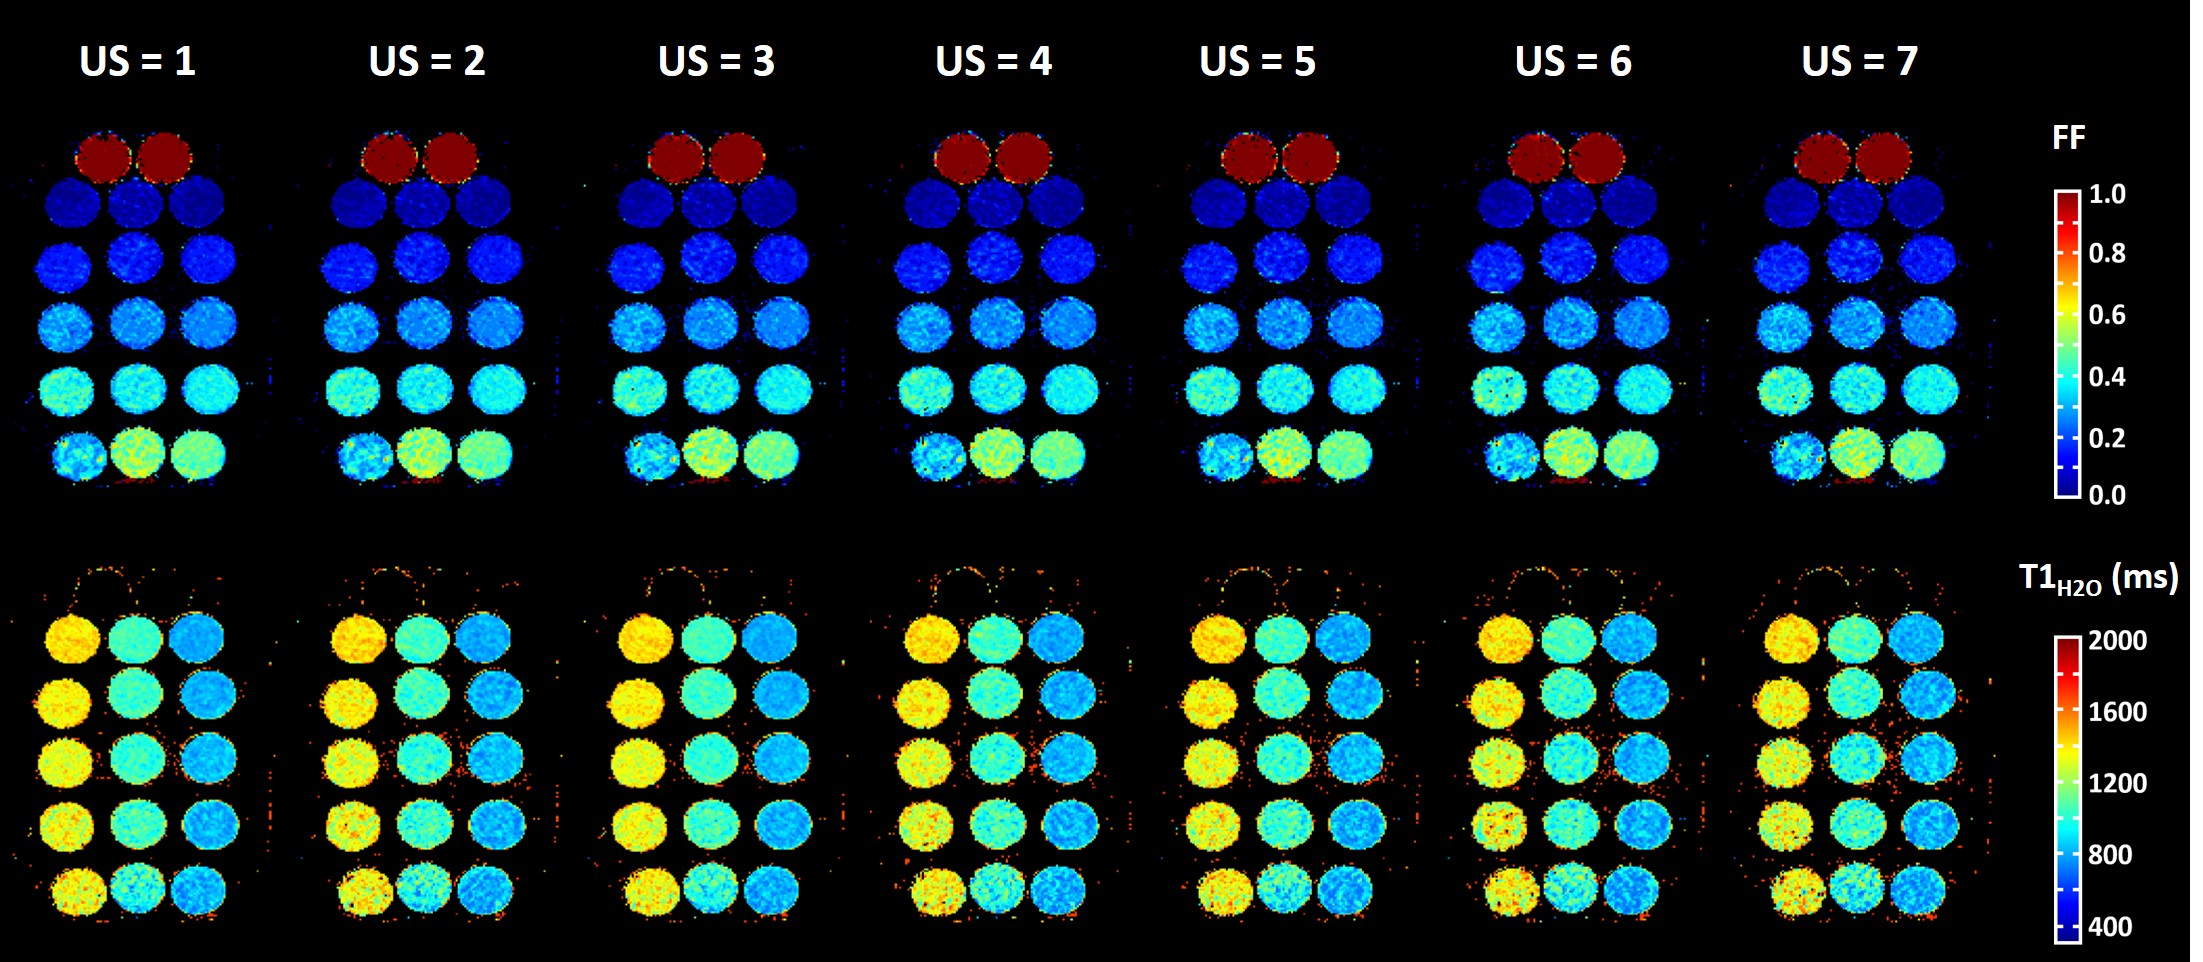
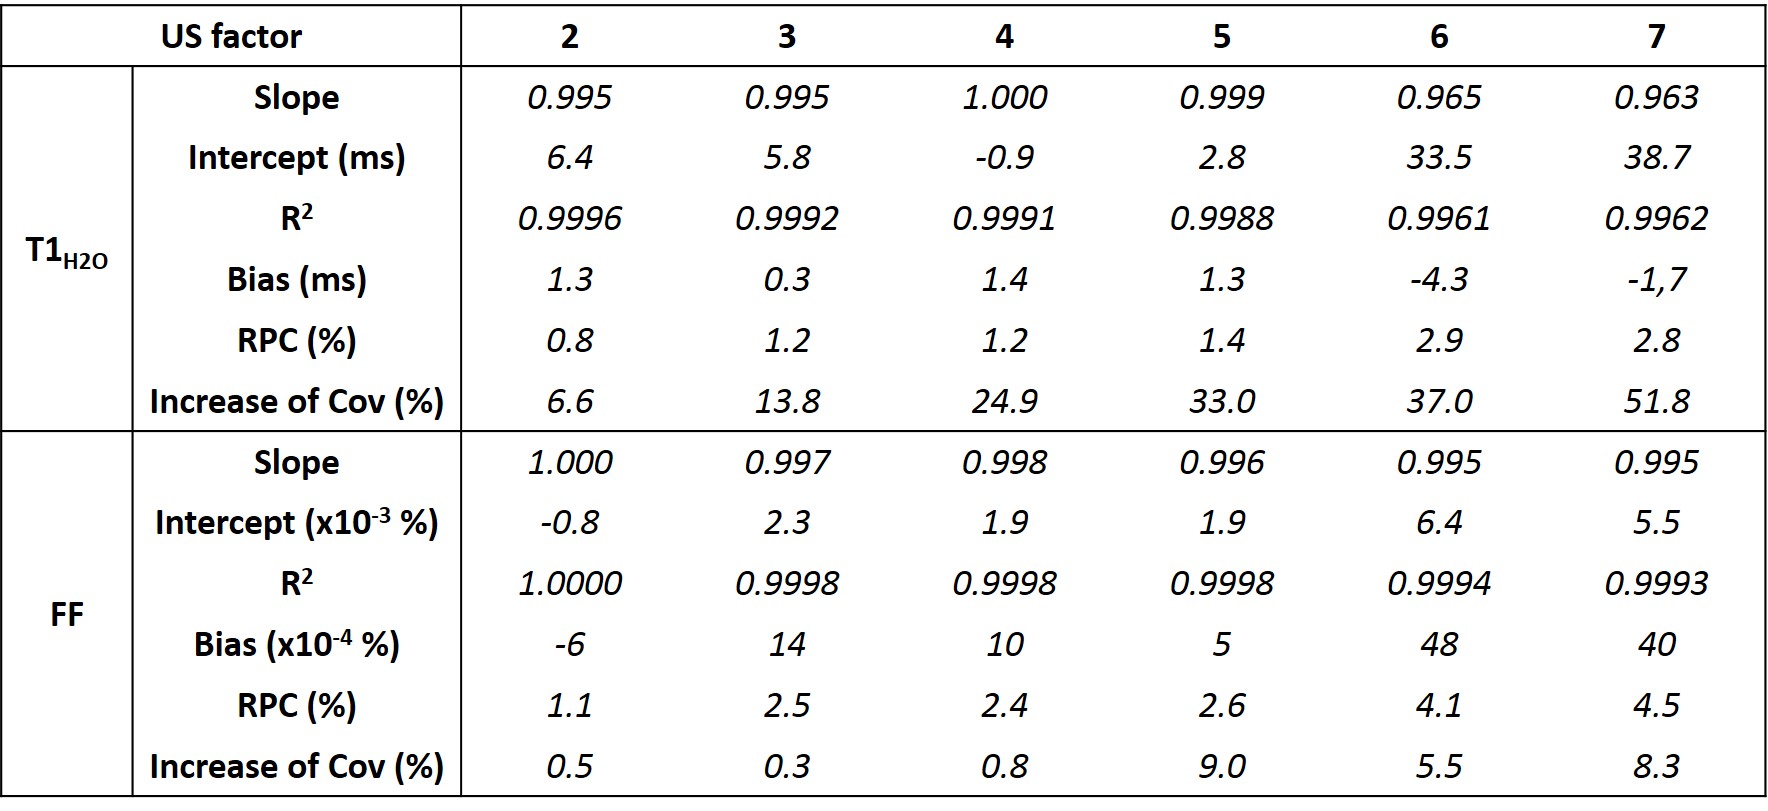
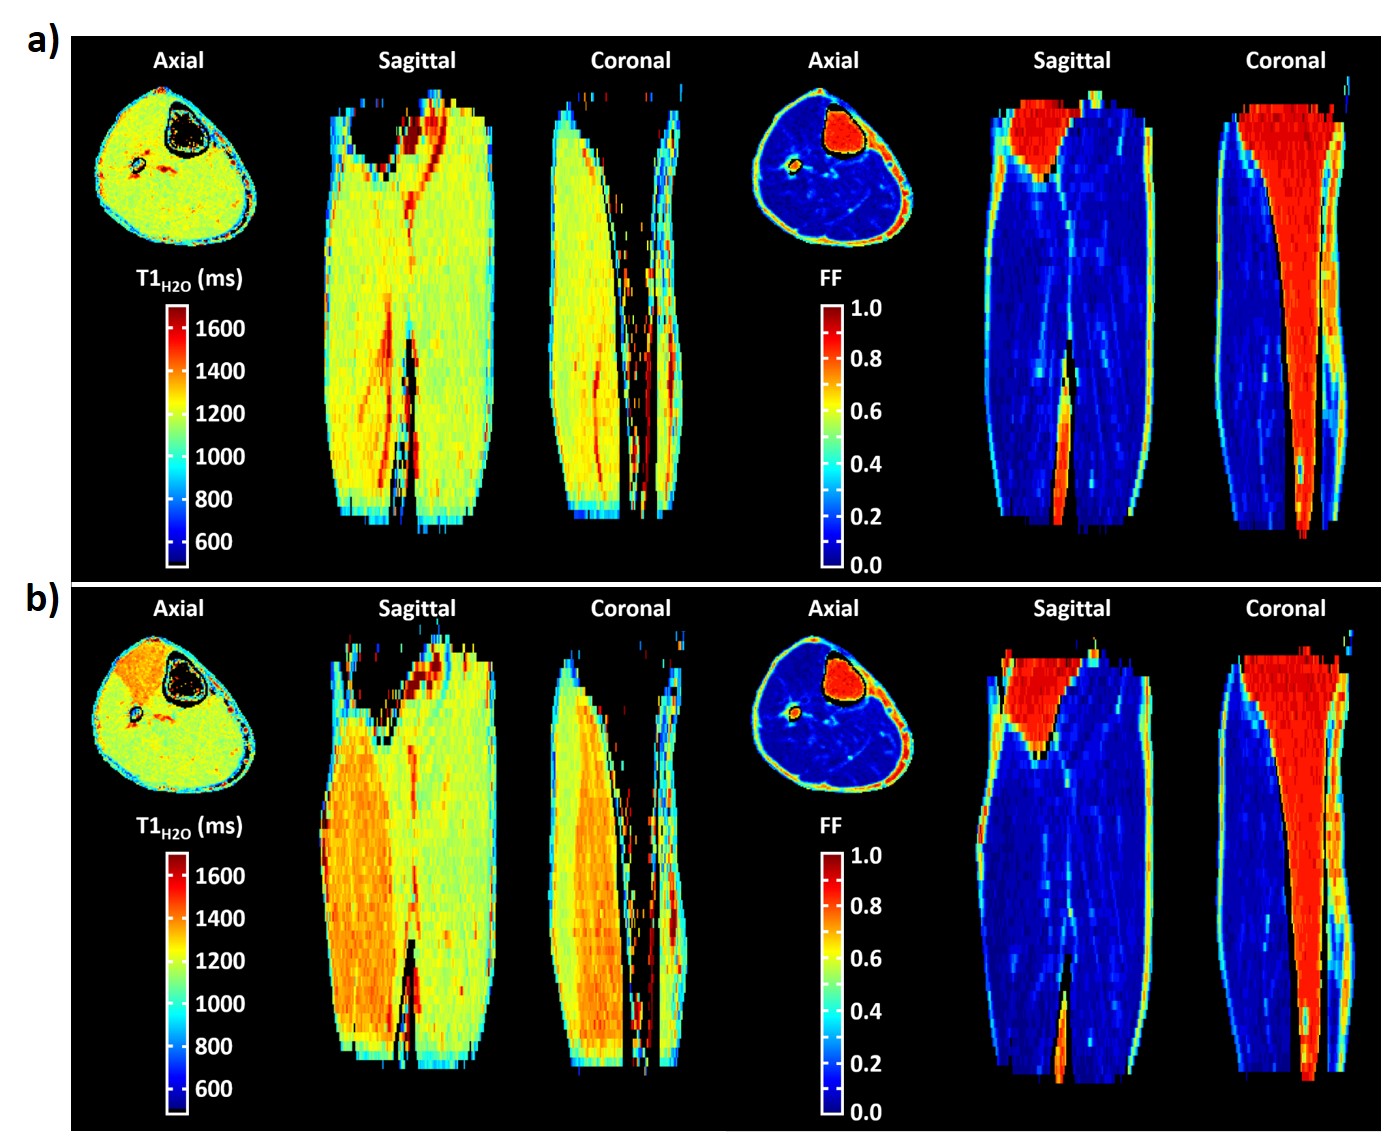
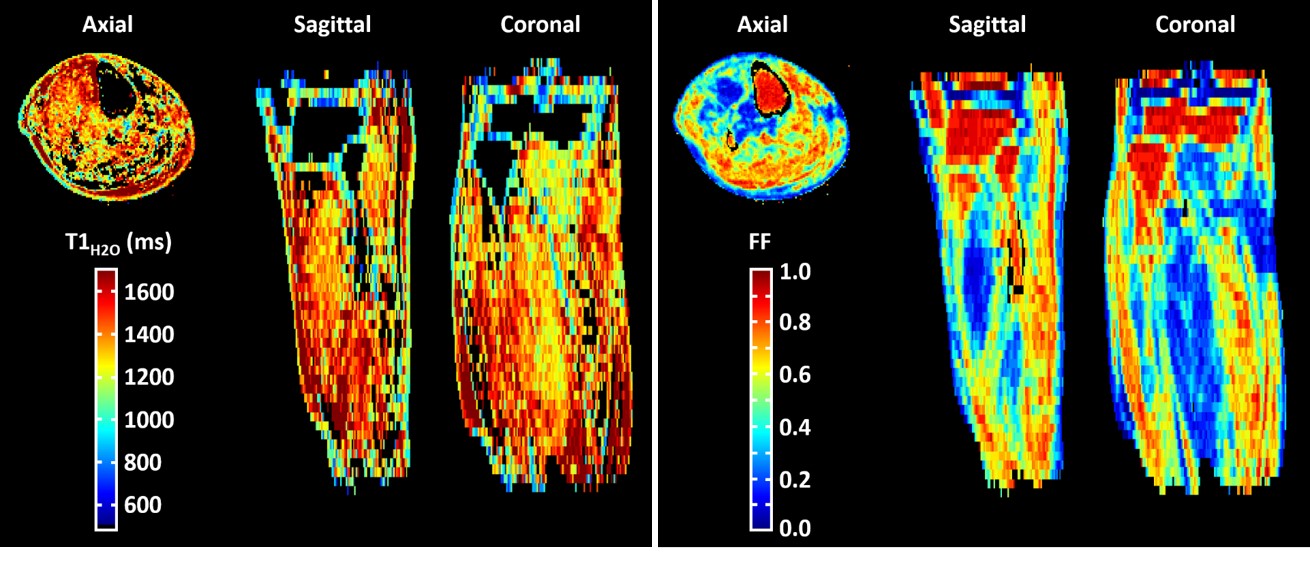
Figure 2 represents the FF and T1H2O maps of the multi-vial phantom in the axial orientation at different US factors. The quantitative analysis demonstrated an accurate measurement for both variables, with slopes between 0.995 and 1, R2 between 0.9988 and 1, minimal biases and excellent repeatability coefficients, for an US factor of up to 5 (Figure 3). Beyond this value, the accuracy decreased, especially for T1H2O. Concerning the precision, whereas the coefficient of variation was just slightly increased at all US factors for FF (< +10%), it gradually increased for T1H2O, and reached values higher than 20% for US factors above 3.Figure 4 depicts the 3D T1H2O and FF maps of the healthy volunteer before and after exercise. The plantar dorsiflexion induced a significant increase of T1H2O in the right tibialis anterior muscle. Finally, the IBM patient demonstrated a highly heterogeneous involvement throughout the leg, both for FF and T1H2O, which was clearly visible on the 3D volumes (Figure 5).
DISCUSSION AND CONCLUSION
The 3D MRF T1-FF sequence allowed to derive precise and accurate T1H2O and FF values in voxels containing a mixture of water and lipid protons. Beside the intrinsic ability of MRF for obtaining quantitative maps within short acquisition times, we demonstrated that the sequence could be further accelerated, when 3D is required, in order to obtain quantitative volumes within acquisition times compatible with clinical research. With an US factor of 3, corresponding to an acquisition time of 4min40sec, we were able to obtain a 1x1x5mm3 resolution to cover the entire leg. This sequence constitutes an appealing tool to investigate the potential role of T1H2O as an early imaging biomarker of disease severity in many NMDs, in particular for the pediatric population.Acknowledgements
No acknowledgement found.References
1- Marty et al., Magn Reson Med (2019); doi: 10.1002/mrm.27960.
2- Marty et al., Proc ISMRM (2019); #495.
3- Hooijmans et al., Neuromuscul Disord (2017);27(5):458-464.
4- Lin et al., Magn Reson Med (2009); 62(5):1185–1194
5- Ma et al., Magn Reson Med (2018); 79(4):2190-2197
Figures