1139
Multimodal qMRI Framework for Knee Imaging Biomarker Fusion and Osteoarthritis Prediction
Alejandro Morales Martinez1,2, Francesco Caliva1, Claudia Iriondo1,2, Sarthak Kamat1, Sharmila Majumdar1, and Valentina Pedoia1,2,3
1Department of Radiology and Biomedical Imaging, University of California, San Francisco, San Francisco, CA, United States, 2Graduate Program in Bioengineering, University of California, Berkeley, Berkeley, CA, United States, 3Center for Digital Health Innovation (CDHI), University of California San Francisco, San Francisco, CA, United States
1Department of Radiology and Biomedical Imaging, University of California, San Francisco, San Francisco, CA, United States, 2Graduate Program in Bioengineering, University of California, Berkeley, Berkeley, CA, United States, 3Center for Digital Health Innovation (CDHI), University of California San Francisco, San Francisco, CA, United States
Synopsis
Bone and cartilage segmentation models were trained and validated with a segmented dataset of 40 and 176 3D DESS MRI volumes respectively. The trained models were used to run inference on 20,989 3D DESS MRI volumes from the Osteoarthritis Initiative dataset. Biomarkers such as femoral bone shape, cartilage thickness and cartilage T2 average values were extracted from the segmentations. Point clouds representing each biomarker were transformed into spherical coordinates and merged using different fusion strategies. The spherical maps were used to train an OA diagnosis model with a test specificity, sensitivity and AUC was 84.1%, 78.7%, and 89.7% respectively.
Introduction
Osteoarthritis (OA) is a degenerative joint disease which affects 30 million U.S. adults1. Previous studies have established a link between early disruption to the articular cartilage structure and OA2. These disruptions of the cartilage microstructure affect the water content and elasticity of the articular cartilage and lead to early OA development3. The thickness and volume of the cartilage are affected by this process and have been used as OA biomarkers4. In addition to degeneration of soft tissues, it has been suggested that changes also occur in the subchondral and trabecular bone in OA5. While previous studies showed associations between these individual biomarkers and OA6-8, no previous study has studied the interactions between all three biomarkers. This study aims to fill this gap by exploring the ability of deep learning convolutional neural networks to use morphological and compositional features of the Femur in diagnosing radiographic OA based on Kellgren-Lawrence grade9.Methods
The Osteoarthritis Initiative (OAI) data set10 used for this study contains 3D double-echo steady-state (3D-DESS, 3T Siemens, TR/TE 16.2/4.7; FOV, 14 cm; matrix, 307x384; bandwidth, 71 kHz; and image resolution, [0.365, 0.456, 0.7] mm) and 2D multi-slice multi-echo (2D-MSME, 3T Siemens, TR/TE 2700/10,20,30,40,50,60,70; FOV, 12 cm; matrix, 269x384; bandwidth, 96 kHz; and image resolution, [0.313, 0.446, 3] mm) MRI knee scans from a total of 4,796 unique patients for 10 different time points for right knees. Overall processing pipeline is shown in Figure 1. The Femur, Tibia and Patella bones, and their respective cartilage were segmented using V-Net11 encoder-decoder architectures (Figure 1A). The 2D MSME volumes were rigidly registered and interpolated into the dimensions of the 3D DESS volumes and T2 values were fitted for the segmented cartilage masks. A total of 20,989 3D volumes were segmented and T2 fitted. The cartilage thickness was calculated using a distance transform of the cartilage masks along their morphological backbone. The cartilage thickness method was validated with a ground truth of 4,312 manually segmented femoral cartilage thickness measurements12 with an average absolute difference ranging from 0.1514 mm to 0.1645 mm, within the single voxel resolution of the 3D DESS volumes. The resulting segmentation masks were then transformed into metric-scale point clouds and rigidly registered to a reference point cloud to account for rotational variability at scan time (Figure 1B). The bone point clouds were then transformed into spherical coordinates by taking the distance from the centroid to the bone surface, in millimeters, as the intensity and the combination of angles as the pixel coordinates (Figure 2). The cartilage thickness spherical map consisted of assigning the cartilage thickness values for each subchondral bone point in the articular surface (Figure 2). The T2 average spherical map consisted of averaging the T2 values along a linear profile normal to the articular surface for each subchondral bone point (Figure 2). Different combinations of group-normalized spherical maps were merged into a 3-channel image that was used as an input for a ResNet5013 binary classifier aimed to diagnose OA (KL 0-1 vs. KL 2-3) (Figure 1D, Figure 3). The bone and cartilage segmentation models were trained and validated with 40 and 168 manually segmented masks split into 25/5/10 and 120/28/28 sets for the training, validation and test sets respectively. OA diagnosis dataset included a total of 20,989 MRI scans (12,001 (57.18%) KL 0-1 and 8,988 (42.82%) KL 2-4) split into 14,571/3,170/3,257 sets for the training, validation and test sets respectively. The demographics distribution, such as age, body mass index (BMI), and sex for the 20,989 patients was 63.01 (95% confidence interval = 62.88-63.13), 28.35 (95% confidence interval = 28.28-28.41) and 8,975/12,014 male/female respectively.Results
The mean bone segmentation Dice scores for the test set of 10 patients were 97.15% (95% confidence interval = 96.56-97.74%) for the Femur, 97.28% (95% confidence interval = 96.64-97.92%) for the Tibia, and 95.99% (95% confidence interval = 95.26-96.72%) for the Patella. The mean cartilage segmentation Dice scores for the test set of 20 patients were 89.98% (95% confidence interval = 0.88.10-91.86%) for the femoral cartilage, 88.58% (95% confidence interval = 85.34-91.82%) for the tibial cartilage and 85.76% (95% confidence interval = 79.37-92.15%) for the patellar cartilage. An overview of the bone and cartilage segmentation accuracy is shown in Figure 4. The validation specificity, sensitivity and area under the curve (AUC) for the single biomarker and biomarker fusion models for the OA Diagnosis model are summarized in Figure 5. The test specificity, sensitivity and AUC for the selected majority voting OA Diagnosis model was 84.1%, 78.7%, and 89.7% respectively.Discussion and Conclusions
With this study, we have established a model for prediction of radiographic OA exploiting the interactions between three different OA-related imaging biomarkers, femoral bone shape, femoral cartilage thickness and femoral cartilage T2 values. While previous studies have shown associations between each individual biomarker and OA, this study is the first to use deep learning to predict radiographic OA using a combination of the three biomarkers over the entire OAI. Future directions include adding the contribution of the tibial and patellar bone shape and cartilage thickness and T2 values.Acknowledgements
No acknowledgement found.References
- Cisternas MG, Murphy L, Sacks JJ, Solomon DH, Pasta DJ, Helmick CG. Alternative Methods for Defining Osteoarthritis and the Impact on Estimating Prevalence in a US Population-Based Survey. Arthritis Care Res. 2016;68(5):574-580. doi:10.1002/acr.22721
- Bhosale AM, Richardson JB. Articular cartilage: structure, injuries and review of management. Br Med Bull. 2008;87(1):77-95. doi:10.1093/bmb/ldn025
- Goodwin DW, Dunn JF. High-Resolution Magnetic Resonance Imaging of Articular Cartilage: Correlation with Histology and Pathology. Top Magn Reson Imaging. 1998;9(6):337.
- Eckstein F, Wirth W. Quantitative Cartilage Imaging in Knee Osteoarthritis. Arthritis. 2011;2011. doi:10.1155/2011/475684
- Pauwels F. Biomechanics of the Locomotor Apparatus: Contributions on the Functional Anatomy of the Locomotor Apparatus. Berlin Heidelberg: Springer-Verlag; 1980. https://www.springer.com/us/book/9783642671401. Accessed June 12, 2019.
- Neogi T, Bowes MA, Niu J, et al. Magnetic Resonance Imaging-Based Three-Dimensional Bone Shape of the Knee Predicts Onset of Knee Osteoarthritis: Data From the Osteoarthritis Initiative: 3-D Bone Shape Predicts Incident Knee OA. Arthritis Rheum. 2013;65(8):2048-2058. doi:10.1002/art.37987
- Carballido-Gamio J, Stahl R, Blumenkrantz G, Romero A, Majumdar S, Link TM. Spatial analysis of magnetic resonance T1ρ and T2 relaxation times improves classification between subjects with and without osteoarthritis. Med Phys. 2009;36(9):4059-4067. doi:10.1118/1.3187228
- Reichenbach S, Yang M, Eckstein F, et al. Does cartilage volume or thickness distinguish knees with and without mild radiographic osteoarthritis? The Framingham Study. Ann Rheum Dis. 2010;69(1):143-149. doi:10.1136/ard.2008.099200
- Kohn MD, Sassoon AA, Fernando ND. Classifications in Brief: Kellgren-Lawrence Classification of Osteoarthritis. Clin Orthop. 2016;474(8):1886-1893. doi:10.1007/s11999-016-4732-4
- Peterfy CG, Schneider E, Nevitt M. The osteoarthritis initiative: report on the design rationale for the magnetic resonance imaging protocol for the knee. Osteoarthr Cartil OARS Osteoarthr Res Soc. 2008;16(12):1433-1441. doi:10.1016/j.joca.2008.06.016
- Milletari F, Navab N, Ahmadi S-A. V-Net: Fully Convolutional Neural Networks for Volumetric Medical Image Segmentation. June 2016. https://arxiv.org/abs/1606.04797.
- Wirth W, Eckstein F. A Technique for Regional Analysis of Femorotibial Cartilage Thickness Based on Quantitative Magnetic Resonance Imaging. IEEE Trans Med Imaging. 2008;27(6):737-744. doi:10.1109/TMI.2007.907323
- He K, Zhang X, Ren S, Sun J. Deep Residual Learning for Image Recognition. ArXiv151203385 Cs. December 2015. http://arxiv.org/abs/1512.03385.
Figures
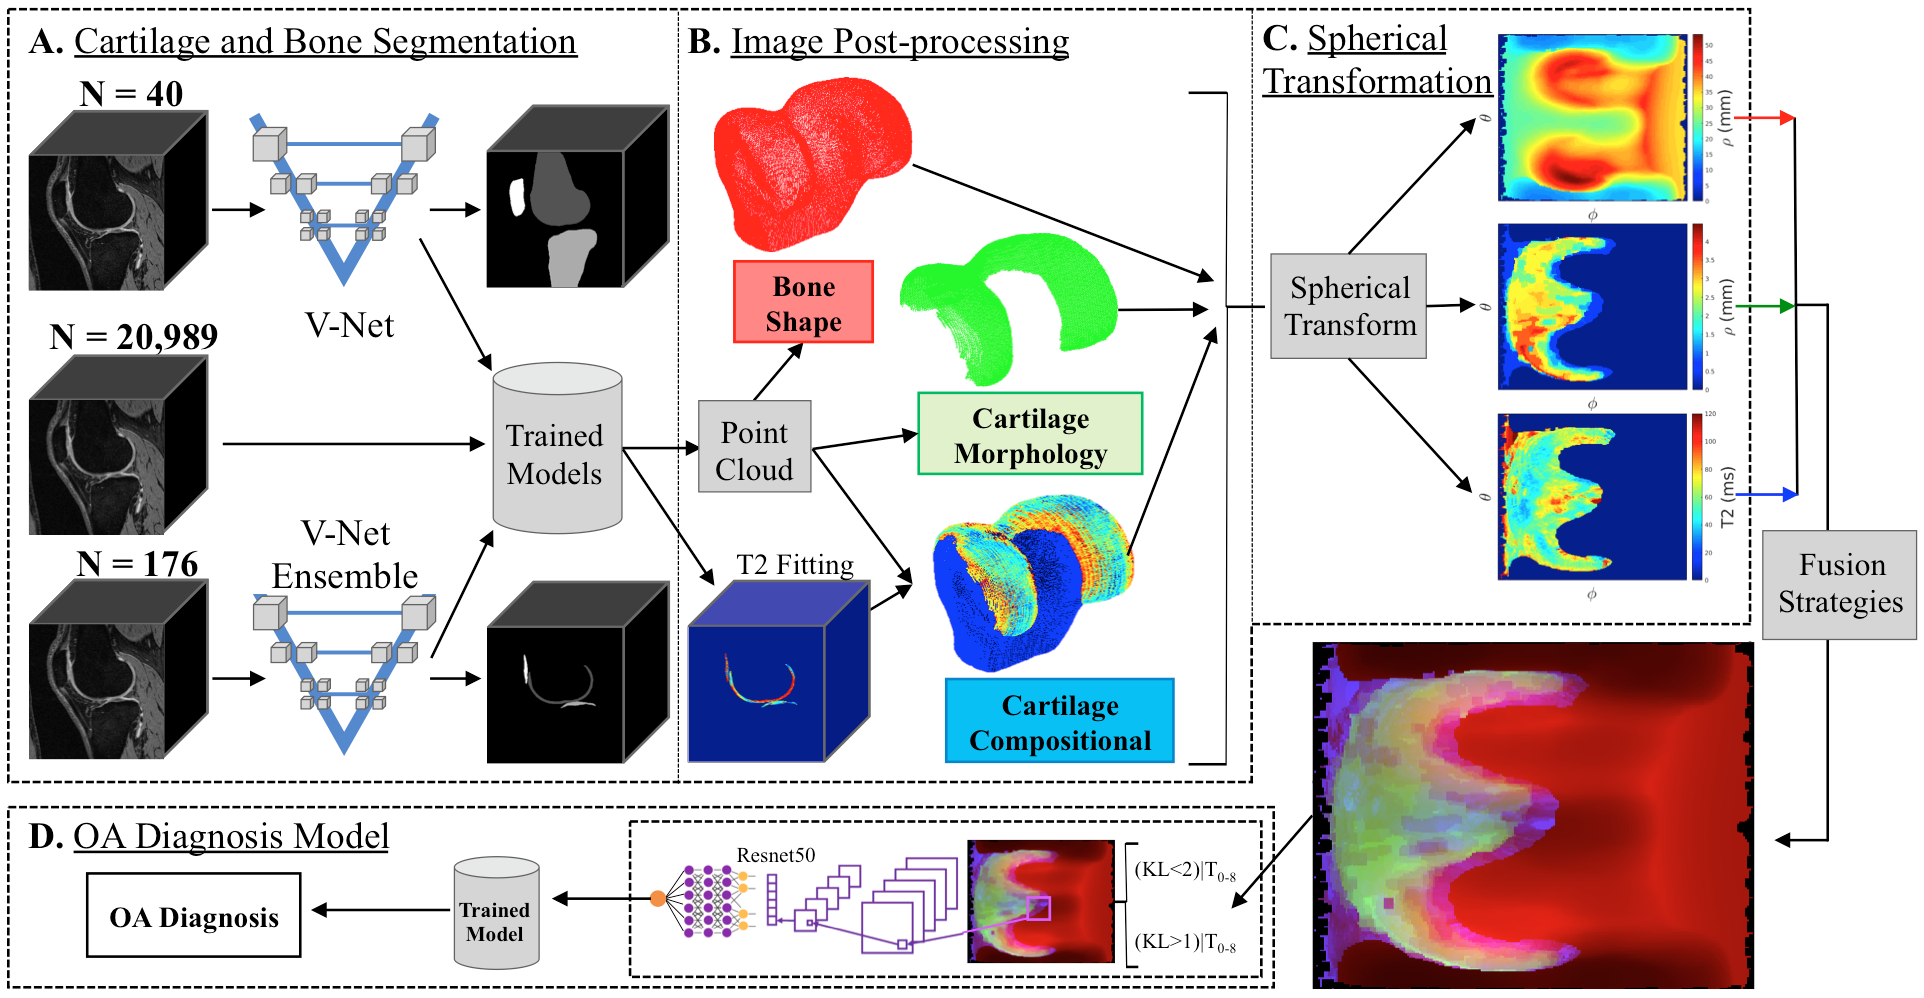
Figure 1. (A),
Bone and cartilage segmentation models were trained and validated with a
segmented dataset of 40 and 176 3D DESS MRI volumes respectively. The trained
models were used to run inference on 20,989 3D DESS MRI volumes from the
Osteoarthritis Initiative (OAI) dataset. (B)
Biomarkers
such as bone shape, cartilage thickness and cartilage T2 average values were
extracted from the segmentations.
(C),
The point clouds were transformed to spherical coordinates and merged using
different fusion strategies. (D), The spherical maps were used to
train an OA diagnosis model.
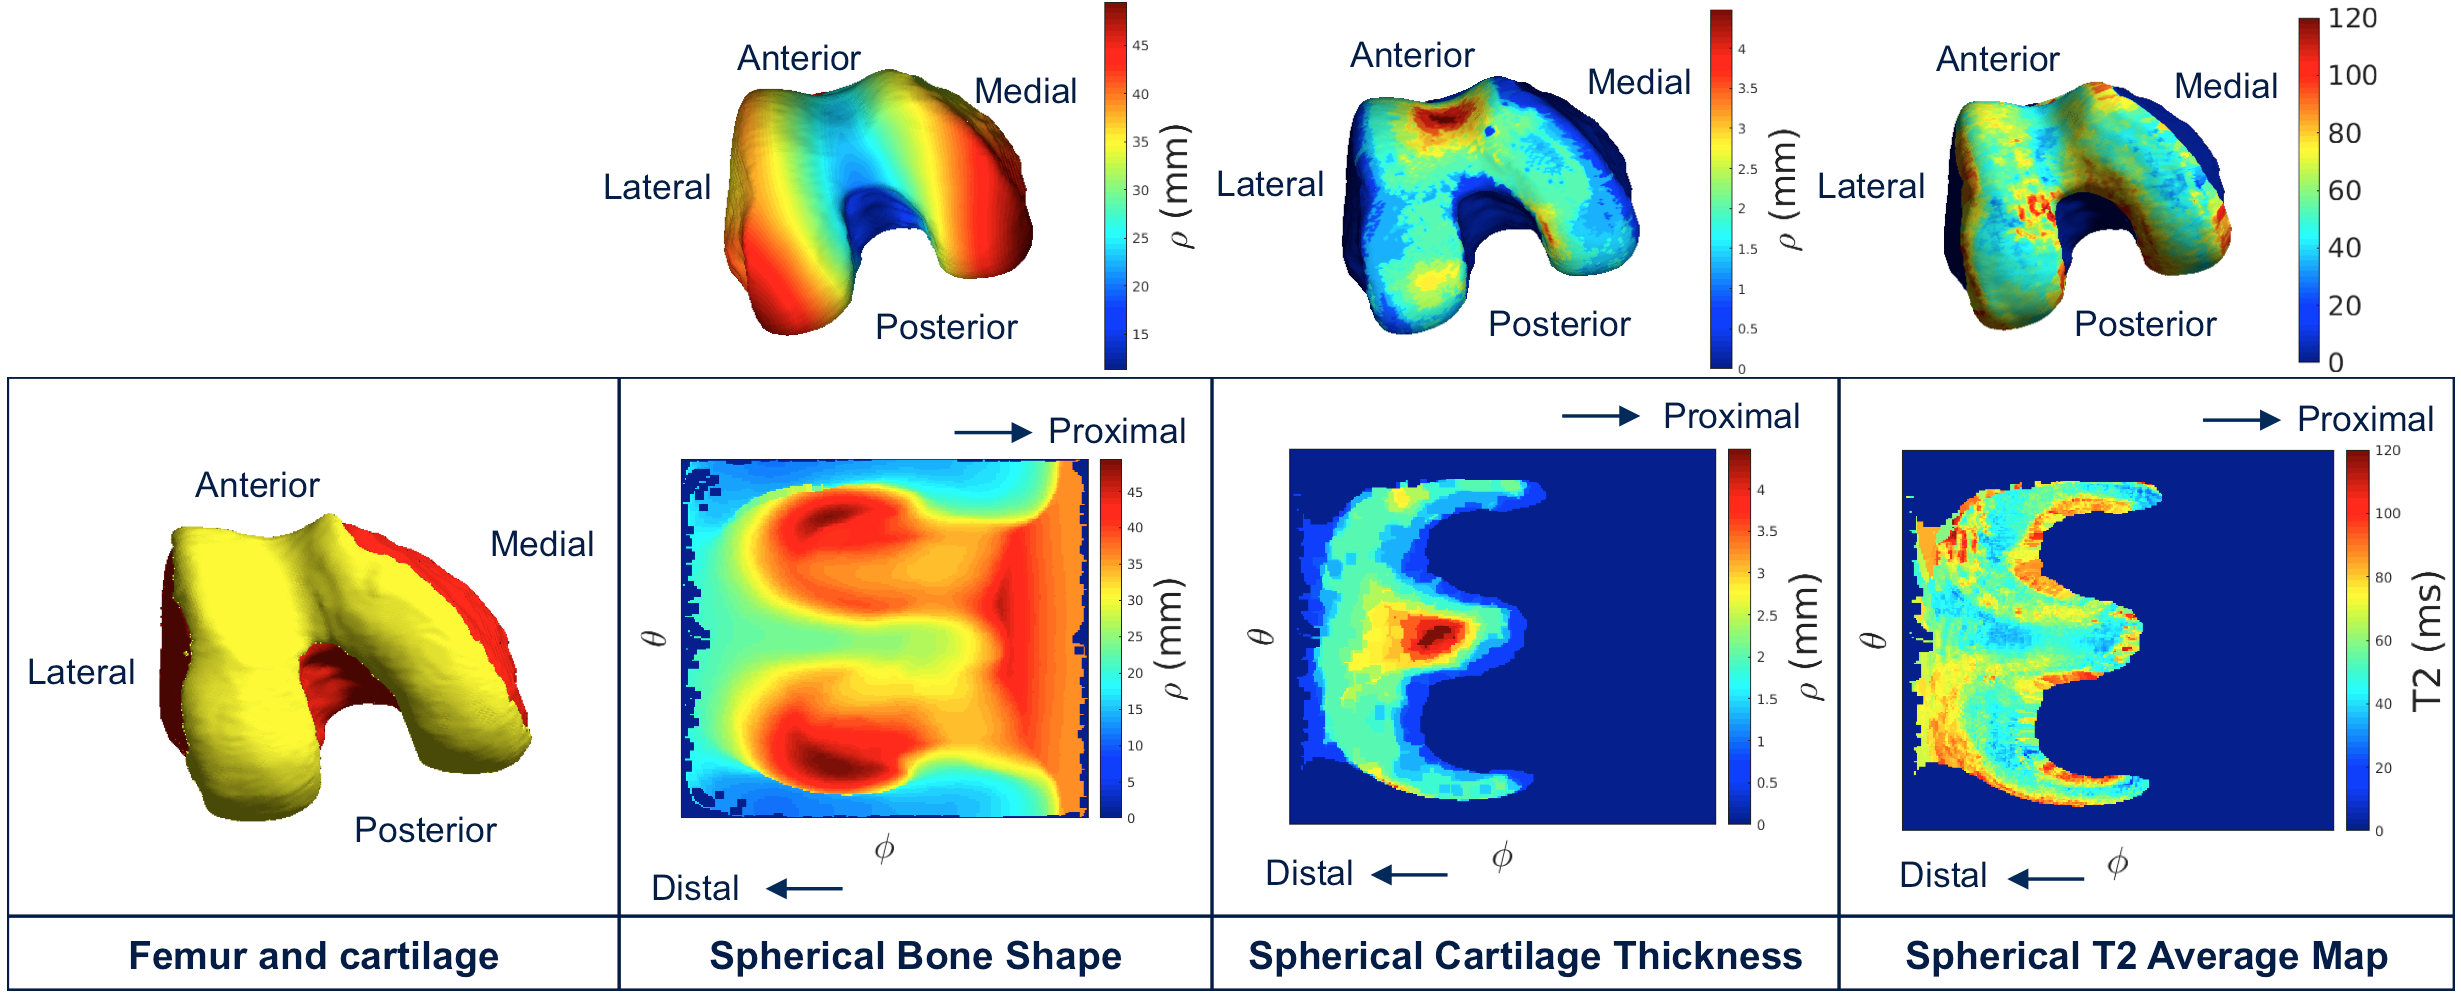
Figure 2. Spherical
transformation
of the biomarkers. The articular surface of a Femur is shown with the Cartesian
and spherical coordinates. Each point in the surface of the 3D point cloud was
transformed into a 2D point in a bone shape spherical map
where the location was encoded with the two angles (θ, φ) and
the distance from the centroid of the point cloud was encoded as the image intensity. The Femur cartilage thickness and T2 average spherical maps are
calculated for the points in the articular femoral bone surface.
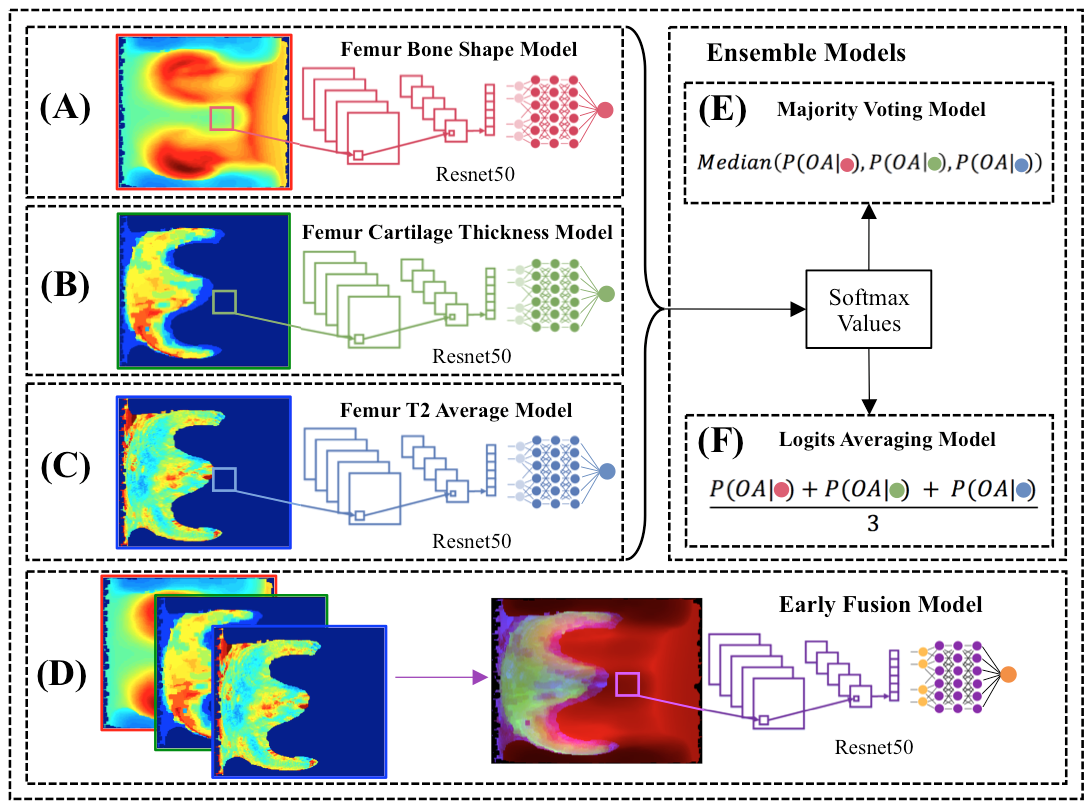
Figure 3. (A-C), The single femur
biomarker models, with
the bone shape, cartilage thickness, T2 average, shown in
order, consisted
of replicated 3-channel images used as
inputs into a
CNN. (D), The
early fusion model merged each of the single biomarker spherical maps
into an 3-channel image
used
as input into a
CNN. (E), Majority voting selected the
majority predictions from the single biomarker models,
(shown as red, green and blue circles) for the OA diagnosis.
(F), Logits averaging
averaged
the softmax
values from the single
biomarker models for the OA
diagnosis.
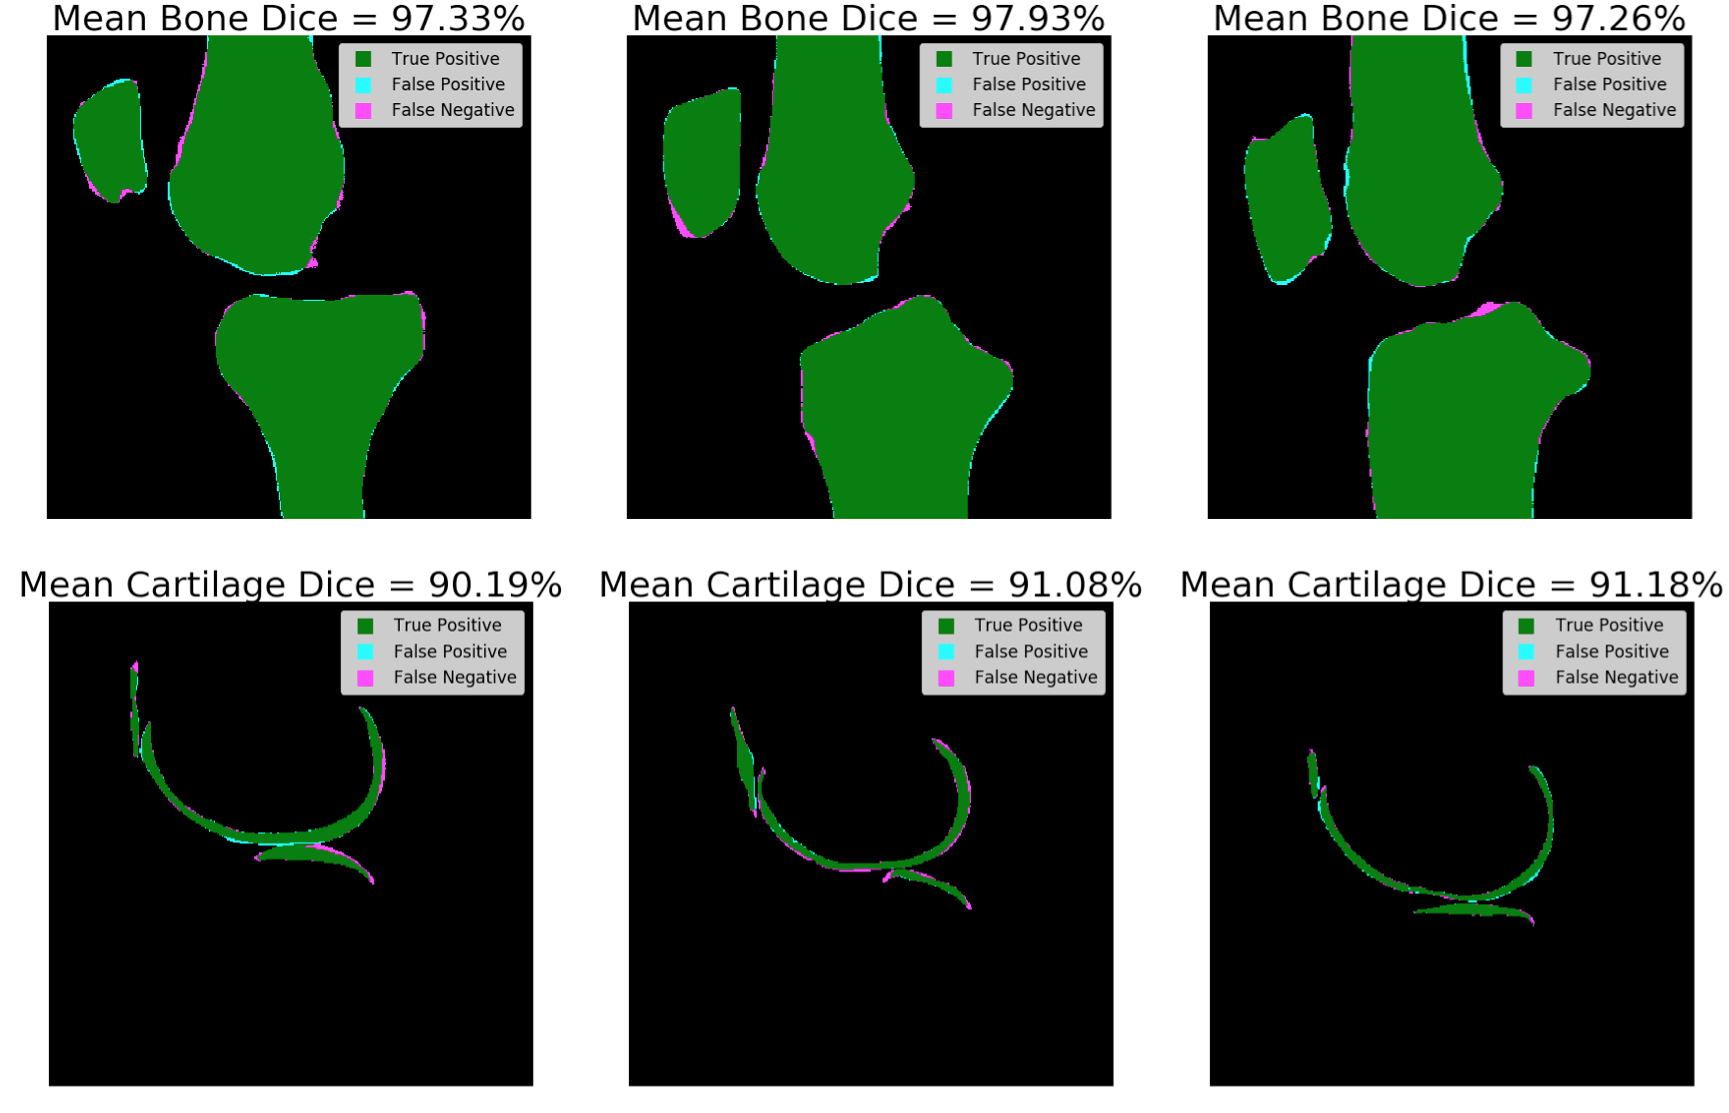
Figure 4. The
mean
bone and cartilage dice from three different patients in the respective
segmentation test sets with one representative slice shown. The
pixels in agreement between the trained segmentation models
inference
and the ground truths are labeled as green, representing the true positive
cases. The pixels incorrectly classified as bone or cartilage by
the trained segmentation models
are
labeled as cyan, representing the false positive cases. The pixels missed by
the trained segmentation models
are
labeled as magenta, representing the false negative cases.
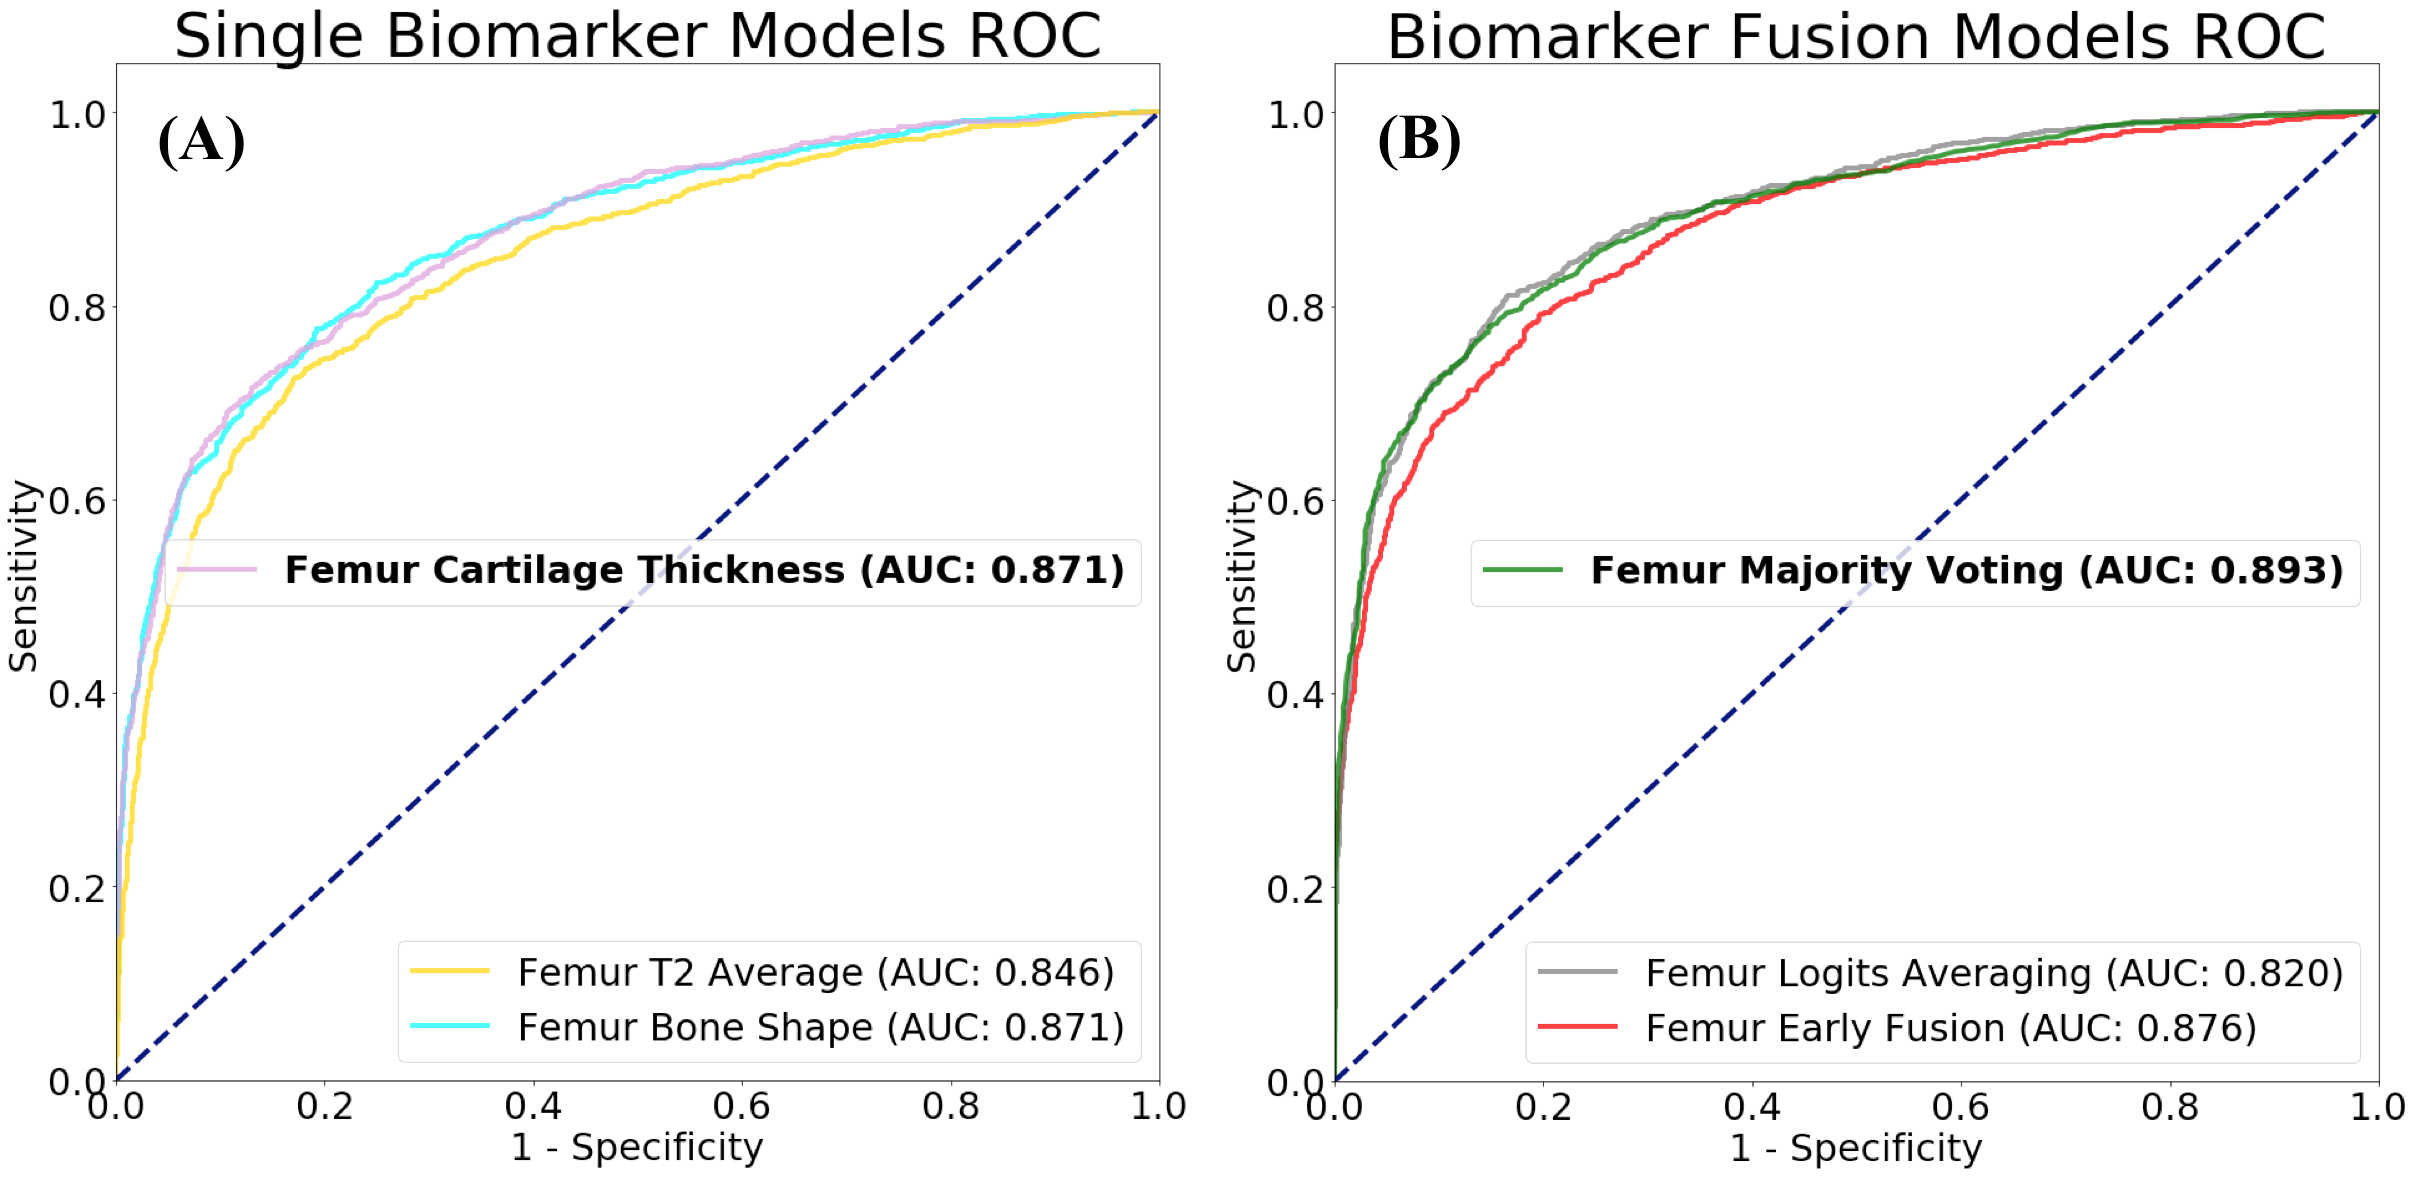
Figure 5. Overview of the validation ROC curve
comparisons for the different single
biomarker and biomarker fusion models. (A), Single biomarker
models. (B), Biomarker fusion models.