1127
Simple Anatomical Measures Correlate with Individual PNS Thresholds for kHz-range Homogeneous Magnetic Fields
Omer Burak Demirel1,2,3,4, Toygan Kilic1,2, Tolga Çukur1,2,5, and Emine Ulku Saritas1,2,5
1Electrical and Electronics Engineering, Bilkent University, Ankara, Turkey, 2National Magnetic Resonance Research Center (UMRAM), Bilkent University, Ankara, Turkey, 3Center for Magnetic Resonance Research, University of Minnesota, Minneapolis, MN, United States, 4Electrical and Computer Engineering, University of Minnesota, Minneapolis, MN, United States, 5Neuroscience Graduate Program, Bilkent University, Ankara, Turkey
1Electrical and Electronics Engineering, Bilkent University, Ankara, Turkey, 2National Magnetic Resonance Research Center (UMRAM), Bilkent University, Ankara, Turkey, 3Center for Magnetic Resonance Research, University of Minnesota, Minneapolis, MN, United States, 4Electrical and Computer Engineering, University of Minnesota, Minneapolis, MN, United States, 5Neuroscience Graduate Program, Bilkent University, Ankara, Turkey
Synopsis
This work shows for the first time that fat percentage strongly correlates with peripheral nerve stimulation (PNS) thresholds for kHz-range homogeneous magnetic fields. The correlations get even stronger after taking into account the effects of body part size that is exposed to the magnetic field. These types of magnetic fields are used as excitation field in Magnetic Particle Imaging (MPI). Hence, these results can potentially lead to subject specific threshold prediction, allowing high performance scans within subject specific safety limits.
Purpose
To predict subject specific peripheral nerve stimulation (PNS) thresholds using simple anatomical measures, and to enable high performance scans within subject specific safety limitsIntroduction
Magnetic Particle Imaging (MPI) is an emerging biomedical imaging modality that utilizes time-varying magnetic fields to image the spatial distribution of magnetic nanoparticles [1-2]. In MPI, the excitation field, called the drive field, typically operates around 25 kHz, although there are systems that operate between 1 kHz and 150 kHz. The main safety concern for this relatively low-frequency excitation field is peripheral nerve stimulation (PNS) [3-5]. Previous human subject studies investigated the effects of drive field parameters (such as its frequency, duration, and duty cycle) on PNS thresholds [3-8]. Those studies showed a strong linear correlation between PNS thresholds and the inverse of body part size exposed to the field. In this work, we investigate the effects of fat percentage on PNS thresholds to show that it may be possible to predict subject specific thresholds using simple anatomical measures.Results
PNS Experiments: This study was approved by Bilkent University Ethics Committee. To determine PNS thresholds, human subject experiments were performed on the upper arms of 10 healthy male subjects (age: 26 ± 2 yr). Three repetitions were performed for each subject using the solenoidal coil shown in Fig. 1a, which created a highly homogeneous magnetic field near its center. Magnetic pulses at 25 kHz with 100 ms duration were applied with 4-second intervals. Whenever the subject felt a nerve stimulation sensation, they reported it via a mouse click. The amplitude of the next magnetic pulse was adjusted based on subject response. Individual subject responses were fitted to a sigmoid curve, with 50% crossing of the sigmoid curve corresponding to the PNS threshold, $$$B_{th}$$$.MRI Experiments: Two-point Dixon imaging [9] was performed on the upper arms of the subjects on a 3T MRI scanner (Siemens Magnetom Trio) using an 8-channel spine matrix coil, yielding separate images of water and fat tissues, as shown in Fig. 1c. The imaging parameters were: TR = 5.27 ms, TE1 = 2.45 ms, TE2 = 3.675 ms, flip angle = 9o, axial plane, FOV = 380x285 mm2, matrix size = 320x240, and 32 s total scan time.
Anatomical measures were derived from water and fat tissue images. The effective outer radius of the upper arm, $$$r_{out}$$$, was measured from the images as the circumference of the arm divided by 2π. The effective fat percentage, $$$Fat\%$$$,was calculated using the normalized and summed water and images, $$$I_F[m,n]$$$ and $$$I_W[m,n]$$$, as follows:$$Fat\%=\frac{\sum_{m,n}{I_F[m,n]}}{\sum_{m,n}{(I_F[m,n] +I_W[m,n])} }$$
Statistical Analysis: Pearson’s correlation coefficient was used to assess the linear relationships between the threshold and the anatomical measures. Next, the expected effects of body part size were factored out. Based on our previous work, there is a strong correlation between the PNS threshold and the inverse of the effective radius of the body part exposed to the magnetic field, given as follows [3]:$$B_{th}=\frac{\lambda_{fit}}{r_{out}}$$
Using this equation, we computed the expected threshold, $$$B_{exp}$$$, for a given $$$r_{out}$$$. Then, we factored out this effect by computing $$$B_{th}/B_{exp}$$$, and evaluated the linear relationships between the anatomical measured and $$$B_{th}/B_{exp}$$$.
Results and Discussion
Figure 1b shows the PNS thresholds for 3 repetitions of experiments for each subject. Figure 2 displays the PNS thresholds as functions of $$$r_{out}$$$ and $$$Fat\%$$$. Accordingly, there was no significant correlation between $$$r_{out}^{-1}$$$ and $$$B_{th}$$$ (r=0.145, p>0.690). This result was expected given the narrow size distribution in arm sizes for the recruited subjects (a side effect of the hardware limitations). In contrast, a strong correlation was seen between $$$Fat\%$$$ and $$$B_{th}$$$ (r=0.783, p<0.008).Next, the expected effects of $$$r_{out}$$$ were factored out by computing $$$B_{th}/B_{exp}$$$, and the resulting deviations from the expected thresholds were plotted as functions of $$$r_{out}$$$ and $$$Fat\%$$$, as given in Fig. 3. As expected, no significant correlation was seen between $$$r_{out}^{-1}$$$ and $$$B_{th}/B_{exp}$$$ (r=-0.270, p>0.449). In contrast, the correlation with $$$Fat\%$$$ became stronger after factoring out the effects of $$$r_{out}$$$ (r=0.839, p<0.003). These results indicate that fat percentage can in fact explain inter-subject variability in PNS thresholds, even after accounting for variability that can be due to body part size.
A possible mechanism for the $$$Fat\%$$$ dependence of PNS thresholds could be that conductive materials under time-varying magnetic fields cause an increase in the electric field in their immediate exterior vicinity. Hence, the presence of a thin fat layer can position the peripheral nerves (which are mostly within the skin layer) closer to the conductive muscle tissue, resulting in a higher electric field on the nerves and thereby a decreased PNS threshold [10,11]. A similar PNS experiment for MRI gradient fields was not able to demonstrate any correlation between body part size and $$$B_{th}$$$ or between $$$Fat\%$$$ and $$$B_{th}$$$ [10], which can due to competing dependencies with respect to simple anatomical measures caused by the linear variation in the magnetic field.
Conclusion
This work shows for the first time that fat percentage is strongly correlated with PNS thresholds for kHz-range homogeneous magnetic fields, like the drive field in MPI. These results have important practical implications for predicting subject specific thresholds, and may enable higher performance scans while avoiding PNS.Acknowledgements
This work was supported by the Turkish Academy of Sciences through TUBA-GEBIP 2015 program, and by the Science Academy through BAGEP 2016 award.References
- B. Gleich and J. Weizenecker, “Tomographic imaging using the nonlinear response of magnetic particles,” Nature, 435(7046): 1214–1217, 2005.
- B. Zheng, E. Yu, R. Orendorff, K. Lu, J. J. Konkle, Z. W. Tay, D. Hensley, X. Y. Zhou, P. Chandrasekharan, E. U. Saritas, P. W. Goodwill, J. D. Hazle, and S. M. Conolly, “Seeing spios directly in vivo with magnetic particle imaging,” Molecular Imaging and Biology, 19:385–390, 2017.
- Saritas EU, Goodwill PW, Zhang GZ, Conolly SM. "Magnetostimulation limits in magnetic particle imaging. IEEE Trans Med Imaging", 32(9):1600-1610, 2013.
- Schmale I, Gleich B, Schmidt J, et al. "Human PNS and SAR study in the frequency range from 24 to 162 kHz". Proc of 5th International Workshop on Magnetic Particle Imaging (IWMPI), Berkeley, CA, USA; 2013.
- Schmale I, Gleich B, Rahmer J, Bontus C, Schmidt J, Borgert J. "MPI Safety in the View of MRI Safety Standards". IEEE Trans Magn, 51(2):1-4, 2015.
- Saritas EU, Goodwill PW, Conolly SM. Effects of pulse duration on magnetostimulation thresholds. Medical Physics, 42(6):3005-3012, 2015.
- Demirel OB, Saritas EU. "Effects of Duty Cycle on Magnetostimulation Thresholds in MPI". International Journal on Magnetic Particle Imaging, 3(1):1703010, 2017.
- Yu E, Saritas EU, Conolly SM. "Comparison of magnetostimulation limits for axial and transverse drive fields in MPI". Proc of 5th International Workshop on Magnetic Particle Imaging (IWMPI), Berkeley, CA, USA; 2013.
- Dixon WT. "Simple Proton Spectroscopic Imaging". Radiology, 153(1):189-194, 1984.
- Chronik BA, Ramachandran M. "Simple anatomical measurements do not correlate significantly to individual peripheral nerve stimulation thresholds as measured in MRI gradient coils". J Magn Reson Imaging, 17(6):716-721, 2003.
- Davids M, Guérin B, Malzacher M, Schad LR, Wald LL. "Predicting Magnetostimulation Thresholds in the Peripheral Nervous System using Realistic Body Models". Scientific Reports, 7(1):565–14, 2017.
Figures
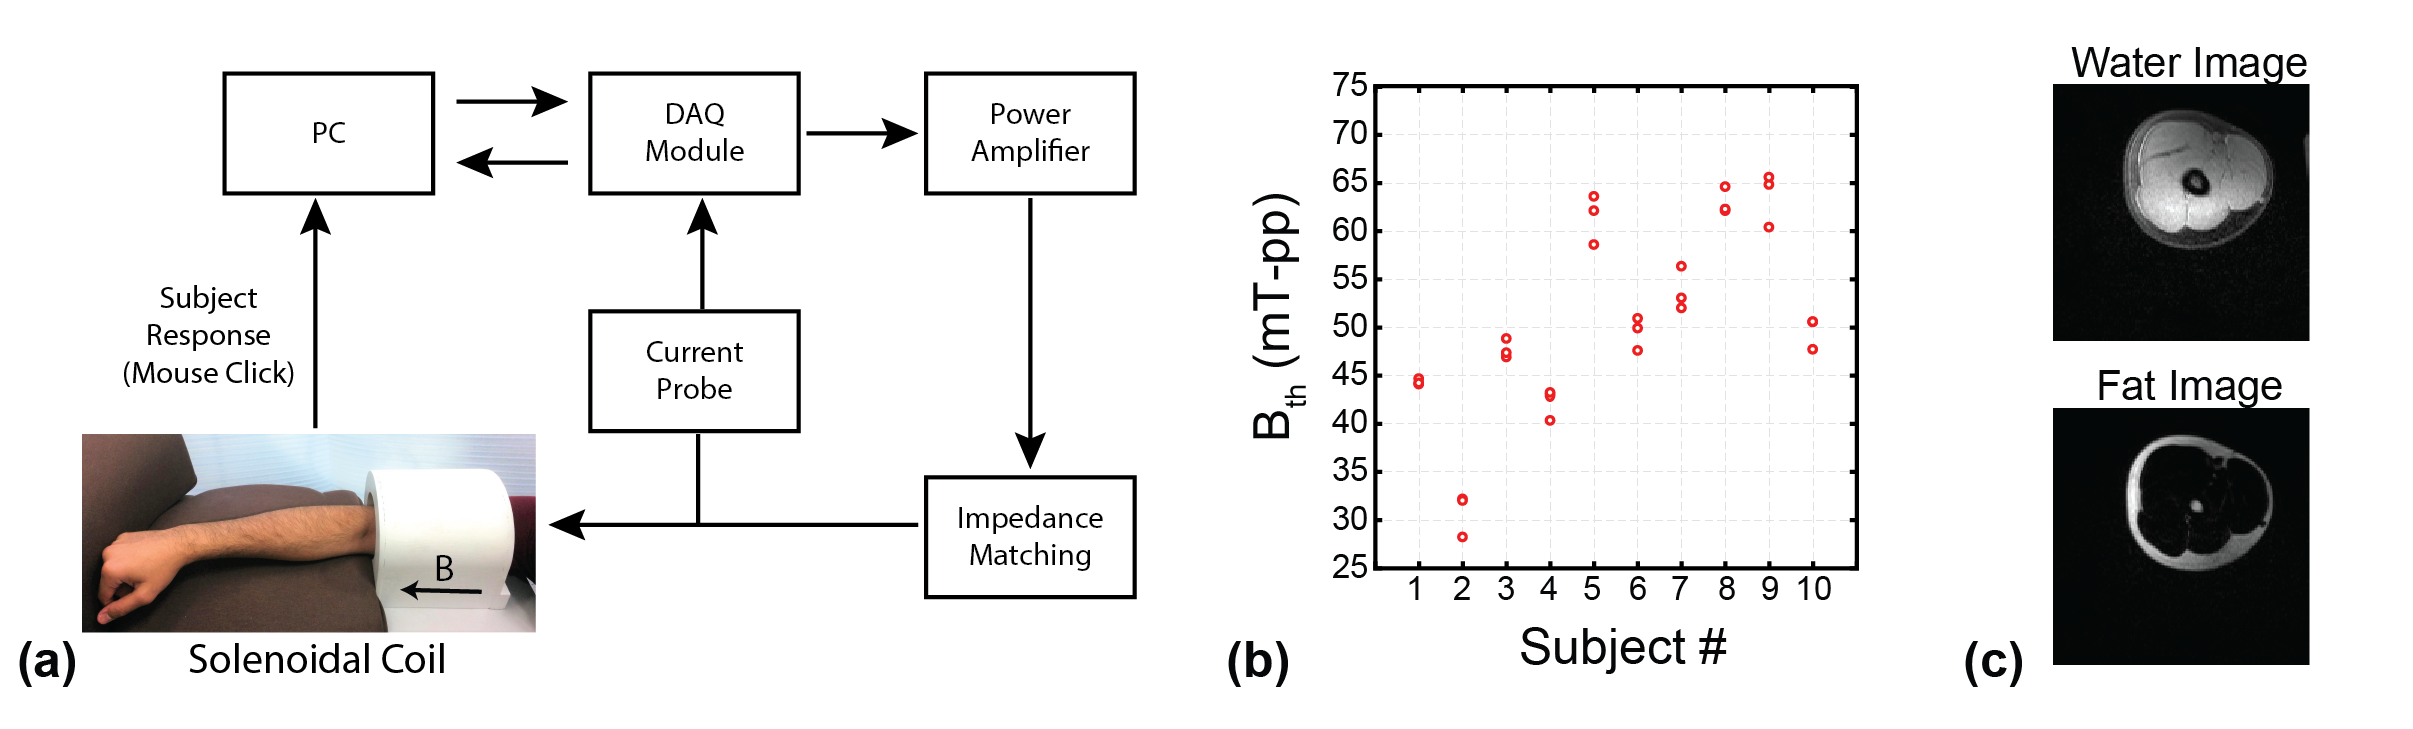
Figure 1: (a) Flowchart of PNS experiments conducted in the upper arm at 25 kHz, using a solenoidal coil with a homogeneous axial magnetic field. (b) PNSthresholds of 10 subjects with 3 repetitions each. The mean threshold was 50.6 mT-pp with a maximum deviation of 44%, showing a broad inter-subjectvariation. The intra-subject variation was relatively limited, ranging between a maximum deviation of 0.77% (Subject #1) and 8.38% (Subject #2). (c) Tocompute fat percentage, two-point Dixon method was used to obtain water and fat tissue images from axial slices in the mid-upper arm region.
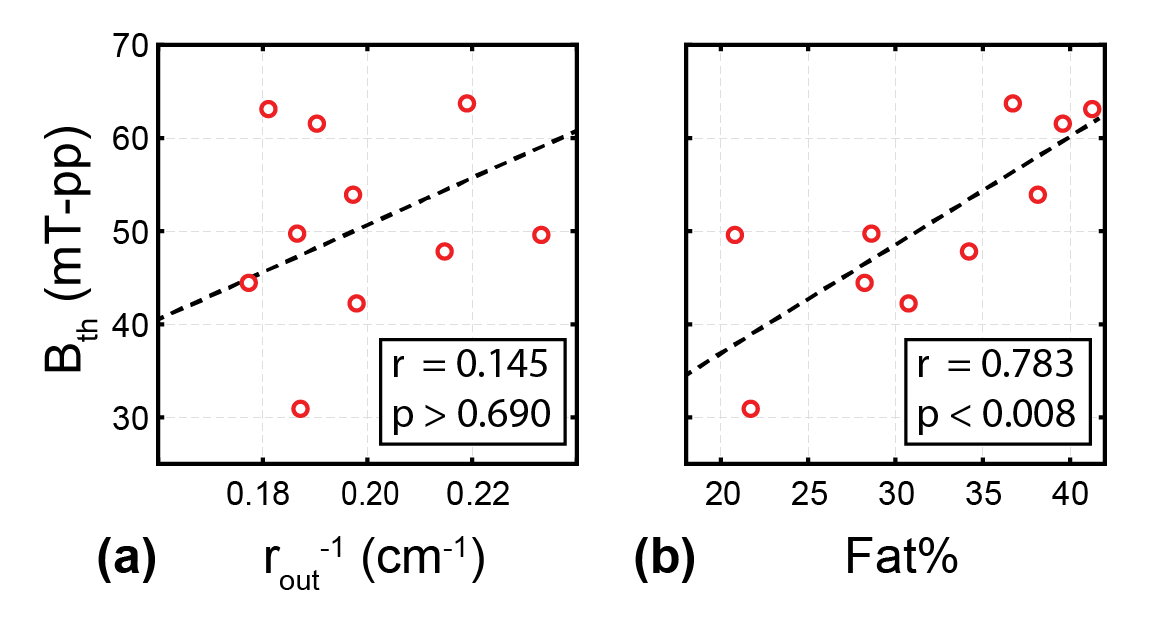
Figure 2: PNS thresholds from all 10 subjects, plotted as functions of the simple anatomical measures extracted from the MRI images. The black dashed lines show the linear fits to data points. (a) No significant correlation was found between the inverse of the outer radius and Bth (r=0.145, p>0.690). (b) A strong correlation was found between Fat% and Bth (r=0.783, p<0.008).
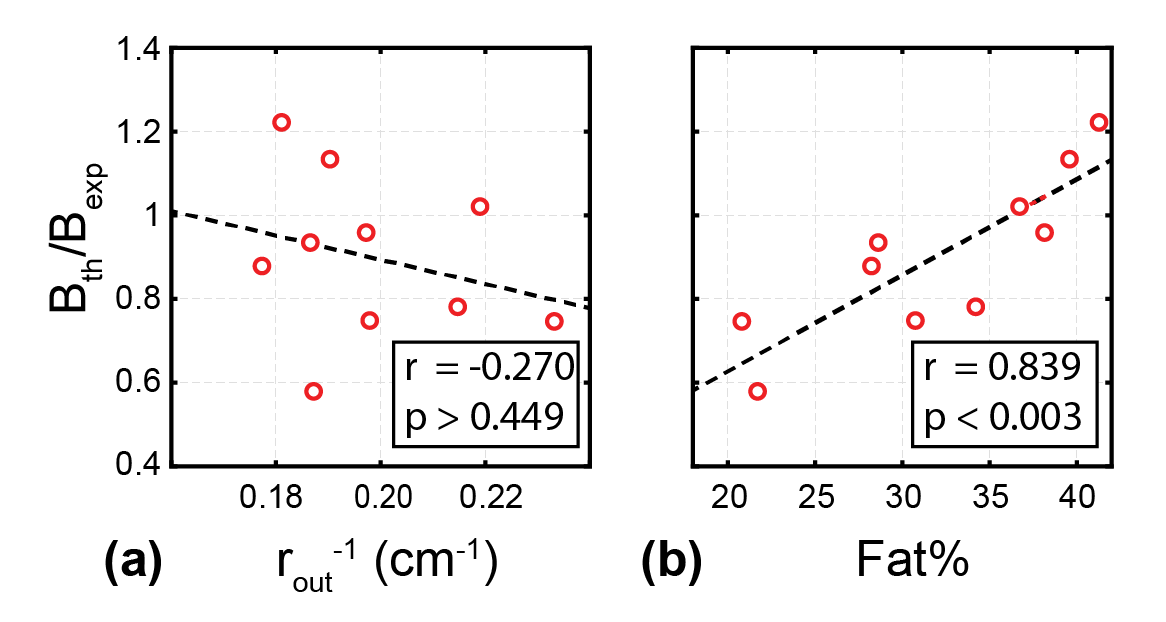
Figure 3: Ratio of the measured PNS threshold to expected threshold computed using Eq. 1, effectively factoring out the expected effects of the outer radius. The ratios for all 10 subjects are plotted as functions of simple anatomical measures extracted from the MRI images. The black dashed lines show the linear fits to data points. (a) No significant correlation was found between the inverse of the outer radius and Bth/Bexp (r=-0.270, p>0.449). (b) There was a very strong correlation between Fat% and Bth/Bexp (r=0.839, p<0.003).