1125
Simulation of electromagnetic cardiac stimulation: Validation in dogs and application to human threshold limits for MRI gradient coils1Computer Assisted Clinical Medicine, Medical Faculty Mannheim, Heidelberg University, Mannheim, Germany, 2A. A. Martinos Center for Biomedical Imaging, Department of Radiologoy, Massachusetts General Hospital, Charlestown, MA, United States, 3Harvard Medical School, Boston, MA, United States, 4Harvard-MIT Division of Health Sciences and Technology, Cambridge, MA, United States
Synopsis
Lack of detailed data requires a conservative approach in the IEC 60601-2-33 safety limits to prevent cardiac stimulation (CS) by MRI gradient switching. Analogous to our previous peripheral nerve stimulation modeling, we use coupled electromagnetic and electrophysiological simulations to investigate magnetically induced CS in human and canine body models. Our CS simulation pipeline reproduces CS thresholds measured in previous dog experiments. The predicted human CS thresholds are significantly higher than the regulatory safety limits. With further validation, CS simulations could eventually play an important role in determining appropriate MRI safety limits.
Purpose
Safety regulations such as the IEC 60601-2-33 limit the speed at which MRI gradient fields can be safely switched (dB/dt) to avoid inducing peripheral nerve stimulation (PNS) and cardiac stimulation (CS)1. The paucity of human CS threshold data and the difficulty of translating knowledge from other species to humans have required a conservative approach in the definition of CS limits by regulatory bodies. The animal studies underlying these limits show a large variance in experimental CS thresholds2,3, and the relationship between CS thresholds and dB/dt was derived using a homogeneous ellipsoidal human body model2. In reality, the body is highly heterogeneous, and simplified body models may bias the E-field to dB/dt scaling factors. Finally, the limits were only derived for whole-body gradients and do not specify guidelines for special-purpose systems (e.g., head gradients). Unlike PNS, CS thresholds cannot be measured safely in human volunteer studies, rendering validation and investigation of the CS mechanisms extremely difficult. To address these issues, we have extended our previous PNS simulations4,5 towards prediction of MRI gradient-induced CS6. In this work, we compare the CS thresholds determined from combined electromagnetic-electrophysiological simulations of a canine to experimental data acquired in the 1990s7,8 as a preliminary validation. Additionally, we perform similar simulations in a human male and female body model to provide a further bridge between the canine experiments and the human case.Methods
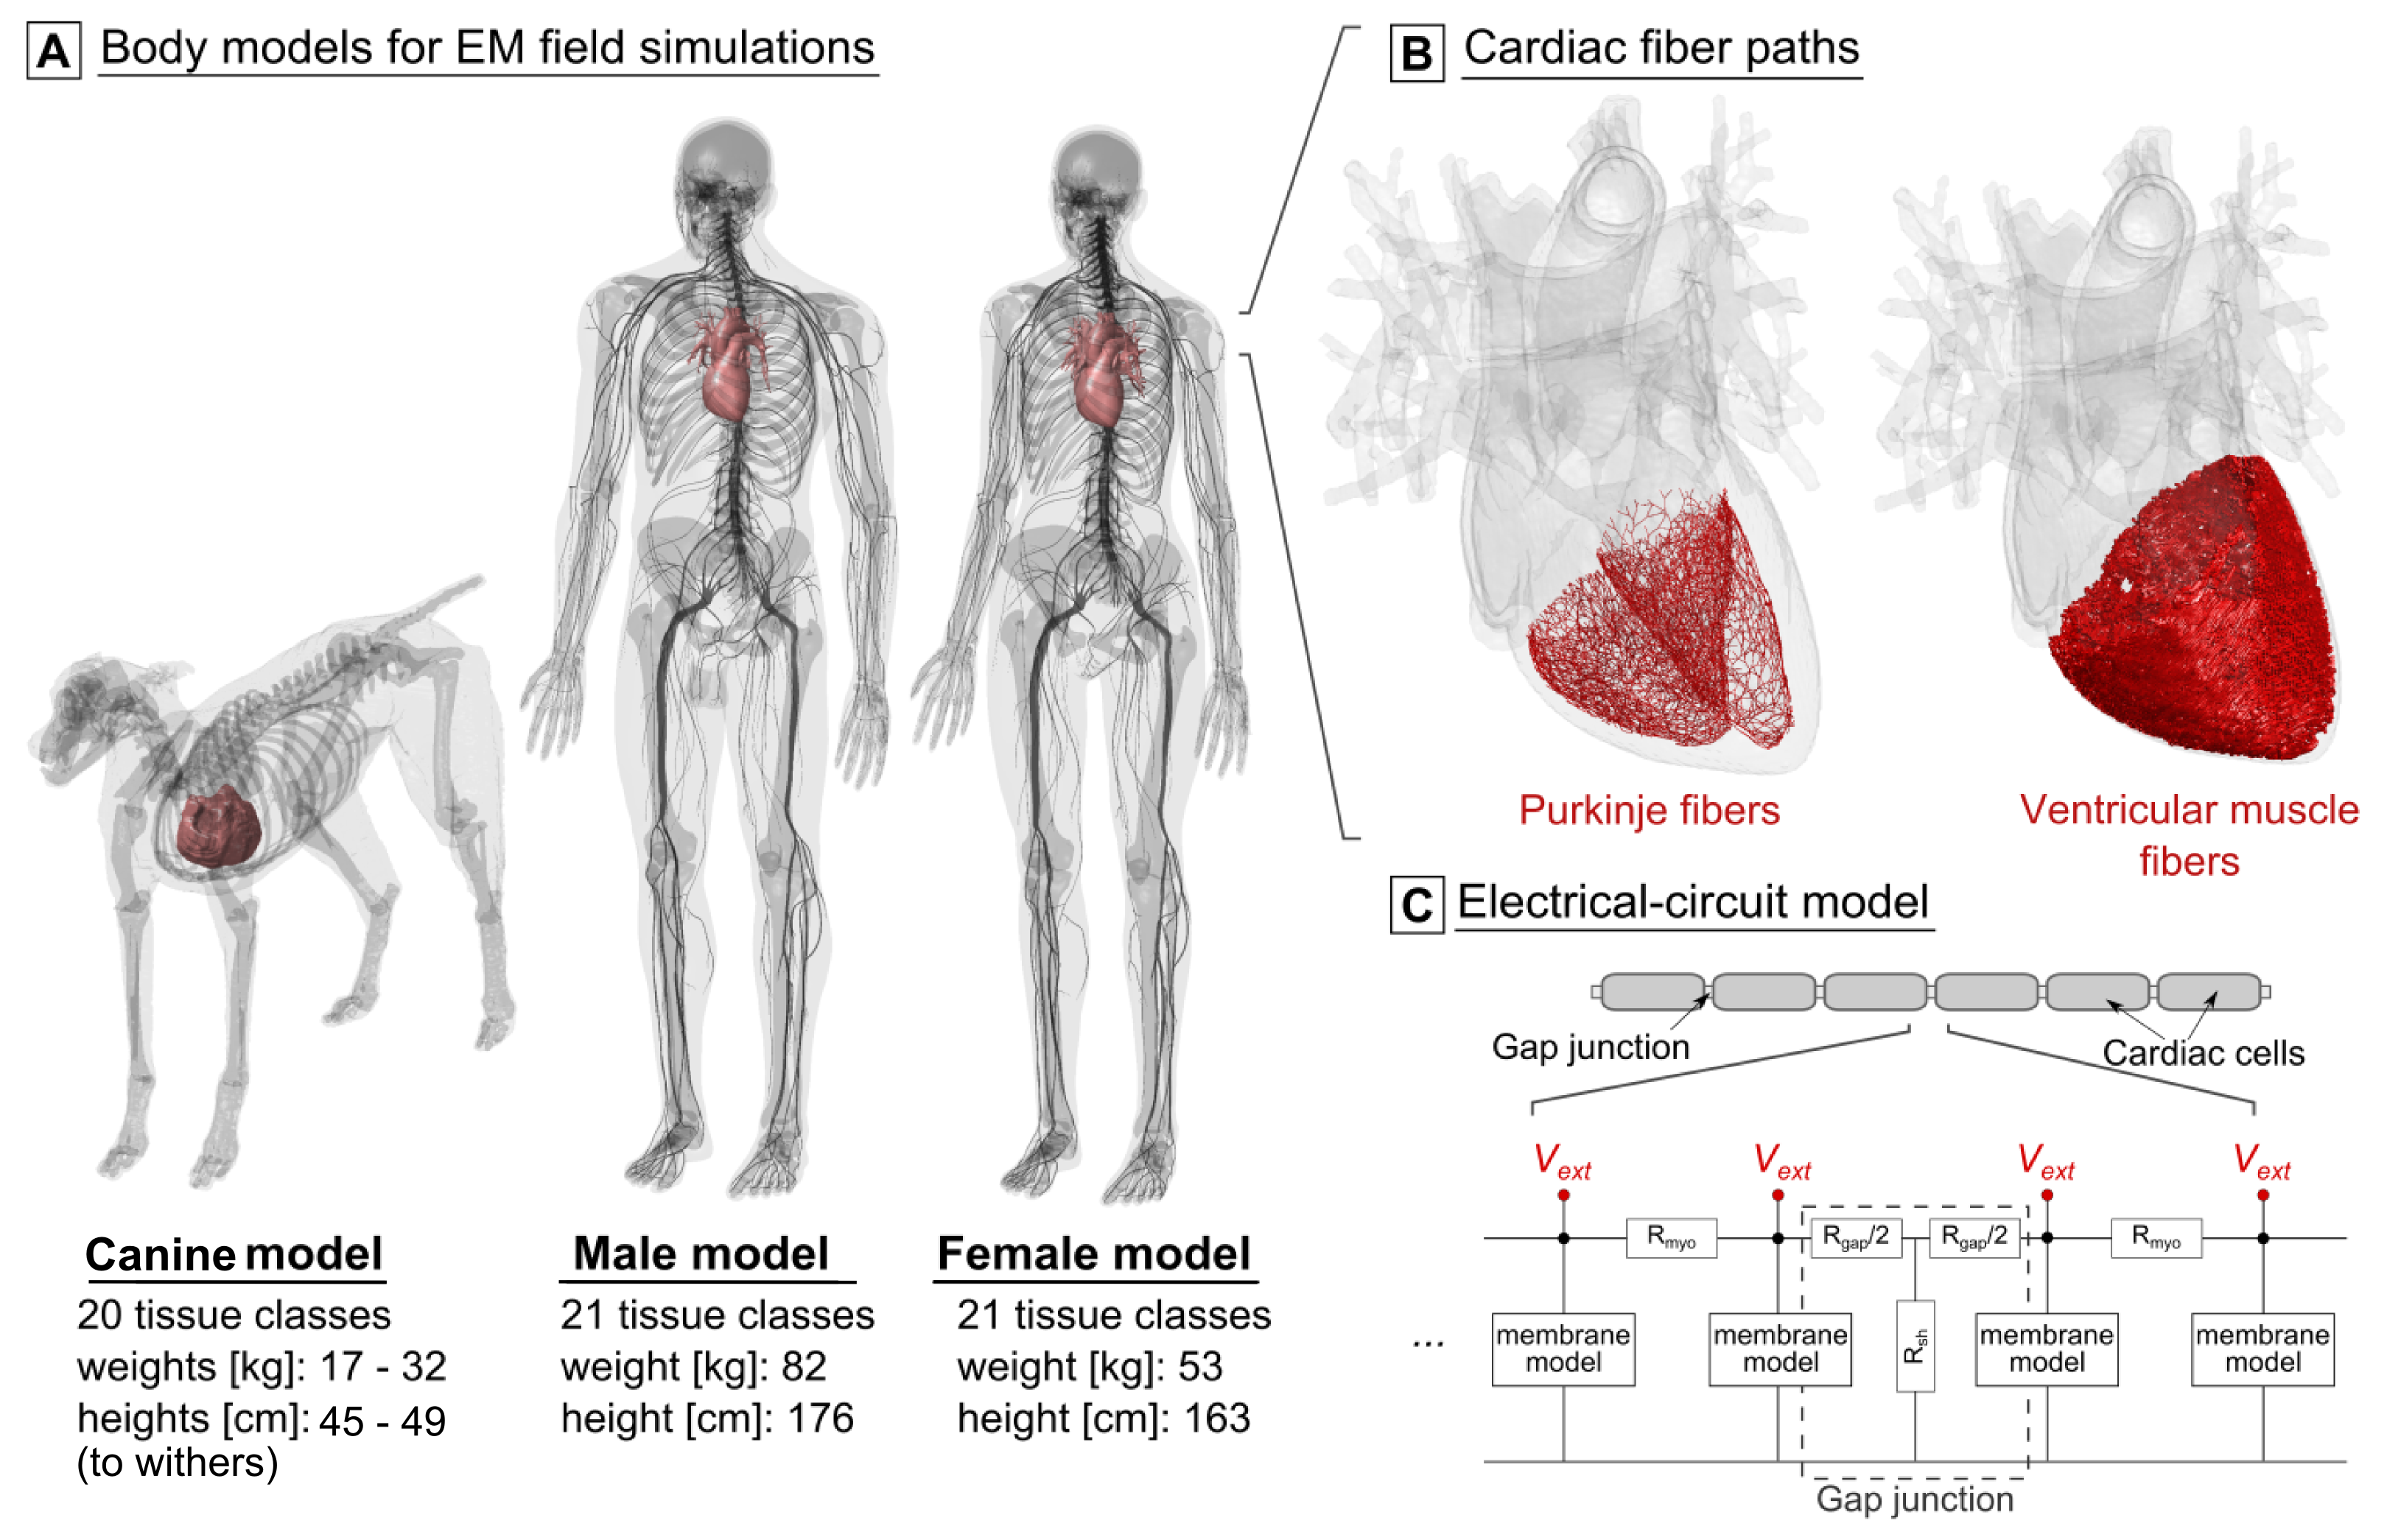
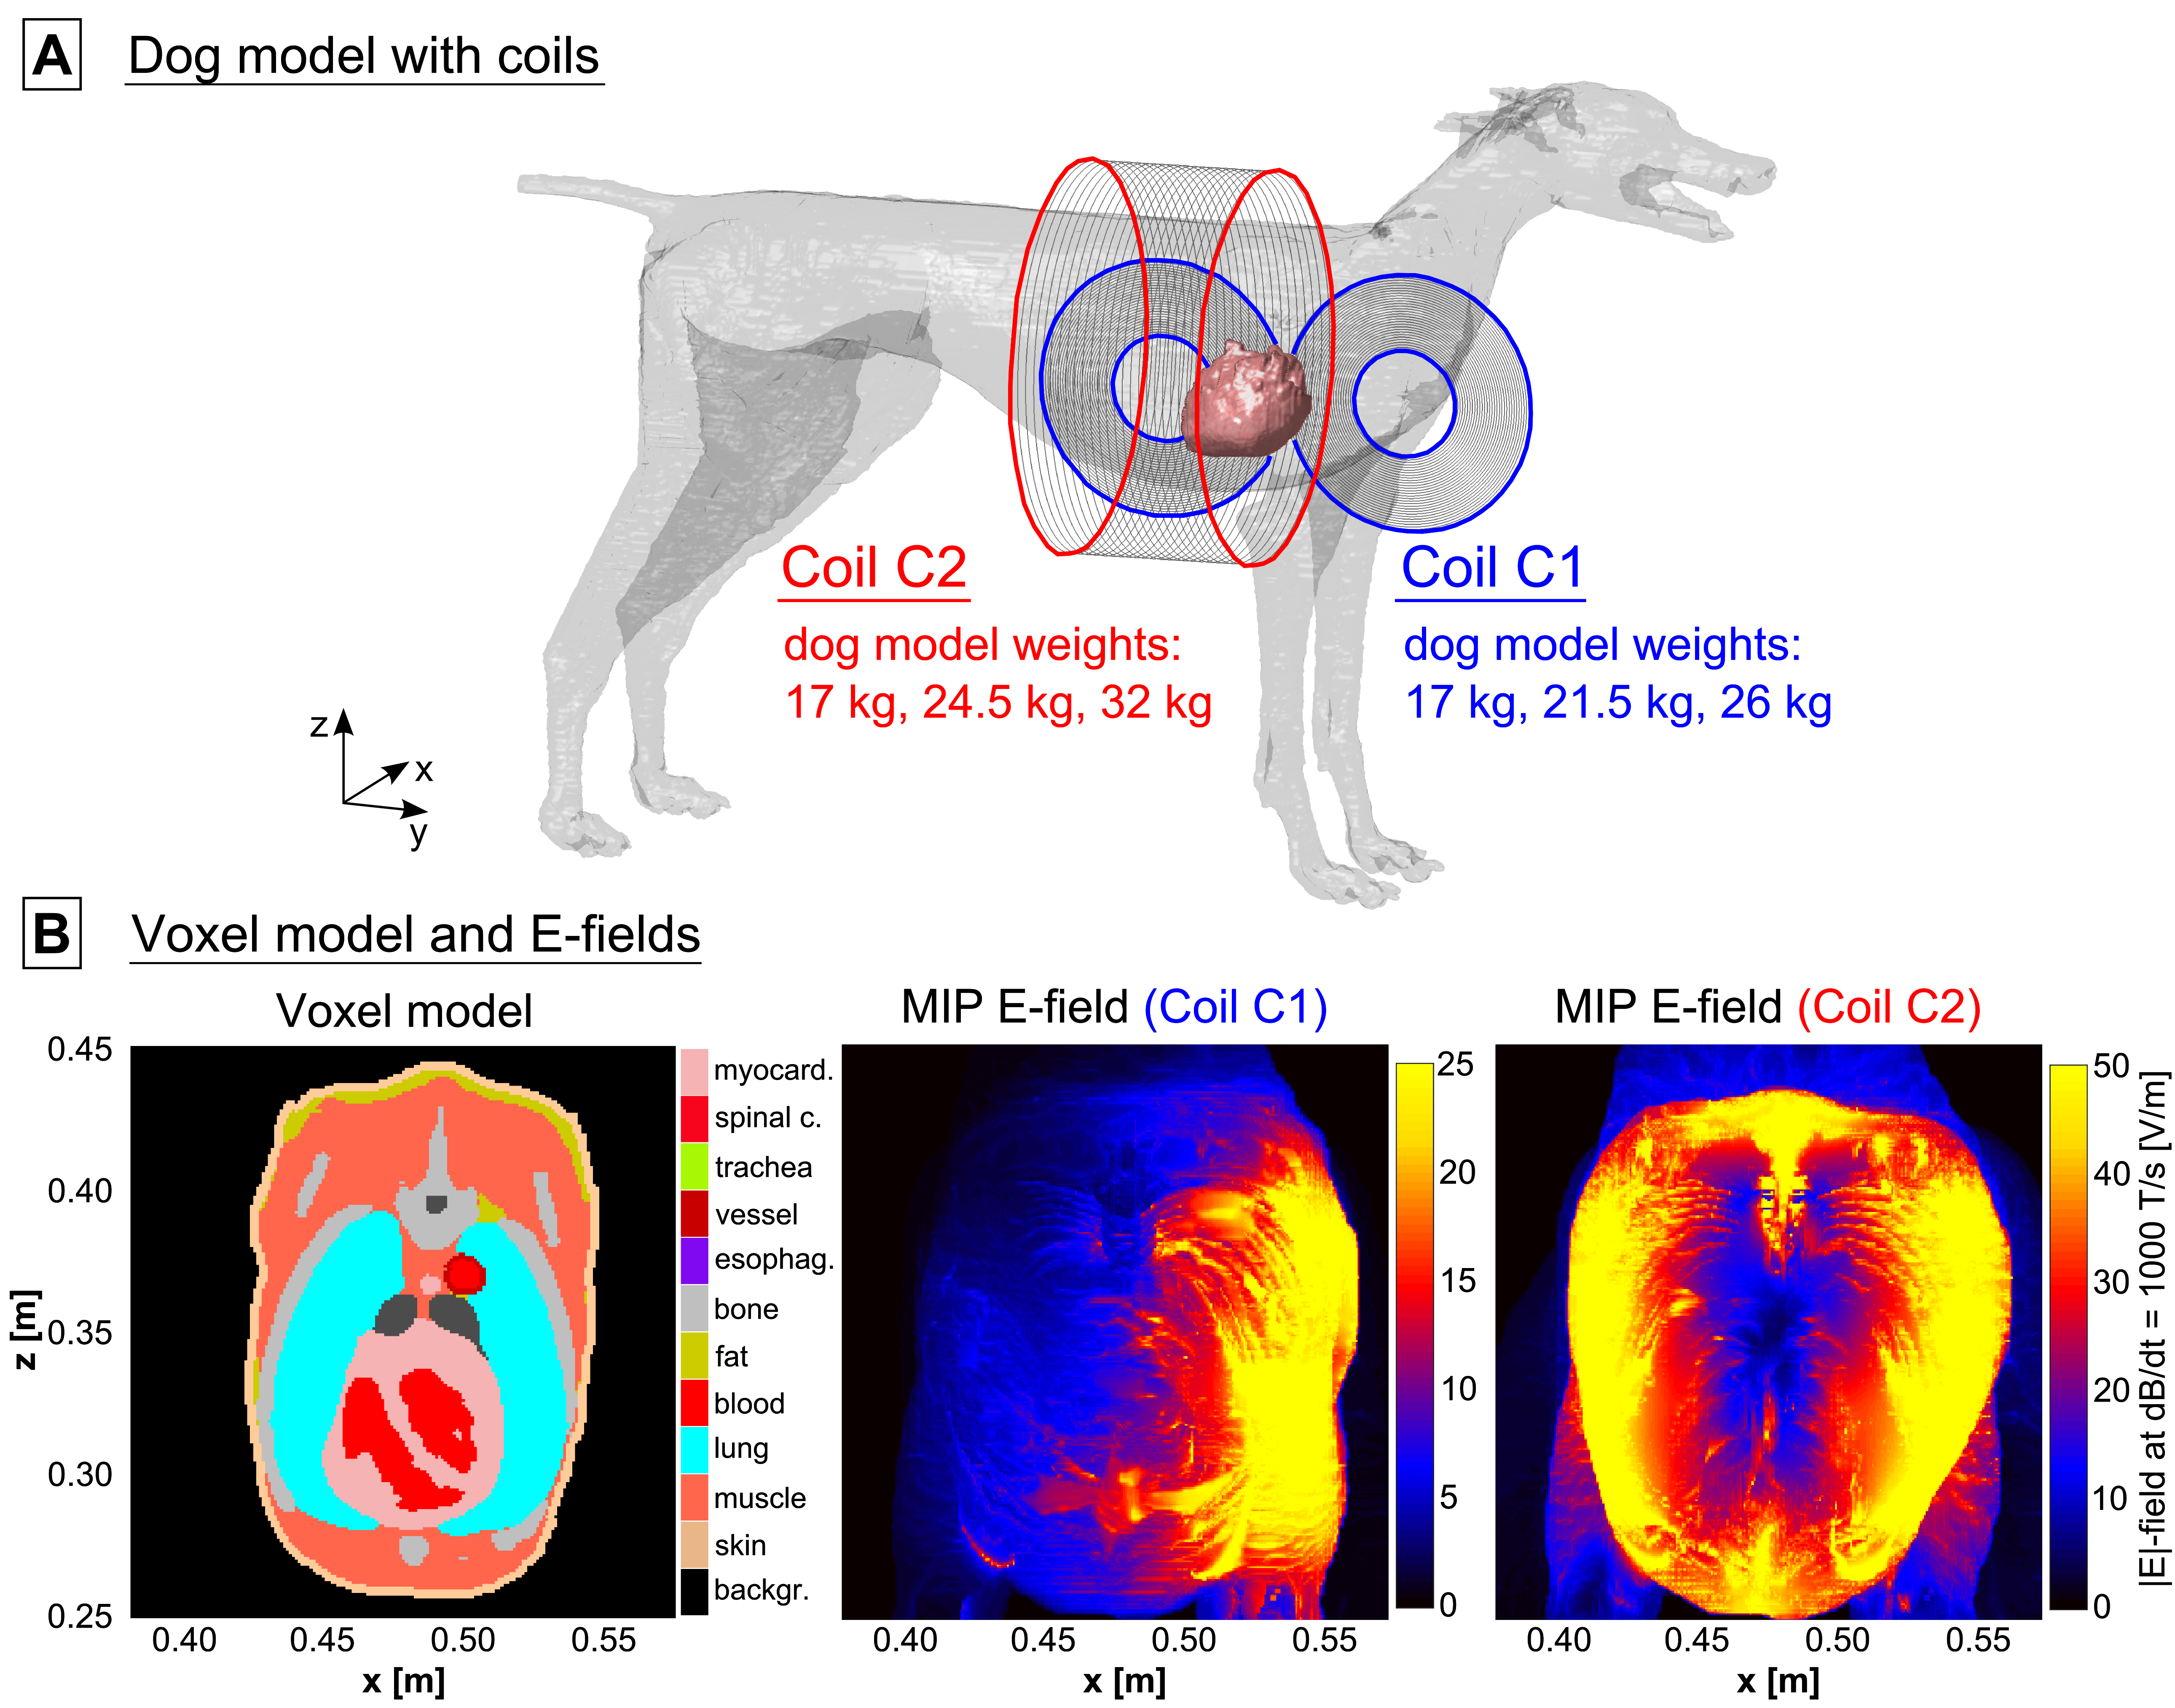
Modeling framework: We used detailed adult human male and female body models (derived from the Zygote body models, American Fork, UT, USA) as well as a canine model9 for the electromagnetic field simulations (Fig. 1A). The original canine model was scaled to match the minimum, mean and maximum weights of the dogs in the experiments (17-26 kg7, and 17-32 kg8). We added realistic networks of cardiac Purkinje and ventricular muscle fibers to the hearts of all body models using rule-based modeling algorithms that replicate the average mammalian anatomy10,11 (Fig. 1B). After simulation of the E-fields induced in the body models using a low-frequency FEM solver (Sim4Life, Zurich MedTech, Switzerland), we projected the E-field onto the cardiac fiber paths and integrated along them to obtain electric potential changes. We modulated the potentials in time with the coil current waveform and fed the resulting spatiotemporal potential variations into electrical-circuit models of Purkinje and ventricular muscle fibers12,13,14. These models can predict whether the induced potentials generate cardiac action potentials (indicating CS).Dog simulations: We replicated the coils and their position relative to the dogs from the experimental studies (Fig. 2A): 1) A pair of coplanar coils (C1) placed on the left side of the canine torso7, and 2), a solenoid coil8 (C2). The CS thresholds were calculated in terms of current amplitude for damped sinusoidal pulses (duration from onset of the dB/dt waveform to first zero-crossing: 571 µs7, and 540 µs8).
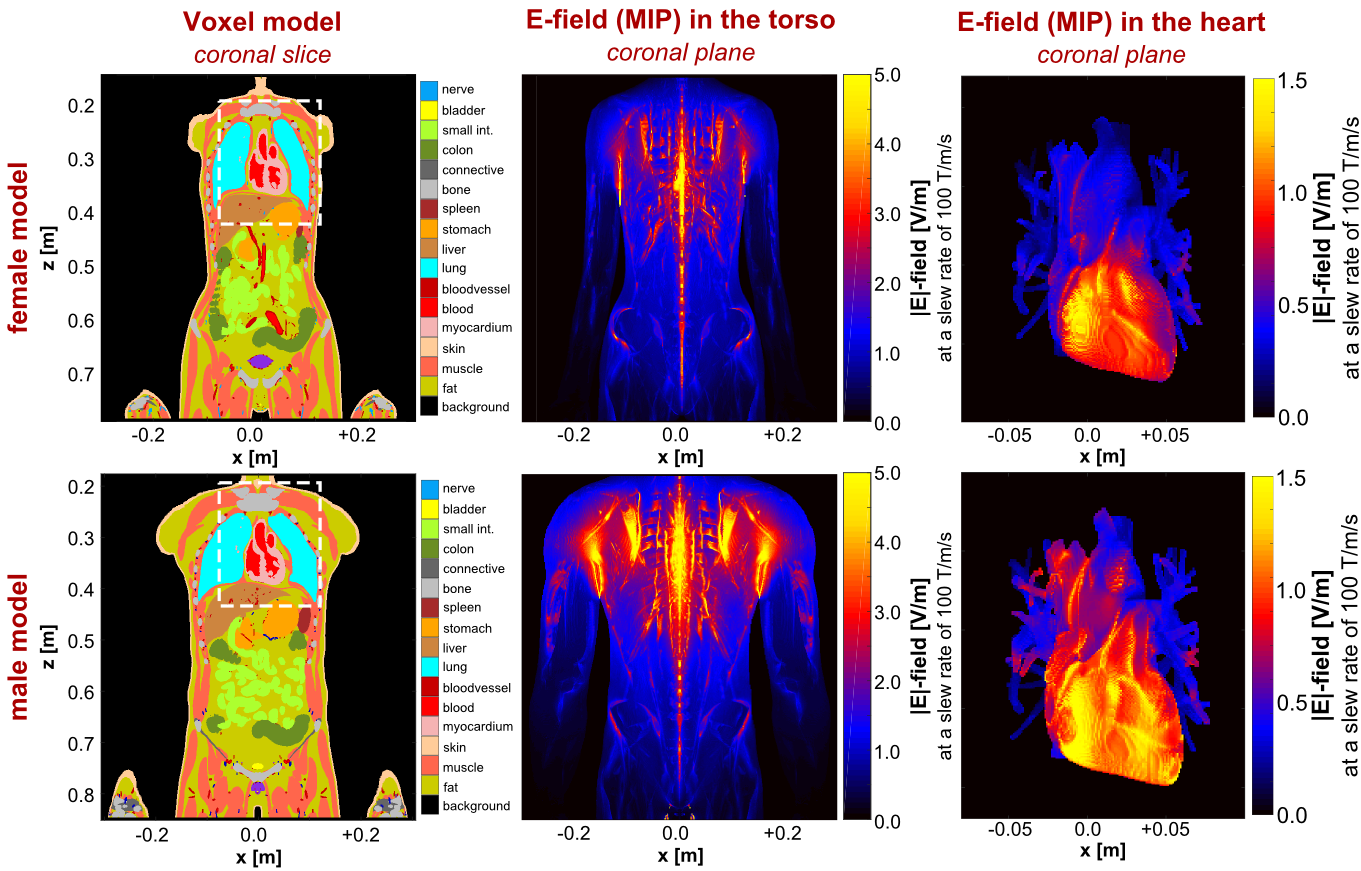
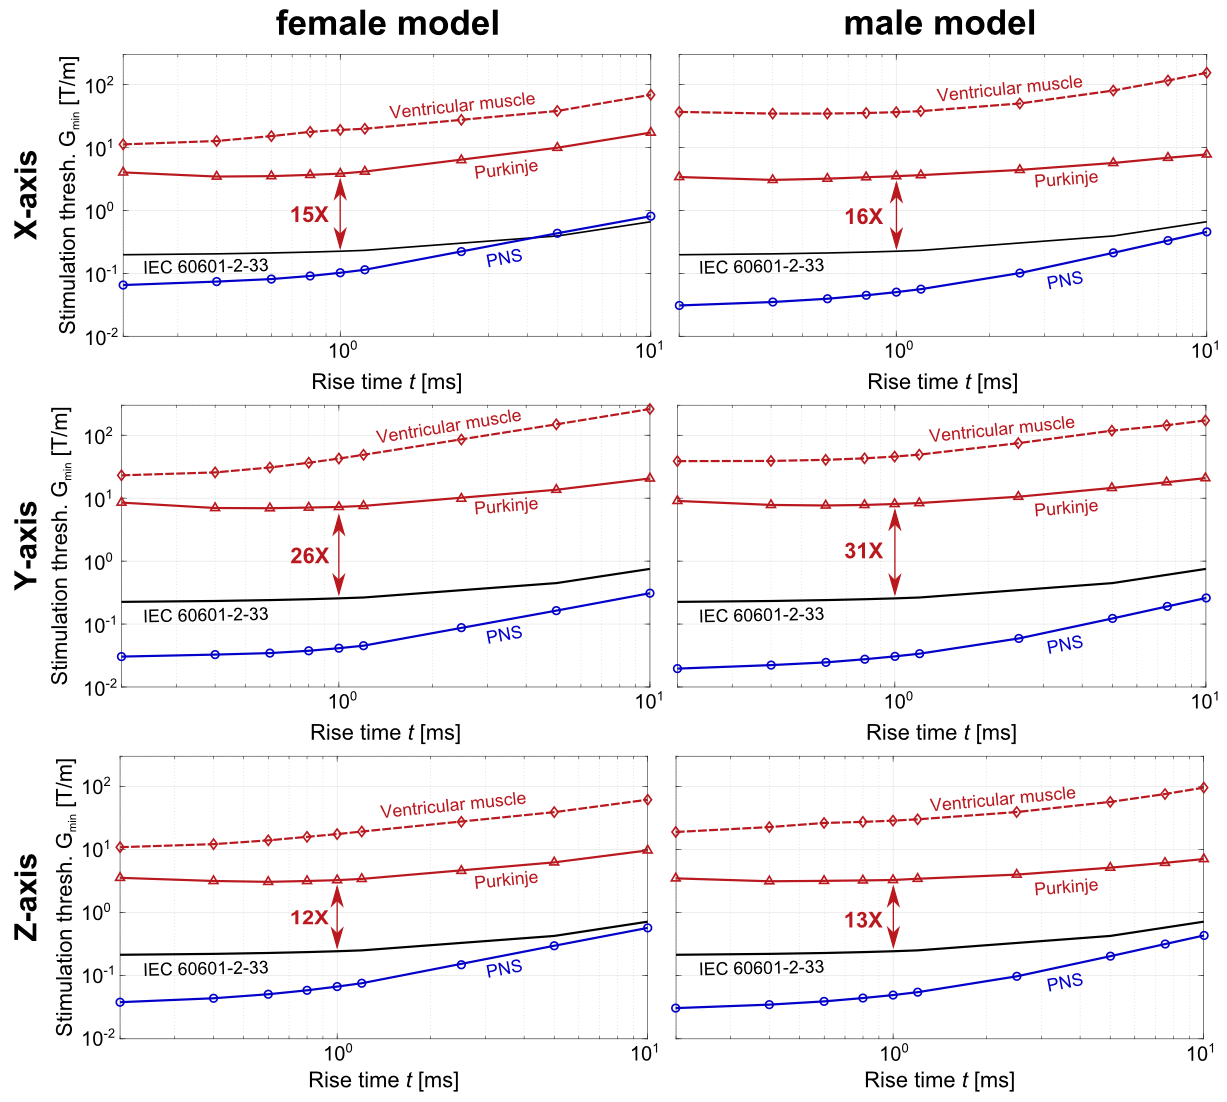
Human simulations: We placed the human body models in a whole-body actively-shielded MRI gradient (Siemens “Sonata”, Erlangen, Germany) with the head at isocenter. We simulated the CS thresholds for sinusoidal waveforms (10 bipolar pulses) with rise times between 0.2 ms and 10.0 ms. The CS thresholds are compared to PNS thresholds simulated using the previously published and validated PNS model4,5.
Results
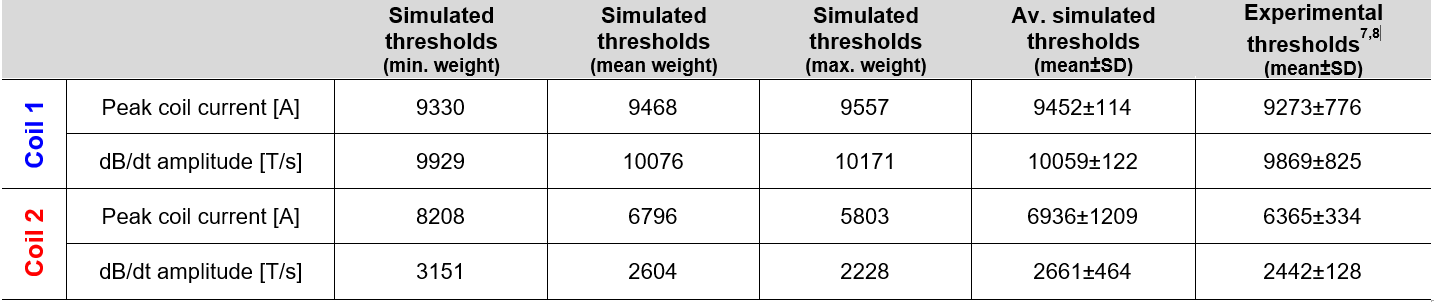
Figure 2B shows maximum intensity projections (MIPs) of the E-field induced in the torso of the 17 kg canine model by coils C1 and C2 at a peak dB/dt amplitude of 1000 T/s. Table 1 compares simulated and experimental CS thresholds for all dog weights. All thresholds are converted to an equivalent rectangular current waveform7,8. In our simulations, the Purkinje fibers set the CS threshold, as they are ~6-fold more sensitive to stimulation than the ventricular muscle fibers.Figure 3 shows MIPs of the E-field induced in the human models by the gradient’s Z-axis at a slew rate of 100 T/m/s. Figure 4 shows the simulated CS and PNS thresholds for both models and all gradient axes as well as the IEC cardiac limits. The predicted CS thresholds are one to two orders of magnitude higher than the PNS thresholds and at least 8-fold higher than the IEC limits.
Discussion
This initial validation study shows good agreement between the average simulated and experimental CS thresholds in dogs. However, there are unavoidable differences between simulations and experiments (e.g., canine anatomy, coil position, tissue properties) that may affect threshold values. Moreover, the experiments only used a single current waveform and duration. Therefore, we plan to conduct more rigorous validation studies in pigs. Better control of the experimental protocol (animal position, use of multiple waveforms & rise times, etc.) will enable us to more carefully assess the accuracy of our simulations.Our initial results of MRI gradient-induced CS in humans indicate that the IEC safety limits may be conservative, even though this claim requires further investigation. We plan to expand our human simulations towards other coil designs, including head gradients. We also plan to investigate the inter-/intra-subject variability of CS thresholds in more detail by reviewing thresholds measured in cardiac pacemaker patients15. Eventually, realistic simulations of CS could potentially play a central role in determining appropriate safety limits for MRI gradients, ensuring patient safety without unnecessary restriction of gradient performance.
Acknowledgements
No acknowledgement found.References
[1] International Electrochemical Commission (IEC), “International standard IEC 60601-2-33 medical electrical equipment. Particular requirements for the safety of magnetic resonance equipment for medical diagnosis”. Technical Report 2010.
[2] Reilly JP. Magnetic field excitation of peripheral nerves and the heart: A comparison of thresholds. Med & Biol Eng & Comput. 1991;29:571-579.
[3] Irnich W. Electrostimulation by time-varying magnetic fields. MAGMA. 1994;2:43-49.
[4] Davids M, Guérin B, vom Endt A, Schad LR, Wald LL. Prediction of peripheral nerve stimulation thresholds of MRI gradient coils using coupled electromagnetic and neurodynamic simulations. Magn Reson Med. 2019;81:686-701.
[5] Davids M, Guérin B, Malzacher M, Schad LR, Wald LL. Predicting magnetostimulation thresholds in the peripheral nervous system using realistic body models. Sci Rep. 2017;7:5316.
[6] Klein V, Davids M, Schad LR, Wald LL, Guérin B. Simulation of MRI gradient-induced cardiac stimulation: Are the current safety regulations too conservative? In: Proc Internat Soc Magn Reson Med. 2019; 729.
[7] Mouchawar GA, Bourland JD, Nyenhuis JA, Geddes LA, Foster KS, Jones JT, Graber GP. Closed-chest cardiac stimulation with a pulsed magnetic field. Med & Biol Eng & Comput. 1992;30:162-168.
[8] Nyenhuis JA, Bourland JD, Schaefer DJ, Foster KS, Schoelein WE, Mouchawar GA, Elabbady TZ, Geddes LA, Riehl ME. Measurement of cardiac stimulation thresholds for pulsed z-gradient fields in a 1.5-T magnet. In: Proc Soc Magn Reson Med. 1992;586.
[9] Kramer GH, Capello K, Strocchi S, Bearrs B, Leung K, Martinez N. The HML’s new voxel phantoms: Two human males, one human female, and two male canines. Health Phys Soc. 2012;103(6):802-807.
[10] Ijiri T, Ashihara T, Yamaguchi T, Takayama K, Igarashi T, Shimada T, Namba T, Haraguchi R, Nakazawa K. A procedural method for modeling the Purkinje fibers of the heart. J Physiol Sci. 2008;58(7):481-486.
[11] Bayer JD, Blake RC, Plank G, Trayanova NA. A novel rule-based algorithm for assigning myocardial fiber orientation to computational heart models. Ann Biomed Eng. 2012;40(10):2243-2254.
[12] Stewart P, Aslanidi OV, Noble D, Noble PJ, Boyett MR, Zhang H. Mathematical models of the electrical action potential of Purkinje fibre cells. Phil Trans R Soc A. 2009;367:2225-2255.
[13] O’Hara T, Virág L, Varró A, Rudy Y. Simulation of the undiseased human cardiac ventricular action potential: Model formulation and experimental validation. PLoS Comput Biol. 2011;7(5):e1002061 (DOI:10.1371/journal.pcbi.1002061).
[14] Rudy Y, Quan W. Propagation delays across cardiac gap junctions and their reflection in extracellular potentials: A simulation study. J Cardiovasc Electrophysiol. 1991;2(4):299-315.
[15] Rizo-Rivera GO, Carmona LC, Chávez E., Pérez D, Ramírez JI, Cruz JM, Padrón G, Cairo G, Acosta F, Novo L. Ventricular pacing threshold variations in patients with cardiac pacemakers. Rev. Fed. Arg. Cardiol. 2012;41(1).
Figures