1121
Parallel transmit local SAR vs. mesh resolution in EMF simulations of highly detailed anatomical models – a rigorous analysis1MRI.TOOLS GmbH, Berlin, Germany, 2Max Delbrück Center for Molecular Medicine in the Helmholtz Association, Berlin, Germany, 3Clinic for Radiation Oncology, Charité Universitätsmedizin, Berlin, Germany, Berlin, Germany, 4Experimental and Clinical Research Center (ECRC), joint cooperation between the Charité Medical Faculty and the Max Delbrück Center for Molecular Medicine in the Helmholtz Association, Berlin, Germany
Synopsis
Electromagnetic simulations are an important tool for RF coil and thermal RF applicator development. For rapid design evaluation, fast low mesh resolution simulations would be of benefit, which can however potentially introduce errors in regions of intricate tissue distributions. We rigorously analyze local power deposition errors introduced by using low-resolution meshes in simulations of a highly detailed head model at 297 MHz. Our results indicate, that even at 5mm the introduced error is acceptable. However, artificial current paths are formed in the oronasal cavity, leading to not critical albeit locally elevated power deposition, thus deserving additional attention.
Introduction
Electromagnetic simulations drive the design of novel multichannel transmit RF devices such as MRI coils and thermal MR applicators. Due to their capability to utilize arbitrarily complex human voxel models1,2, time domain methods are often preferred over frequency domain approaches. Computational constraints prohibit using the highest resolutions to perfectly resolve delicate anatomical features such as very thin CSF layers in the brain, potentially impacting local power distribution. Previous publications have examined this for the less complex single-channel case3–6. Here, we rigorously investigate the impact of the mesh resolution on local power density in multi-channel time domain simulations.Methods
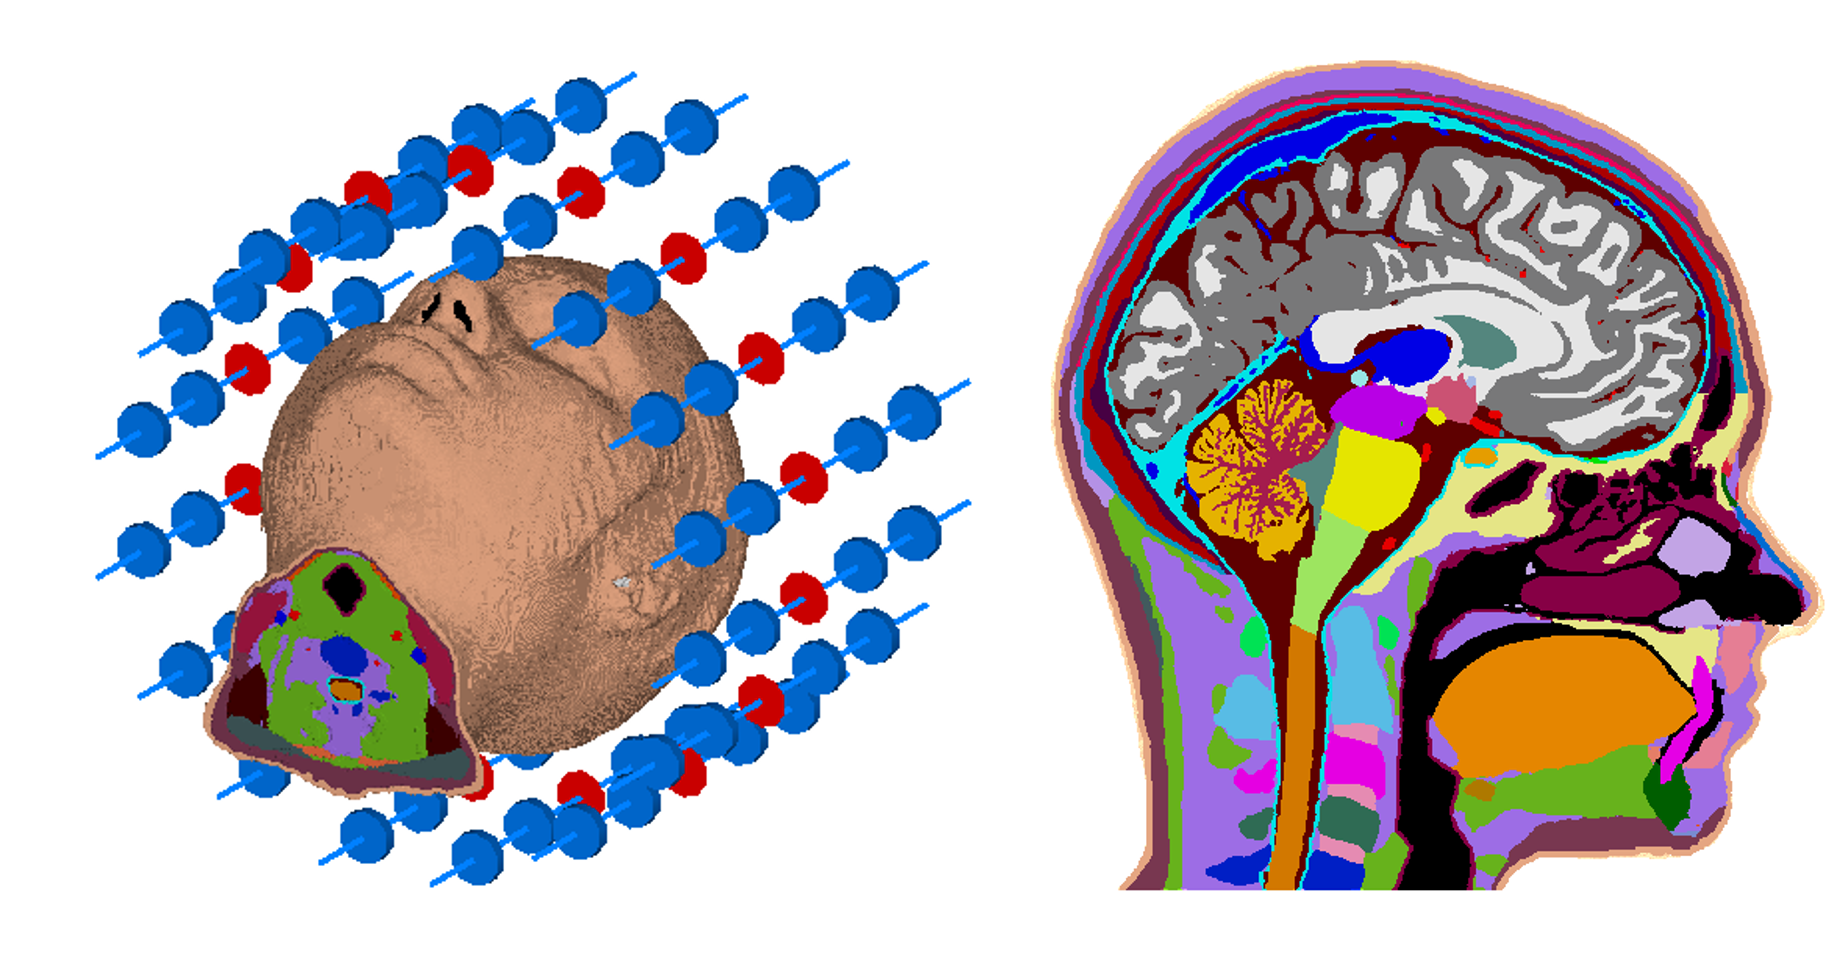
We simulated a synthetic 16-channel dipole head array at 297.2MHz loaded with the high-fidelity head model MIDA2,7 (Figure 1) at mesh resolutions ranging from 5mm to 0.5mm using the finite integration technique (FIT) solver of CST Microwave Studio 2019 (CST, Darmstadt, Germany). A 0.25mm resolution voxel model was created from the MIDA CAD model using MATLAB (The MathWorks, CA, USA). This small voxel size ensures that CST can properly utilize its material averaging methods, which derive composite materials for mesh edges spanning multiple different materials8,9. Additionally, a 5mm voxel model was created to demonstrate effects of insufficient input model resolution. After simulation in CST, the coil fields were exported to MATLAB to calculate perfectly decoupled single-channel fields and local power density matrices. To allow voxel-wise comparisons between mesh resolutions, the power density matrices were re-binned to a common 2-mm resolution using a locally and globally power conserving method10, mapping differently resolved simulations to a common grid with minimum loss of fidelity. The matrices were then spatially averaged over 10cm³-volume spheres11 (spatially averaged power, SAP10cm³), approximating 10g averaged SAR12. We intentionally did not use local SAR, as time domain methods determine the fields on the edges of mesh cells, whereas the density is a volume property, and the ambiguous mapping between these domains presents a confounding factor13. A statistical analysis was performed using 100,000 random excitations to analyze the deviations of the lower resolution simulations to the 0.5mm simulation. Sensitive tissues (brain, spine, eyes) were analyzed separately. Additionally, a focused RF heating result is examined at all resolutions14.Results
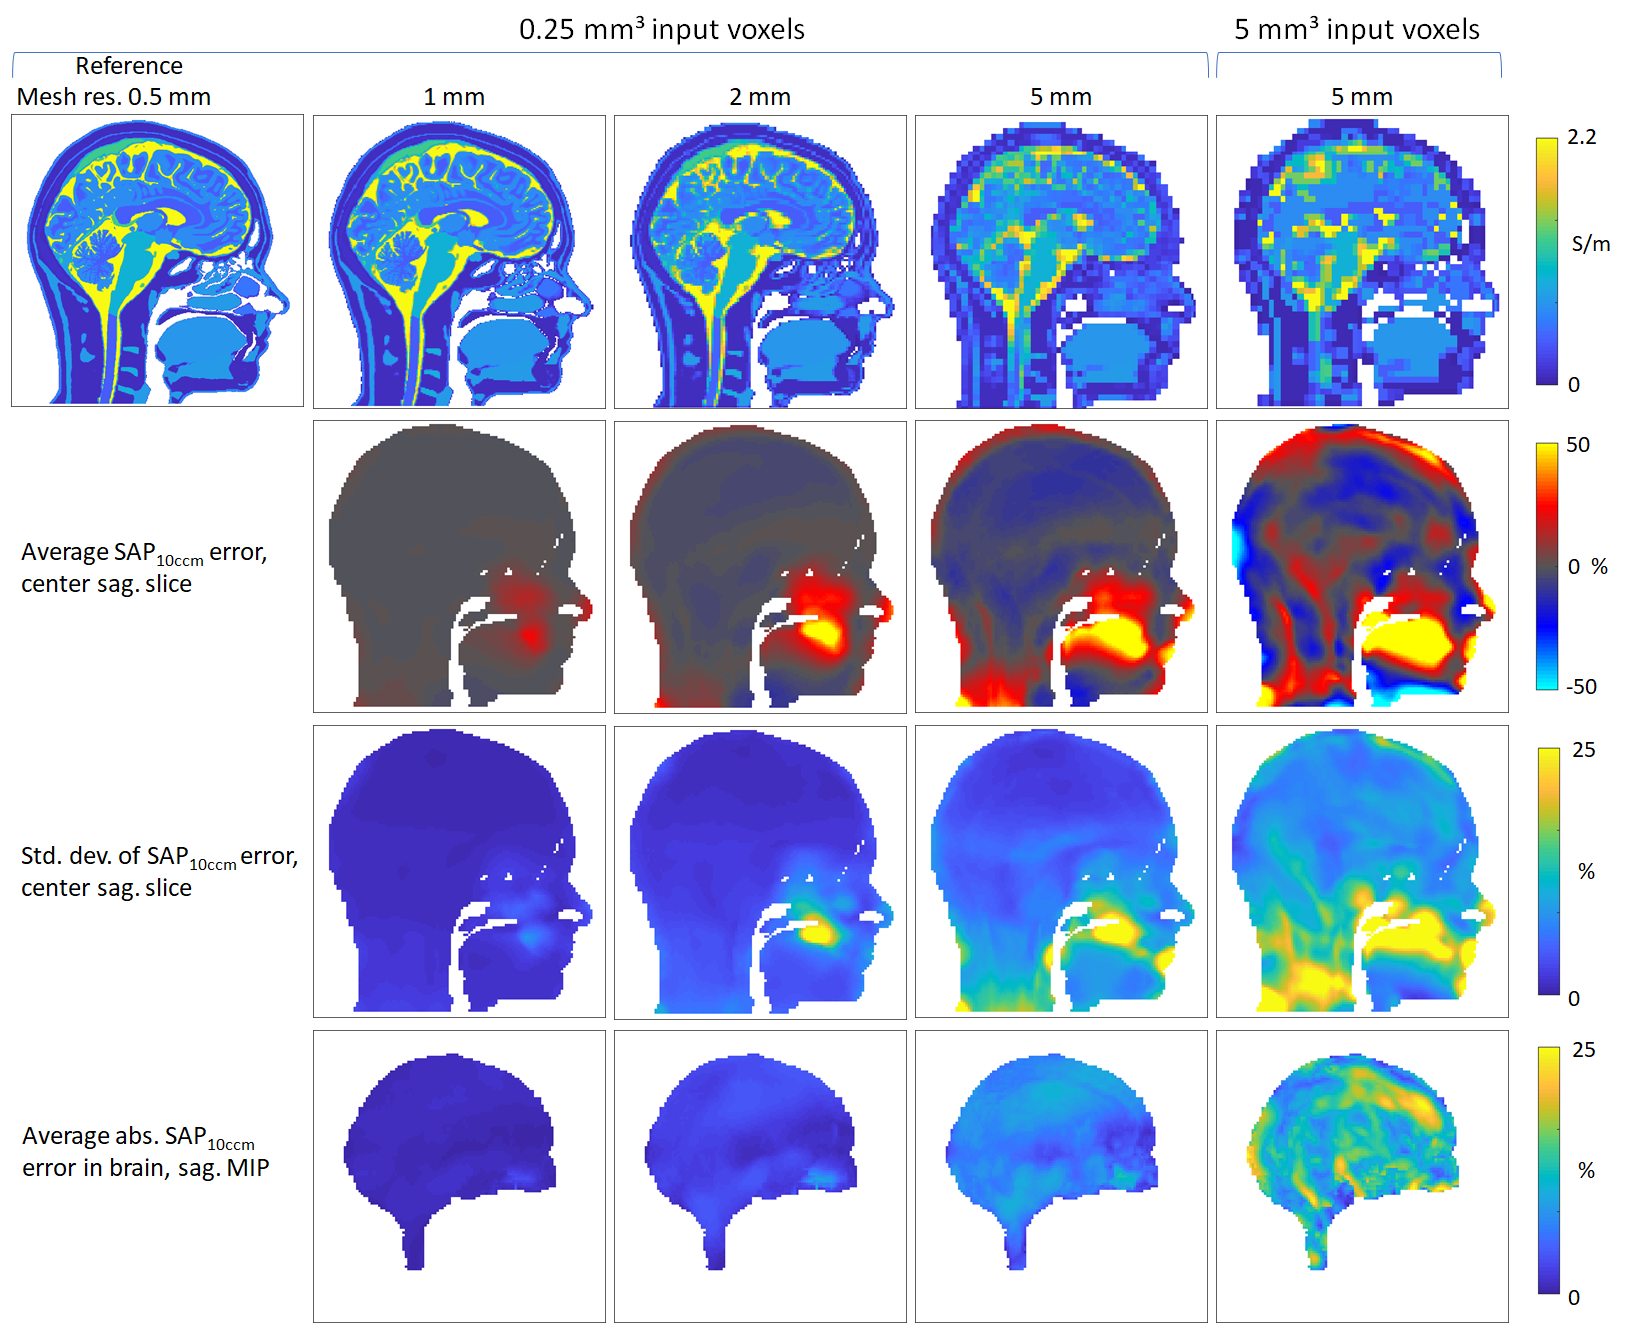
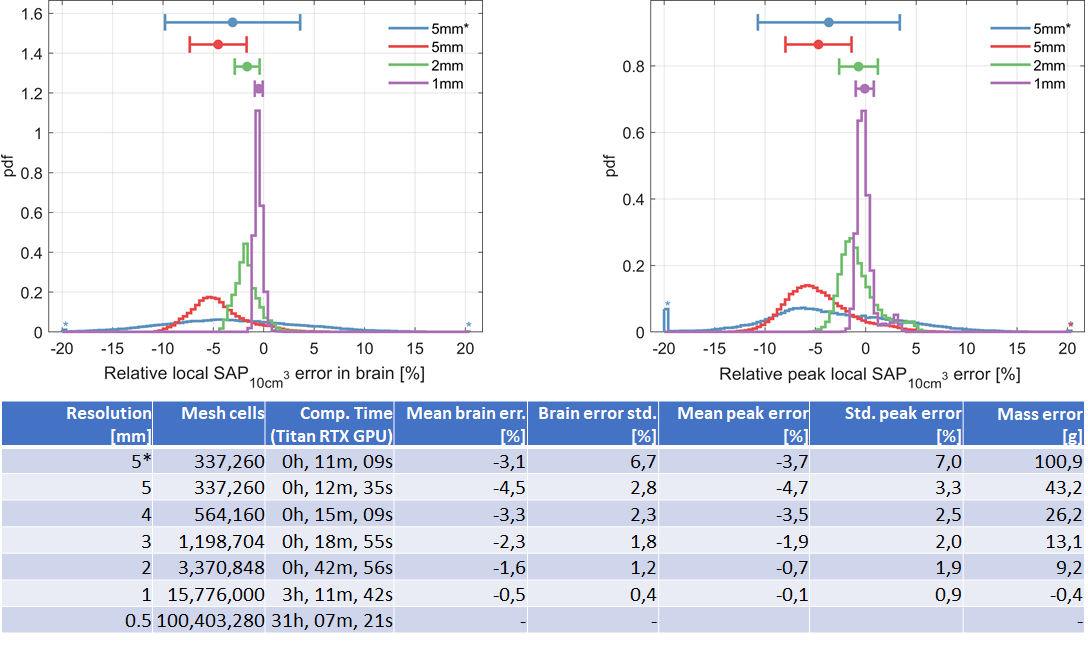
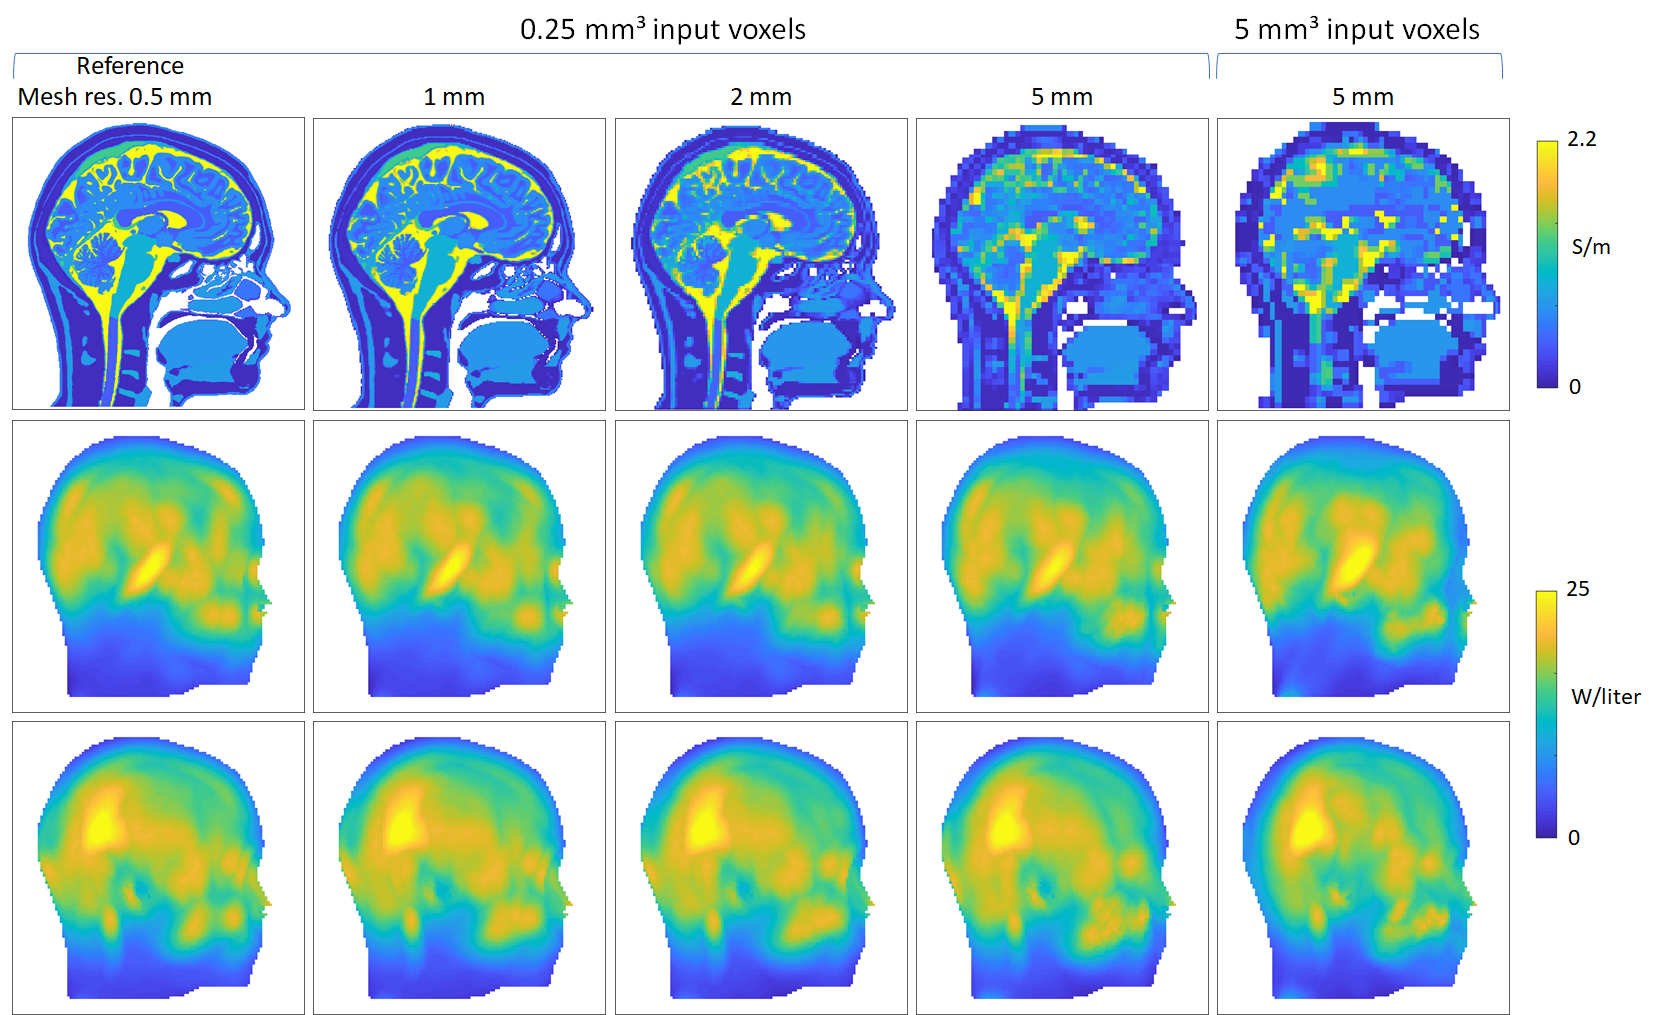
Figure 2 gives an overview over the randomized excitation results for selected mesh resolutions. The error decreases with increasing resolution, with lower resolutions slightly underestimating SAP10cm³. The result using the 5mm input model shows notably higher errors. The statistics shown in Figure 3 corroborate these results, where the error standard deviation for the 5mm input result is more than twice that of the 0.25mm voxel input simulation. A strong local SAP10cm³ elevation of more than 50% is seen in all resolutions lower than 1mm in the tongue region. This local elevation in low resolutions also explains the underestimation in the brain via conservation of energy – the coil is slightly more loaded at low resolutions. Results from two RF heating simulations are shown in Figure 4. Qualitatively, the distributions are highly similar, with the 5mm input voxel simulation again displaying the largest qualitative differences. Quantitatively, this scenario displayed the strongest deviation, with a SAP10cm³ error of ≈4%, while all other results deviate by less than 2%.Discussion and conclusions
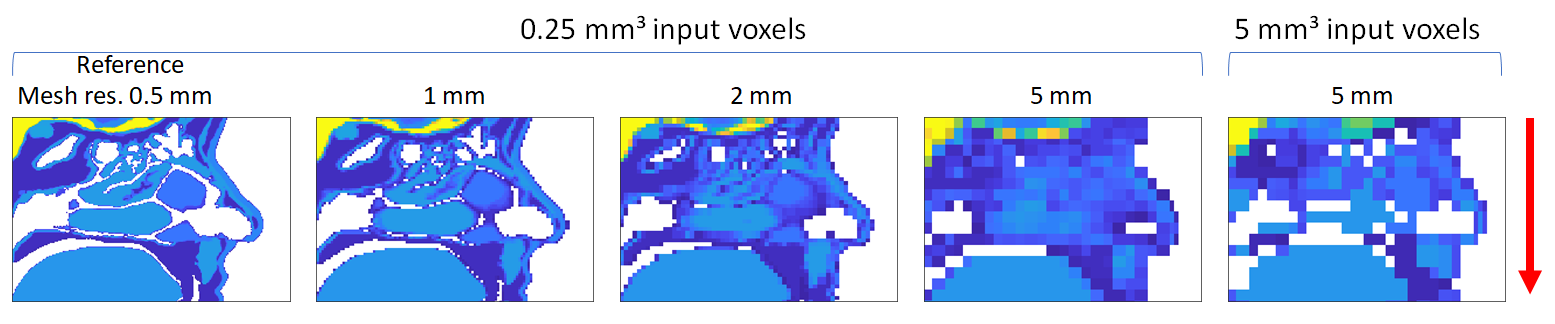
Our results indicate that low mesh resolution simulations down to 5mm are suitable to accurately estimate local RF power deposition in the head at 297MHz, with an error of -4.5%±2.8% in the brain over 100,000 random excitations. This contradicts previous findings showing a significant resolution dependence at 300MHz5,15. The discrepancy can most likely be explained by the absence of any averaging scheme, which can lead to strongly varying local power deposition as the high- and low-resolution models are locally dissimilar. Relying on SAR with its spatial mapping complications13 likely introduced further variation. In our work, the mesh averaging algorithms employed by CST accurately captured the sub-mesh-cell variation leading to a significantly more accurate model. It was also shown that supplying a low-resolution base model leads to a substantial difference in results. From experience, CST always uses averaging8,9, and XFdtd (Remcom, State College, PA, USA) offers the option, though implementation details and accuracy likely differ between vendors16.While the local RF power density elevation found in the tongue for low mesh resolution simulations does not lead to a new hotspot, it deserves an extra explanation. The head model contains a very detailed representation of the oronasal cavities. For low mesh resolutions, the small air gaps present between the tongue and the roof of the mouth as well as in the nasal cavities are bridged by sampling artifacts (Figure 5), providing a current path leading to increased RF power deposition. While not critical in this instance, it nevertheless raises the question on how internal air is to be treated in simulations, given that such clearly defined air gaps might not be present in real patients with conductive saliva and nasal mucus present.
To conclude, low spatial resolution time domain EM simulations can provide accurate local RF power deposition results at 297MHz. However, low mesh resolutions can create new current paths in regions with small air gaps, which might become important for certain applications in MRI and targeted RF heating using Thermal MR.
Acknowledgements
This project was supported in part (AK, HW, TN) by MENTORA4EU (FKZ FKZ 01QE1815 / E! 12074 MENTORA_4_EU) and (MB, TN) by MgSafe (Horizon 2020 European Training Network, grant number 811226).References
1. Christ A, Kainz W, Hahn EG, et al. The Virtual Family--development of surface-based anatomical models of two adults and two children for dosimetric simulations. Phys. Med. Biol. 2010;55:N23-38 doi: 10.1088/0031-9155/55/2/N01.
2. Iacono MI, Neufeld E, Akinnagbe E, et al. MIDA: A multimodal imaging-based detailed anatomical model of the human head and neck. PLoS One 2015;10 doi: 10.1371/journal.pone.0124126.
3. Wolf S, Diehl D, Gebhardt M, Mallow J, Speck O. SAR simulations for high-field MRI: how much detail, effort, and accuracy is needed? Magn. Reson. Med. 2013;69:1157–68 doi: 10.1002/mrm.24329.
4. Collins CM, Smith MB. Spatial resolution of numerical models of man and calculated specific absorption rate using the FDTD method: a study at 64 MHz in a magnetic resonance imaging coil. J. Magn. Reson. Imaging 2003;18:383–8 doi: 10.1002/jmri.10359.
5. Wang Z, Collins C, Zhao S, Robb F. The Effect of Human Model Resolution on Numerical Calculation of SAR and Temperature in MRI. Proc. 17th Sci. Meet. Int. Soc. Magn. Reson. Med. 2009;Honolulu:4797.
6. Homann H, Börnert P, Eggers H, Nehrke K, Dössel O, Graesslin I. Toward individualized SAR models and in vivo validation. Magn. Reson. Med. 2011;66:1767–76 doi: 10.1002/mrm.22948.
7. Hasgall P, Neufeld E, Gosselin M, Klingenböck A, Kuster N. IT’IS Database for thermal and electromagnetic parameters of biological tissues, Version 4.0, www.itis.ethz.ch/database. www.itis.ethz.ch/database. www.itis.ethz.ch/database doi: 10.13099/VIP21000-04-0.
8. Weiland T. Time domain electromagnetic field computation with finite difference methods. Int. J. Numer. Model. Electron. Networks, Devices Fields 1996;9:295–319 doi: 10.1002/(SICI)1099-1204(199607)9:4<295::AID-JNM240>3.0.CO;2-8.
9. Clemens M, Weiland T. DISCRETE ELECTROMAGNETISM WITH THE FINITE INTEGRATION TECHNIQUE. Integr. Vlsi J. 2001:65–87.
10. Volken W, Frei D, Manser P, Mini R, Born EJ, Fix MK. An integral conservative gridding--algorithm using Hermitian curve interpolation. Phys. Med. Biol. 2008;53:6245–63 doi: 10.1088/0031-9155/53/21/023.
11. Kuehne A, Seifert F, Ittermann B. GPU-accelerated SAR computation with arbitrary averaging shapes. In: Proceedings of the ISMRM. Melbourne, Australia; 2012. p. 4260.
12. Kuehne A, Goluch S, Moser E, Laistler E. Comprehensive analysis of parallel transmission local SAR errors introduced by an assumed uniform density distribution. In: Proceedings of the ISMRM. Vol. 67. Milan, Italy; 2014. p. 1380.
13. Caputa K, Okoniewski M, Stuchly MA. An algorithm for computations of the power deposition in human tissue. IEEE Antennas Propag. Mag. 1999;41:102–107 doi: 10.1109/74.789742.
14. Oberacker E, Kuehne A, Waiczies H, et al. Radiofrequency applicator concepts for simultaneous MR imaging and hyperthermia treatment of glioblastoma multiforme: A 7.0 T (298 MHz) study. Proc. 25th ISMRM Annu. Meet. Exhib. Honolulu, Hawaii, USA 2017.
15. Collins CM, Wang Z. Calculation of radiofrequency electromagnetic fields and their effects in MRI of human subjects. Magn. Reson. Med. 2011;65:1470–82 doi: 10.1002/mrm.22845.
16. Whittow WG, Edwards RM. Effects of averaging procedures for electrical properties at the interface of dissimilar tissues in the human head with finite-difference time-domain modelling. IET Sci. Meas. Technol. 2009;3:51 doi: 10.1049/iet-smt:20070091.
17. Raaijmakers AJE, Italiaander M, Voogt IJ, et al. The fractionated dipole antenna: A new antenna for body imaging at 7 Tesla. Magn. Reson. Med. 2016;75:1366–1374 doi: 10.1002/mrm.25596.
Figures