1118
Metabolic basis of human brain network nodes in resting-states of eyes-closed and eyes-open1Yale University, New Haven, CT, United States
Synopsis
Resting-state fMRI studies are conducted with eyes-closed (EC) or eyes-open (EO) conditions. Given differences in spontaneous activity between EO and EC conditions, metabolic foundations of fMRI-derived networks, specifically activated (e.g., sensory network) and deactivated (e.g., default mode network, DMN) nodes, are poorly understood. We assessed aerobic glycolysis and excitatory-inhibitory balance in healthy volunteers’ visual cortex (VC, a non-DMN node) and posterior cingulate cortex (PCC, a DMN node) using J-edited fMRS and calibrated fMRI. Functional changes between EO and EC conditions are regionally non-specific to aerobic glycolysis and flow-metabolism coupling, but neurovascular coupling in VC depends on EO and EC conditions.
Abstract
Introduction: Spontaneous resting-state brain activity is different in most of the brain areas between eyes-open (EO) and eyes-closed (EC) conditions, which are idealized resting-states in functional MRI (fMRI) studies1. It has been shown that comparing EC to EO condition results in increase of glucose metabolism2. However metabolic foundations of fMRI-derived networks, specifically activated (e.g., sensory network) and deactivated (e.g., default mode network, DMN) nodes, remain poorly understood3. Here, we investigated aerobic glycolysis and excitatory-inhibitory balance in EC and EO conditions in visual cortex (VC, a non-DMN node) and posterior cingulate cortex (PCC, a DMN node).Methods: In 17 healthy volunteers (7 male, age 27±1.0), we combined fMRI-localized VC and PCC J-edited functional MRS (fMRS) runs of lactate, Glx, and γ-aminobutyric acid (GABA) as indicators of aerobic glycolysis and excitatory-inhibitory balance. These fMRS runs were also supplemented by calibrated fMRI to represent changes in cerebral blood flow (CBF) and oxidative metabolism (CMRO2). The fMRI localizers consisted of three 2.7min VC (or PCC) stimulation epochs interleaved with three 2.7min fixation (or rest) epochs. For VC activation paradigm, the whole-screen flashing (8Hz) checkerboard was used (visual angle 15×18°). For PCC deactivation paradigm, participants listened to short sentences audio-emotion portrayals4 with eyes closed, and they were asked to press the response button each time a specific emotion, contempt, disgust or surprise, was identified. Bilateral VC and PCC (de)activations were identified using statistical parametric mapping (SPM12). A single fMRS voxel was placed around the identified VC and PCC areas. All experiments were performed at the MRRC (Yale University) on a 3T Siemens Prisma scanner using 64-channels head coil (fMRI runs) and 4T Bruker spectrometer using single-channel quadrature surface head coil (fMRS runs). For fMRI localizer runs, we used gradient-echo T2*-weighted EPI (648 scans, TR = 1.5s, TE = 30ms, 2mm3 voxels). For calibrated fMRI, we used ASL (104 scans, TR = 3s, TE = 20ms, 4×4×5mm voxels, TI = 700/1400ms, TD = 384ms); similar ASL with disabled labeling for proton density map (5 scans, TE = 26ms), spin-echo EPI for T2 map (scans with TE = 41,70,110,160,220,300,400ms), and gradient-echo EPI for T2* map (scans with TE = 23,30,50,80,120, 170,250ms) with the same TR = 20s and 4×4×5mm voxels. ASL data were pair-wise subtracted and the quantitative imaging of perfusion using a single subtraction (QUIPSS II) was applied to quantify CBF5,6. T2 and T2* maps were calculated based on single exponential model fit. The combined BOLD and CBF model was applied to quantify CMRO2 based on CBF, T2, and T2* maps7. Calibrated fMRI estimates were averaged within applied VC and PCC fMRS voxels. Prior to fMRS acquisitions, we acquired B0 field map and water spectrum, adjusted basic frequency and shimming globally and locally, and optimized RF power. For fMRS we used J-difference editing targeting lactate/GABA (104 paired spectra, TR = 2.7s, TE = 144ms/70ms, VC voxel size ~14mL, PCC voxel size ~25mL). J-edited spectra were corrected for a basic frequency drift, aligned, phase-corrected, apodized (gaussian 2Hz, exponential 2Hz) and averaged to pairs. Individual spectra were centered and aligned to the group average reference NAA peak. The residual BOLD linewidth narrowing was estimated using line-shape differences in NAA peak between the EC and EO rest and nulled using exponential linewidth adjustment. The same corrections were applied to the lactate/GABA sum and difference spectra. Lactate/GABA/Glx (pooled glutamate and glutamine co-edited with GABA) levels were estimated using LCM quantification (CRLB<20)8 and scaled to NAA levels. Correlations were assessed using two-tailed Pearson correlation (N = 17).
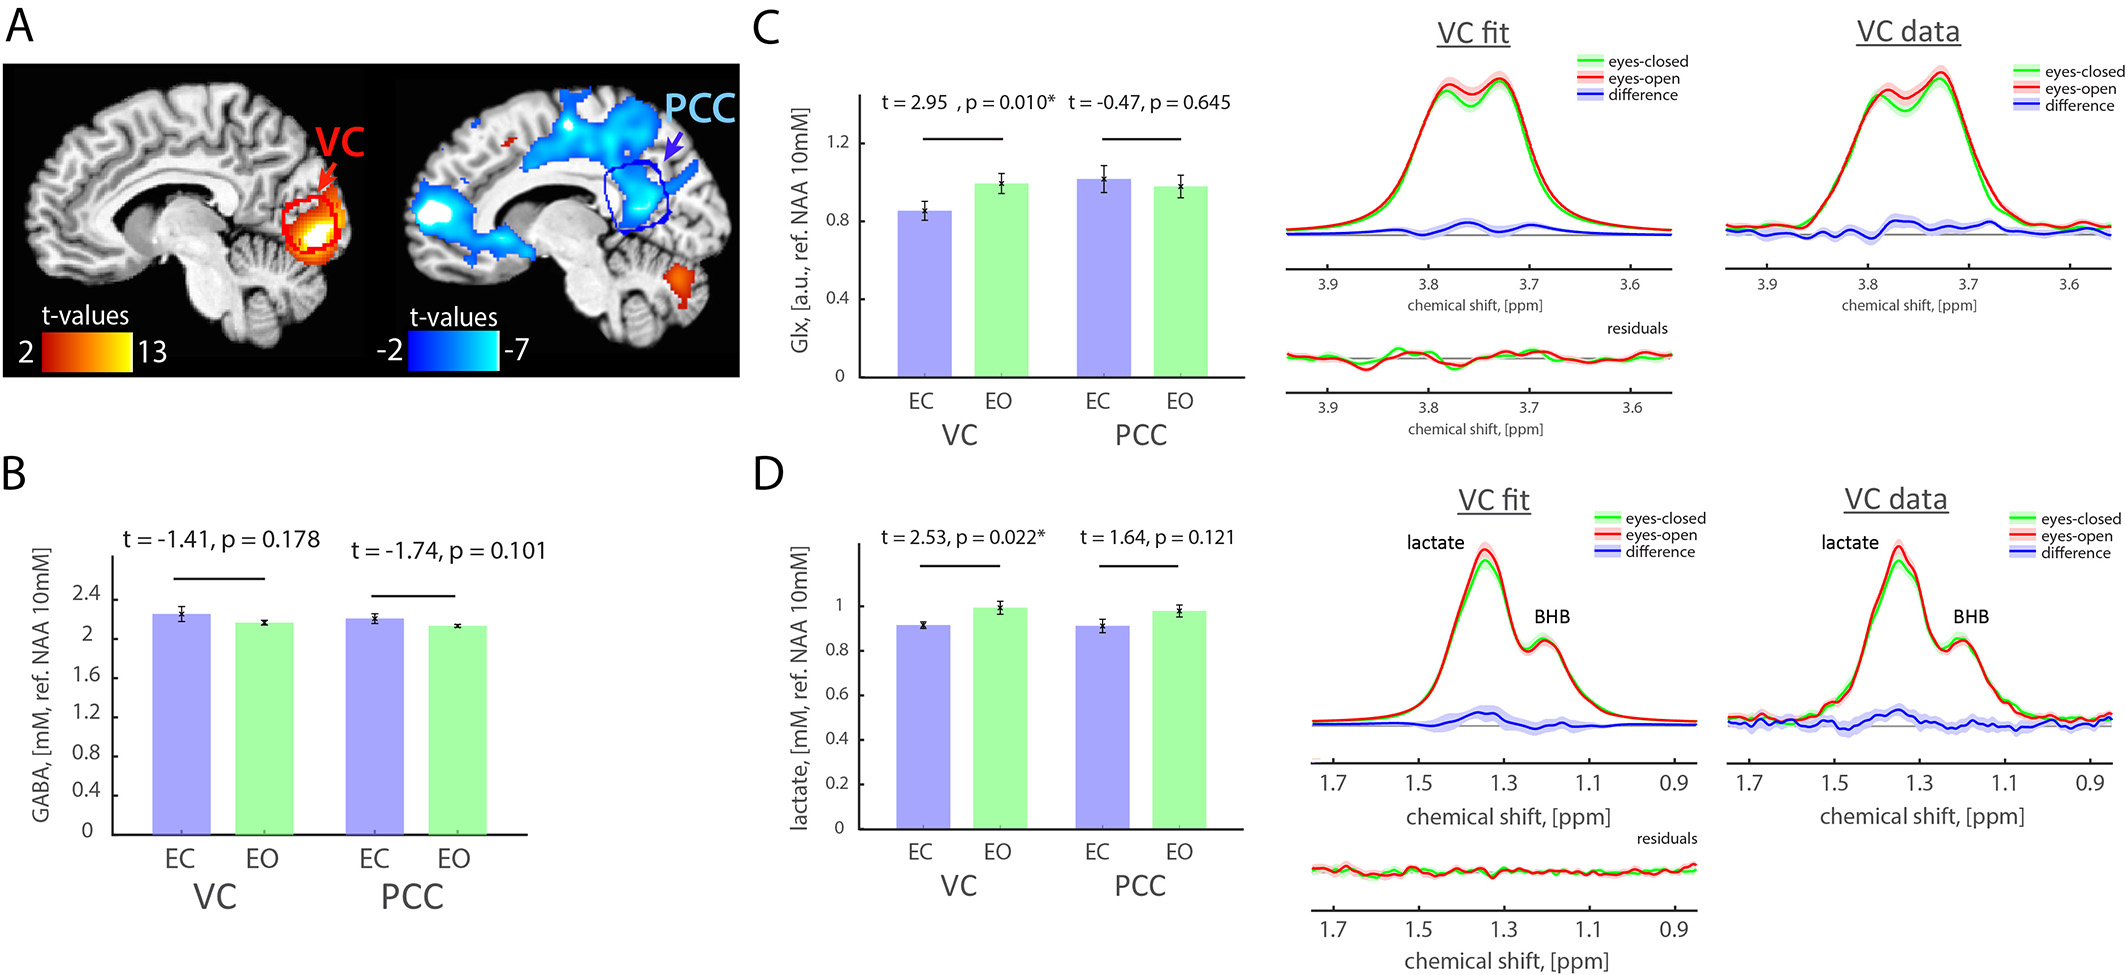
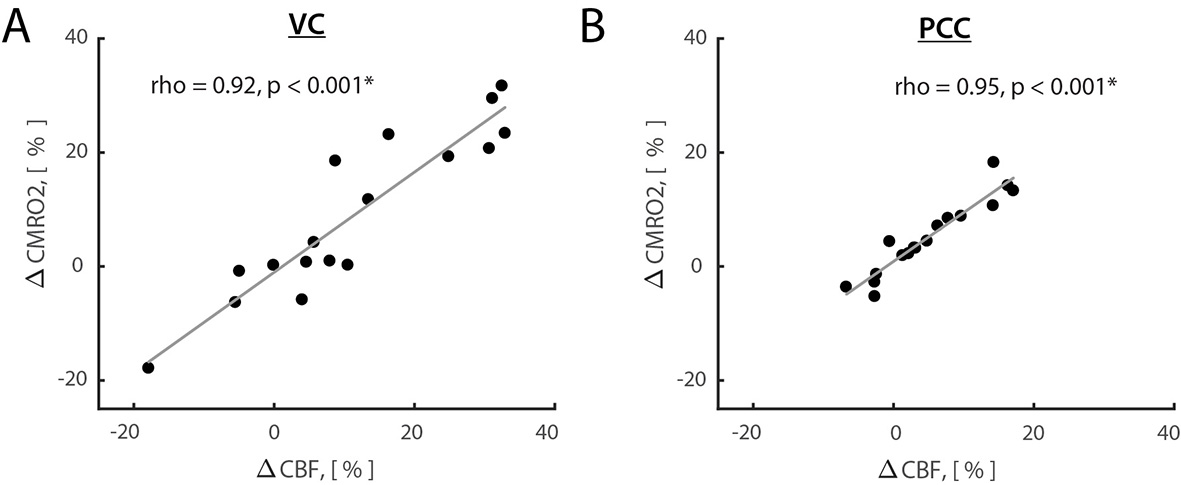
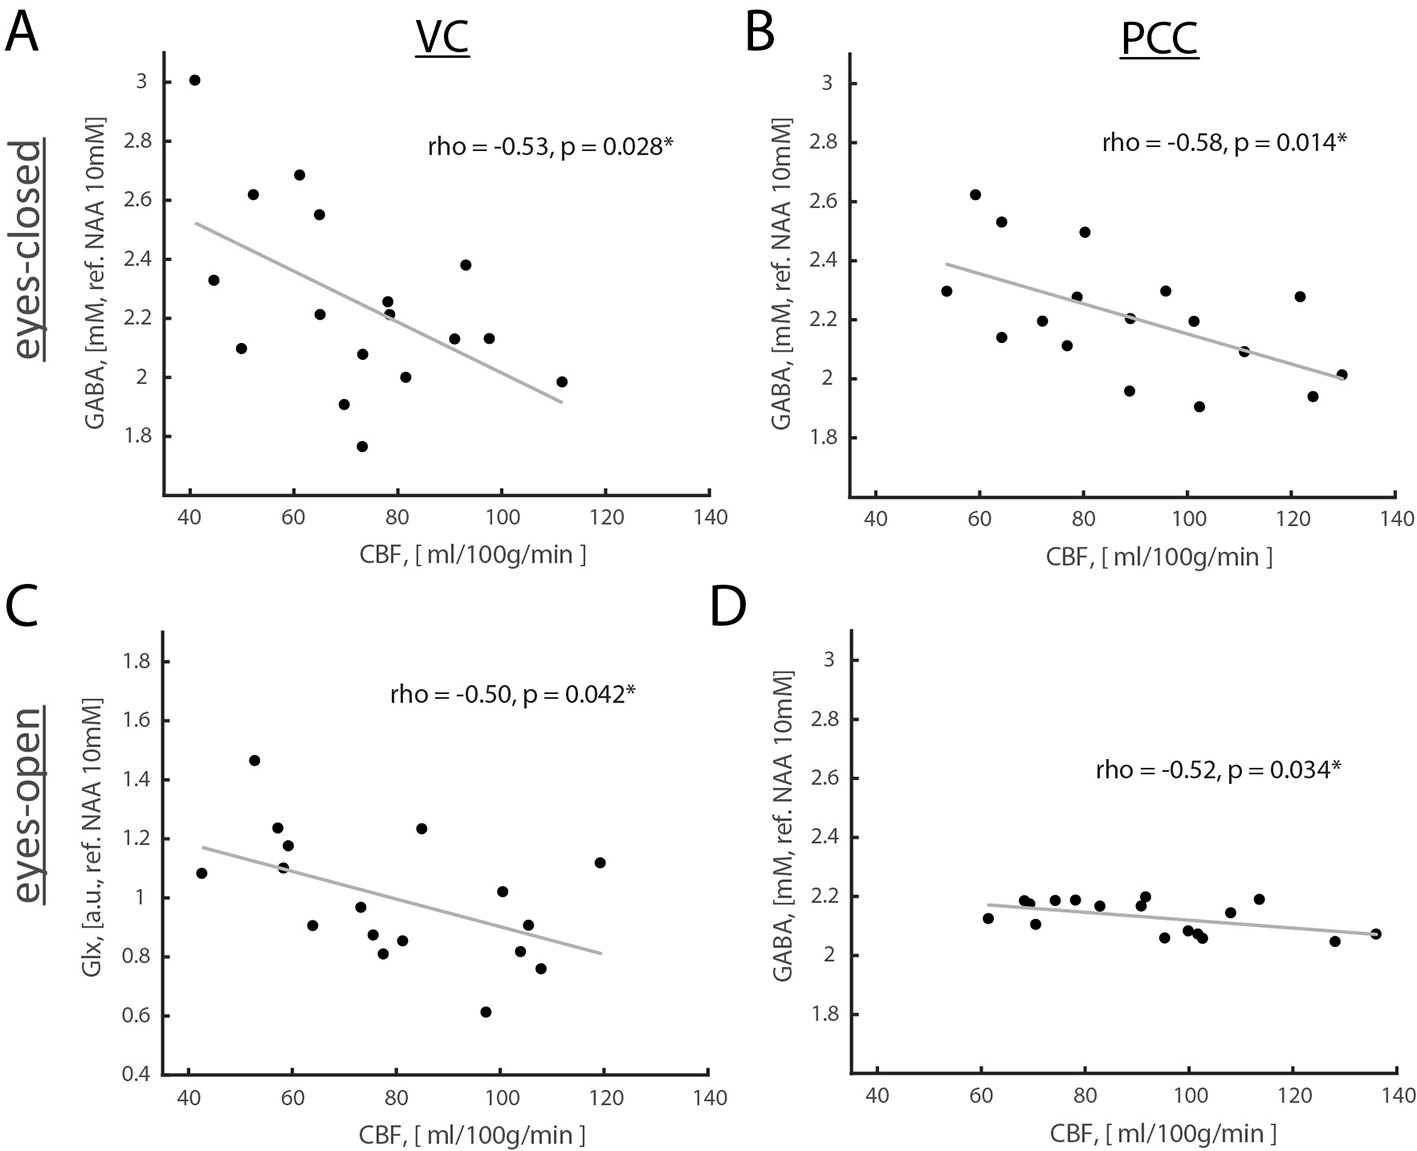
Results: Opening eyes elevated lactate and Glx only in VC (Fig. 1), which corresponds to coupled changes in blood flow and oxidative metabolism in activated network nodes. We did not observe significant changes in GABA in both VC and PCC. We found a positive correlation between changes in CBF and CMRO2 (Fig. 2), which suggests that flow-metabolism coupling in VC and PCC are nearly identical. Eyes-closed GABA level was negatively correlated with CBF in both VC and PCC (Fig. 3A,B). In VC, eyes-opened Glx level was negatively correlated with CBF (Fig. 3C). Finally, eyes-open GABA level was negatively correlated with CBF only in PCC (Fig. 3D). Glx levels are in a.u. due to the J-editing optimal set for GABA.
Discussion and Conclusion: Paralleled coupled changes in CBF and CMRO2 indicated equivalent flow-metabolism couplings in functionally localized VC and PCC. The VC was also specifically responsive to EO and EC conditions as indicated by GABA being negatively correlated with CBF in EC, and Glx being negatively correlated with CBF in EO. The eyes-closed inhibition was consistent in both VC and PCC, as indicated by negative correlation of GABA and CBF. Thus, we found that functional changes between EO and EC conditions are regionally non-specific to aerobic glycolysis and flow-metabolism coupling, but neurovascular coupling in VC depends on EO and EC conditions. Our study features the importance of disentangling the metabolic underpinnings of targeted nodes for different resting-state conditions.
Acknowledgements
This study was supported by the Swiss National Science Foundation (P300PB_161083) and the National Institute of Health, USA (R01 NS-100106, R01 MH-067528, R21 MH-110862, P30 NS-052519).References
1 Patriat, R. et al. The effect of resting condition on resting-state fMRI reliability and consistency: a comparison between resting with eyes open, closed, and fixated. Neuroimage 78, 463-473, doi:10.1016/j.neuroimage.2013.04.013 (2013).
2 Thompson, G. J. et al. The Whole-Brain "Global" Signal from Resting State fMRI as a Potential Biomarker of Quantitative State Changes in Glucose Metabolism. Brain connectivity 6, 435-447, doi:10.1089/brain.2015.0394 (2016).
3 Thompson, G. J. Neural and metabolic basis of dynamic resting state fMRI. Neuroimage, doi:10.1016/j.neuroimage.2017.09.010 (2017).
4 Banziger, T., Mortillaro, M. & Scherer, K. R. Introducing the Geneva Multimodal expression corpus for experimental research on emotion perception. Emotion 12, 1161-1179, doi:10.1037/a0025827 (2012).
5 Luh, W. M., Wong, E. C., Bandettini, P. A. & Hyde, J. S. QUIPSS II with thin-slice TI1 periodic saturation: a method for improving accuracy of quantitative perfusion imaging using pulsed arterial spin labeling. Magnetic resonance in medicine : official journal of the Society of Magnetic Resonance in Medicine / Society of Magnetic Resonance in Medicine 41, 1246-1254, doi:10.1002/(sici)1522-2594(199906)41:6<1246::aid-mrm22>3.0.co;2-n (1999).
6 Qiu, M. et al. Arterial transit time effects in pulsed arterial spin labeling CBF mapping: insight from a PET and MR study in normal human subjects. Magnetic resonance in medicine : official journal of the Society of Magnetic Resonance in Medicine / Society of Magnetic Resonance in Medicine 63, 374-384, doi:10.1002/mrm.22218 (2010).
7 Hyder, F. & Rothman, D. L. Quantitative fMRI and oxidative neuroenergetics. Neuroimage 62, 985-994 (2012).
8 Provencher, S. W. Automatic quantitation of localized in vivo 1H spectra with LCModel. NMR in biomedicine 14, 260-264 (2001).
Figures