1117
Towards intravascular BOLD signal characterization in balanced SSFP experiments of human blood at high to ultra-high fields
Marlon Pérez-Rodas1,2, Hildegard Schulz1, Rolf Pohmann1, Klaus Scheffler1,3, and Rahel Heule1
1High-Field MR Center, Max Planck Institute for Biological Cybernetics, Tübingen, Germany, 2Graduate Training Centre of Neuroscience, IMPRS for Cognitive and Systems Neuroscience, University of Tübingen, Tübingen, Germany, 3Department of Biomedical Magnetic Resonance, University of Tübingen, Tübingen, Germany
1High-Field MR Center, Max Planck Institute for Biological Cybernetics, Tübingen, Germany, 2Graduate Training Centre of Neuroscience, IMPRS for Cognitive and Systems Neuroscience, University of Tübingen, Tübingen, Germany, 3Department of Biomedical Magnetic Resonance, University of Tübingen, Tübingen, Germany
Synopsis
To fully understand the neurovascular fingerprint observed in BOLD experiments, extravascular and intravascular contributions have to be identified separately. Balanced steady-state free precession (bSSFP) imaging has demonstrated the ability for distortion-free fMRI with high microvascular sensitivity. However, the underlying intravascular contribution to BOLD bSSFP is not yet entirely known as literature R2 relaxation rates do not reflect the apparent diffusion-related R2 decrease in blood with shorter bSSFP refocusing intervals (TRs). This work thus focuses on characterizing the oxygen sensitivity of bSSFP in blood samples at high to ultra-high fields by means of passband signal differences and intrinsic R2 estimation.
Introduction
Balanced steady-state free precession (bSSFP) imaging is an interesting alternative for functional MRI1,2,3,4 since, in contrast to standard EPI-based techniques, it provides distortion-free images with high SNR efficiency. Moreover, Monte Carlo simulations have revealed that BOLD-related signal changes measured with bSSFP are selective to microvessels5,6 similar to the spin echo and are thus believed to be closer to the neuronal event than the gradient echo. A full understanding of measured neurovascular fingerprints requires a separate consideration of extravascular as well as intravascular contributions to the BOLD effect. In case of rapidly refocused bSSFP, the intravascular contribution is controlled by the transverse relaxation rate R2, which not only strongly depends on the oxygenation level (Y) but also on the refocusing interval (TR)7 due to diffusion narrowing effects around red blood cells (RBCs) that contain paramagnetic deoxyhemoglobin. The bSSFP signal in blood can thus not simply be estimated using literature R2 values, which are commonly derived from spin-echo techniques. In this work, the oxygen sensitivity of bSSFP in human blood samples at high to ultra-high fields (i.e., 3 T, 9.4 T, and 14.1 T) depending on TR is assessed by 1) direct calculation of passband bSSFP signal differences and 2) intrinsic R2 estimation from phase-cycled bSSFP scans using MIRACLE8, 9.Methods
Fresh venous blood from healthy adult volunteers was collected at the local blood bank. The oxygenation levels (Y) were adjusted by bubbling air through the blood samples. The physiological hematocrit (Hct) level of the blood was not altered. The Y and Hct values were assessed quantitatively using a radiometer before and after the MR measurement session. For each session of experiments (one session at each field strength), four blood samples were prepared in 3 ml tubes; two with Y ≈ 70% (referred to as deoxygenated) and two with Y ≈ 94% (referred to as oxygenated). Average Hct level of the measured blood samples was ≈ 42%. Imaging of the prepared blood samples was performed at 3 T, 9.4 T, and 14.1 T MR scanners. The blood probes were placed into a cylindrical phantom along with a manganese-doped reference probe (0.2 mM MnCl2 in H2O). Temperature-controlled water was circulated through the phantom to heat the blood samples to a temperature of 37°C. The temperature inside the phantom container was permanently monitored during the MR experiments with an MR-compatible fiber optic temperature sensor. The phantom was rotated in-between subsequent scans by a dedicated robot-arm to avoid RBC sedimentation. 3D phase-cycled bSSFP experiments were performed using 20 RF phase increments ϕ in the range (0°, 360°) for different TRs up to 10 ms and a flip angle of α = 10° as outlined in more detail below:3 T: TR = [ 4, 5, 6, 8, 10] ms. Resolution: 1.2x1.2x2 mm3 (matrix size: 128x64x18).
9.4 T: TR = [ 3, 4, 5, 6, 8, 10] ms. Resolution: 1.2x1.2x2 mm3 (matrix size: 128x64x18).
14.1 T: TR = [2.5, 3, 4, 5, 6, 8, 10] ms. Resolution: 0.7x0.7x1 mm3 (matrix size: 85x85x26).
Gold standard R1 and R2 were calculated based on single-slice inversion recovery with variable inversion times and single-slice single-echo spin-echo with variable echo times, respectively. Mean gold standard R1 and R2 values measured in deoxygenated and oxygenated blood probes along with mean Y and Hct levels are summarized in Table 1. Based on a Fourier transform of the measured complex bSSFP frequency profile, R2 values were estimated using MIRACLE9 with R1 fixed to the respective measured gold standard values. Signal differences of the passband bSSFP signal were derived after dividing the signal by the proportionality factor S0 as: ΔS = (Sox - Sdeox)/S0, where Sox and Sdeox are the mean passband bSSFP signal levels of oxygenated and deoxygenated blood probes, respectively, and S0 is a scaling factor accounting for proton density and coil sensitivity derived separately for each field strength based on a MnCl2-doped reference probe.
Results
Representative bSSFP frequency profiles acquired by a series of scans with different RF phase increments for a range of TRs in deoxygenated and oxygenated blood samples at 3 T, 9.4 T, and 14.1 T are shown in Figure 1. Mean bSSFP passband signal differences ΔS between oxygenated and deoxygenated probes are displayed in Figure 2 versus TR, revealing the expected increase in ΔS versus TR, in particular for higher field strength. The same trend is observed for the quantitative R2 assessment in the deoxygenated probes with MIRACLE, i.e., a diffusion-related increase in R2 for longer TRs, especially prominent at 14.1 T, while the R2 in oxygenated blood is highly TR-insensitive (cf. Fig. 3). Note that for TRs ≥ 8 ms at 14.1 T, the R2 fitting is becoming unreliable since the signal in deoxygenated blood reaches the noise level as reflected by increased standard deviations.Discussion and Conclusion
The increased oxygen sensitivity of bSSFP for longer refocusing intervals was evident and assessed based on passband signal differences as well as quantitatively using intrinsic R2 estimation based on MIRACLE. In a further step, the obtained results can be combined with, e.g., Monte Carlo simulations to determine the overall BOLD bSSFP effect, including a differentiation between extravascular and intravascular contributions.Acknowledgements
No acknowledgement found.References
- Scheffler K, Seifritz E, Bilecen D, Venkatesan R, Hennig J, Deimling M, Haacke EM. Detection of BOLD changes by means of a frequency‐sensitive trueFISP technique: preliminary results. NMR Biomed 2001;14(7‐8):490-496.
- Dharmakumar R, Hong J, Brittain JH, Plewes DB, Wright GA. Oxygen-sensitive contrast in blood for steady-state free precession imaging. Magn Reson Med 2005;53(3):574-583.
- Miller KL. FMRI using balanced steady-state free precession (SSFP). Neuroimage 2012;62(2):713-719.
- Scheffler K, Ehses P. High-resolution mapping of neuronal activation with balanced SSFP at 9.4 Tesla. Magn Reson Med 2016;76(1):163-171.
- Baez-Yanez MG, Ehses P, Mirkes C, Tsai PS, Kleinfeld D, Scheffler K. The impact of vessel size, orientation and intravascular contribution on the neurovascular fingerprint of BOLD bSSFP fMRI. Neuroimage 2017;163:13-23.
- Scheffler K, Heule R, Báez-Yánez MG, Kardatzki B, Lohmann G. The BOLD sensitivity of rapid steady‐state sequences. Magn Reson Med 2019;81(4):2526-2535.
- Gardener AG, Francis ST, Prior M, Peters A, Gowland PA. Dependence of blood R2 relaxivity on CPMG echo-spacing at 2.35 and 7 T. Magn Reson Med 2010;64(4):967-974.
- Pérez-Rodas M, Schulz H, Pohmann R, Scheffler K, Heule R. R1 and R2 characterization of human blood with phase-cycled balanced steady-state free precession (bSSFP). Proc. Intl. Soc. Mag. Reson. Med. 27 (2019), p. 3766.
- Nguyen D, Bieri O. Motion-insensitive rapid configuration relaxometry. Magn Reson Med 2017;78(2):518-526.
Figures
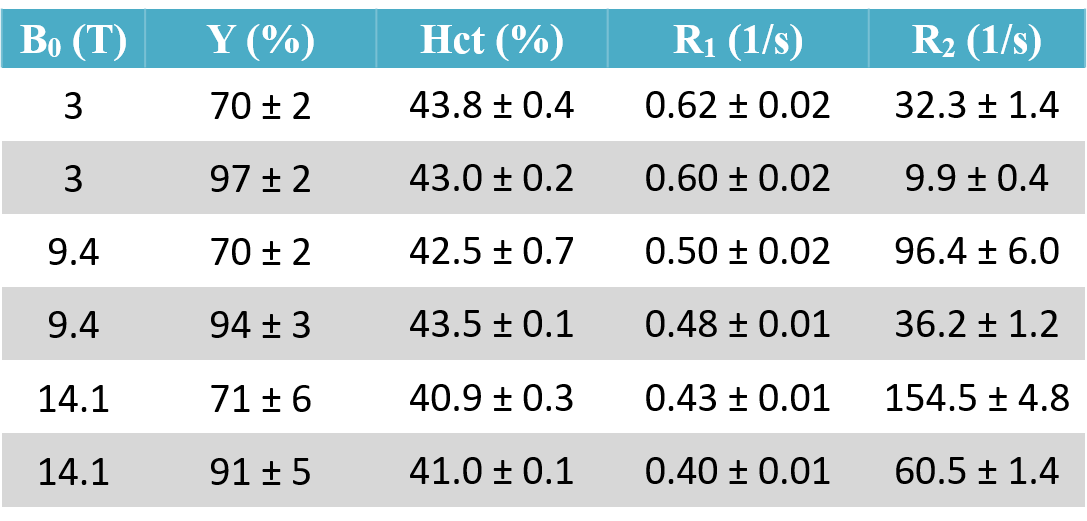
Table 1. Mean oxygenation (Y) and hematocrit (Hct)
levels along with mean gold standard relaxation rates R1 and R2
measured in deoxygenated (rows with white background) and oxygenated (rows with
gray background) blood probes at three different field strengths (3 T, 9.4 T,
and 14.1 T). There was a slight drop in the oxygenation level between beginning
and end of the MR measurement session, which typically lasted 4-6 hours. The
displayed Y values are the average between measured levels at the beginning and
end.
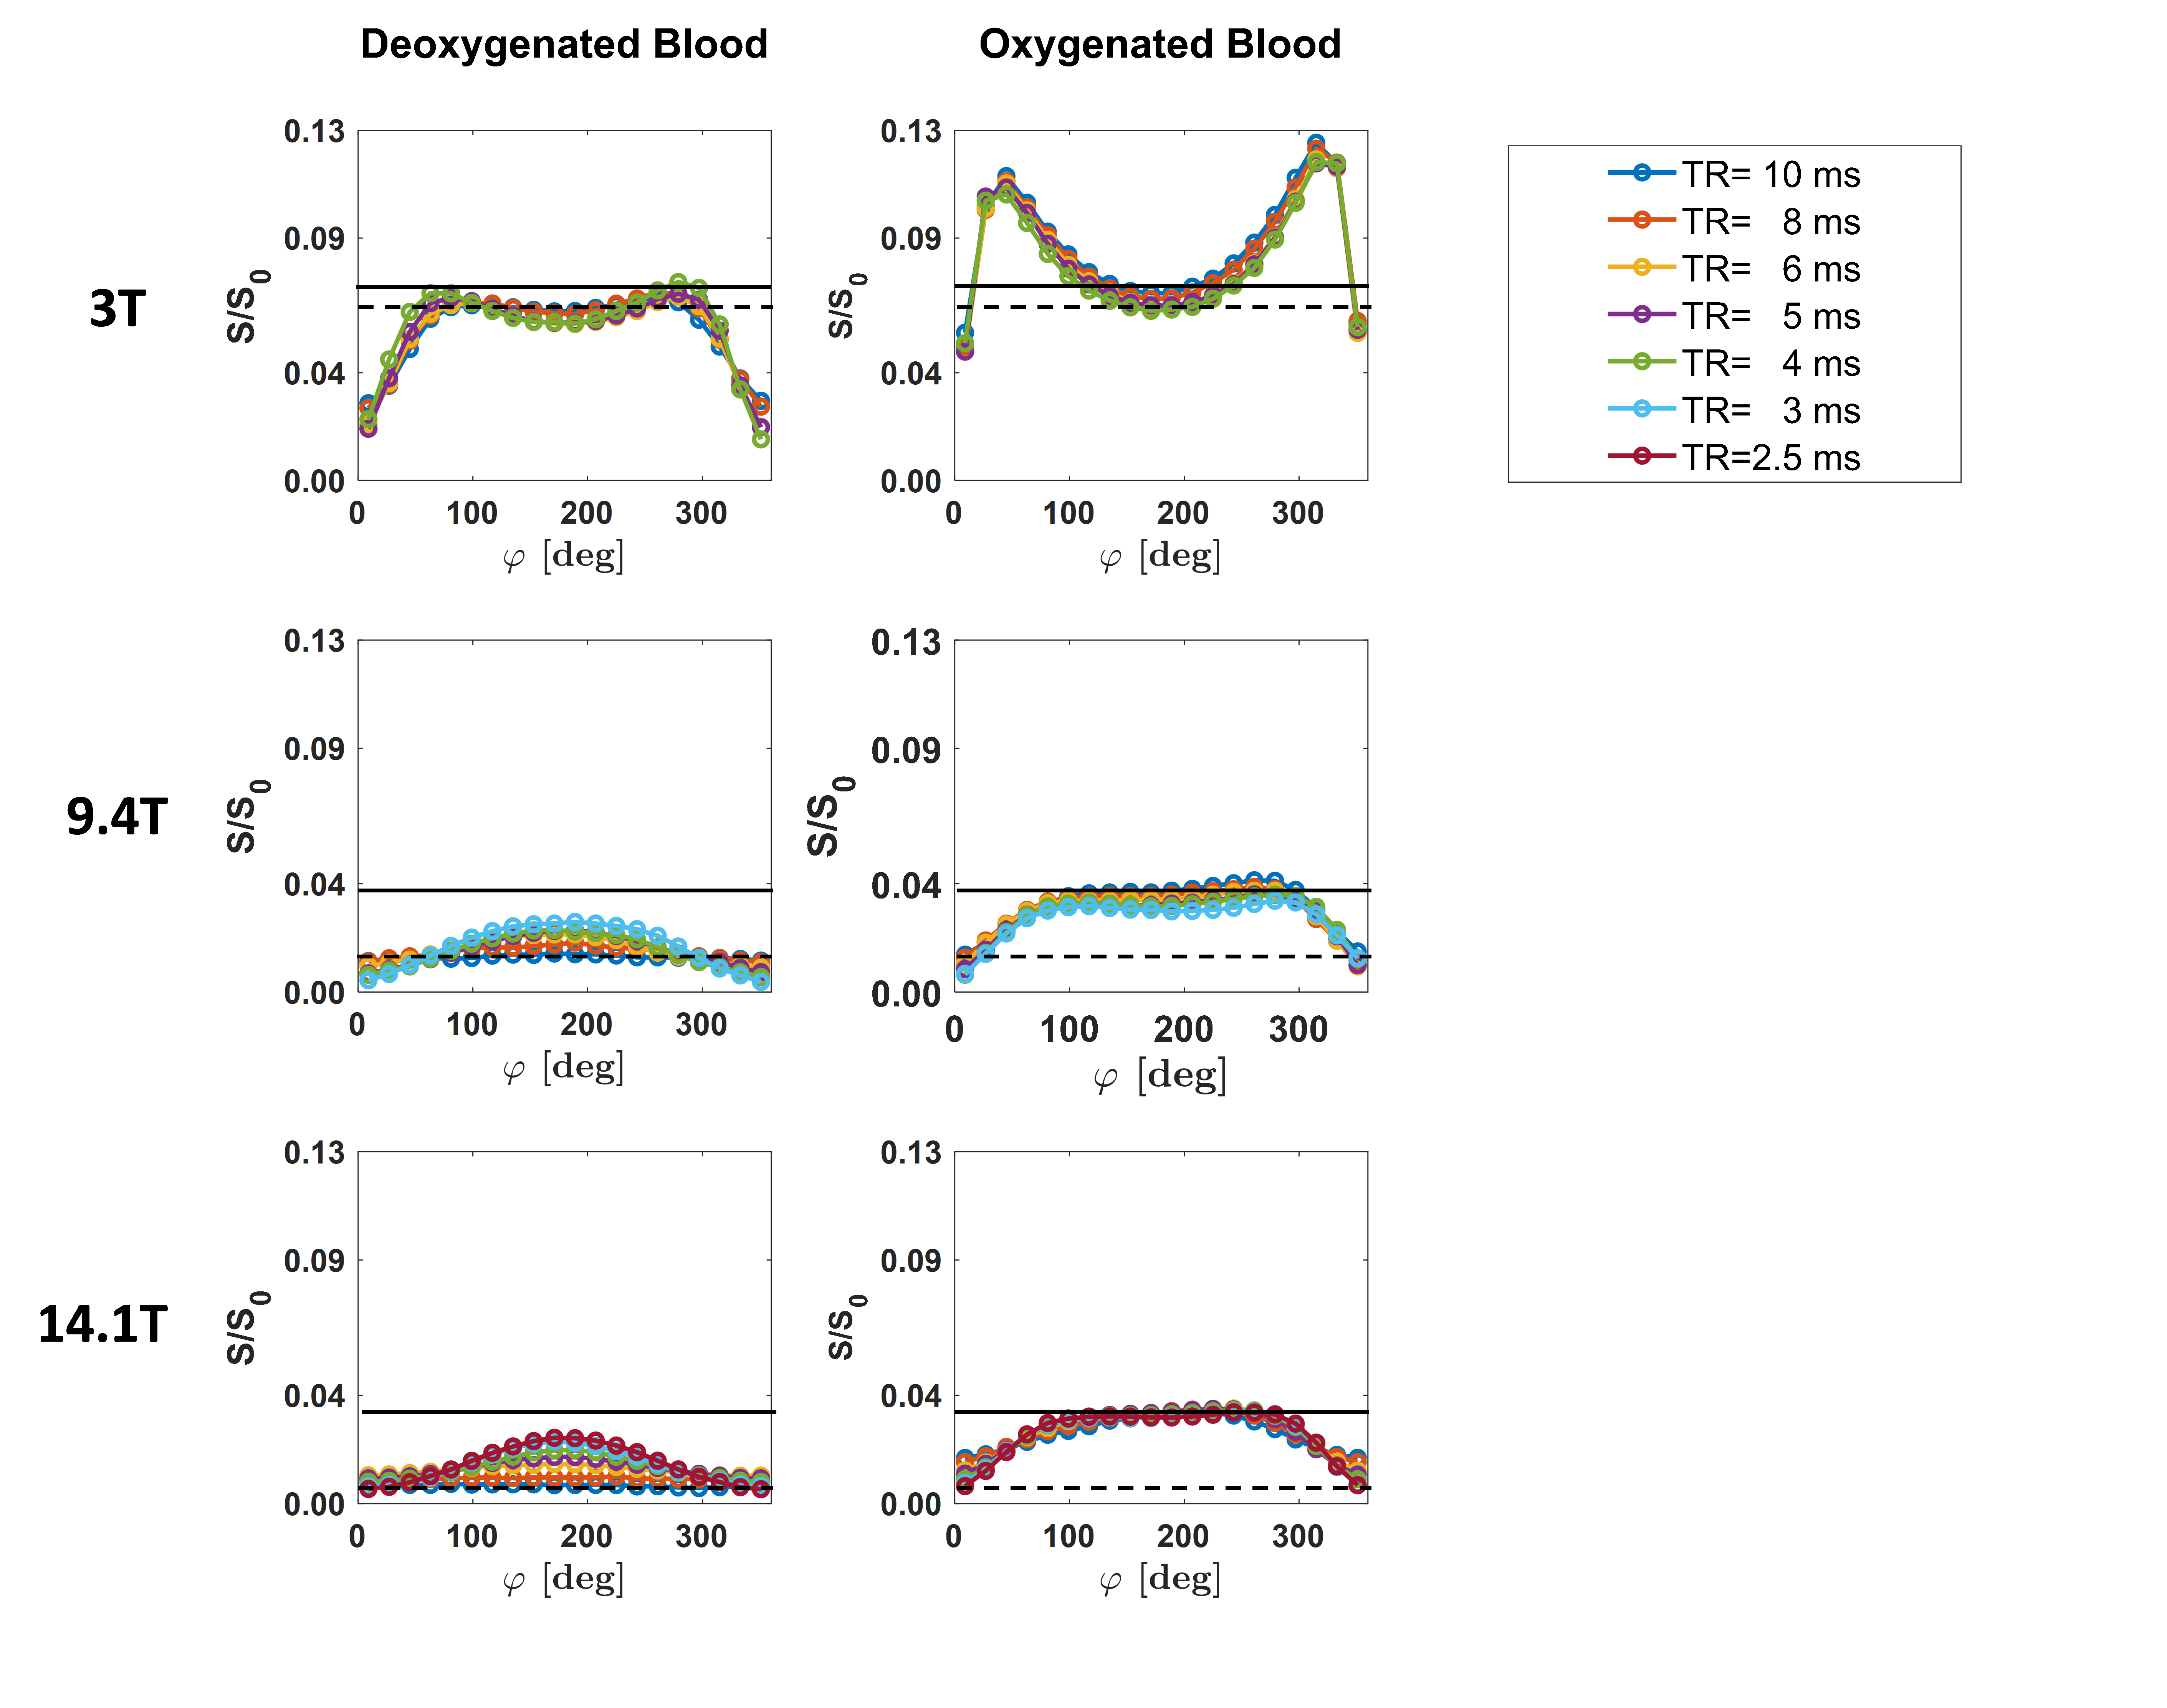
Figure 1. Representative bSSFP frequency
profiles obtained for different TRs in deoxygenated (left column) and
oxygenated (right column) blood samples at 3 T (top row), 9.4 T (middle row),
and 14.1 T (bottom row). The measured bSSFP signal level S is normalized by the
scaling factor S0 (cf. “Methods” section) to allow a comparison
across field strengths. The black lines highlight the signal change in passband
bSSFP between deoxygenated (dashed line) and oxygenated (solid line) blood at
TR = 10 ms.
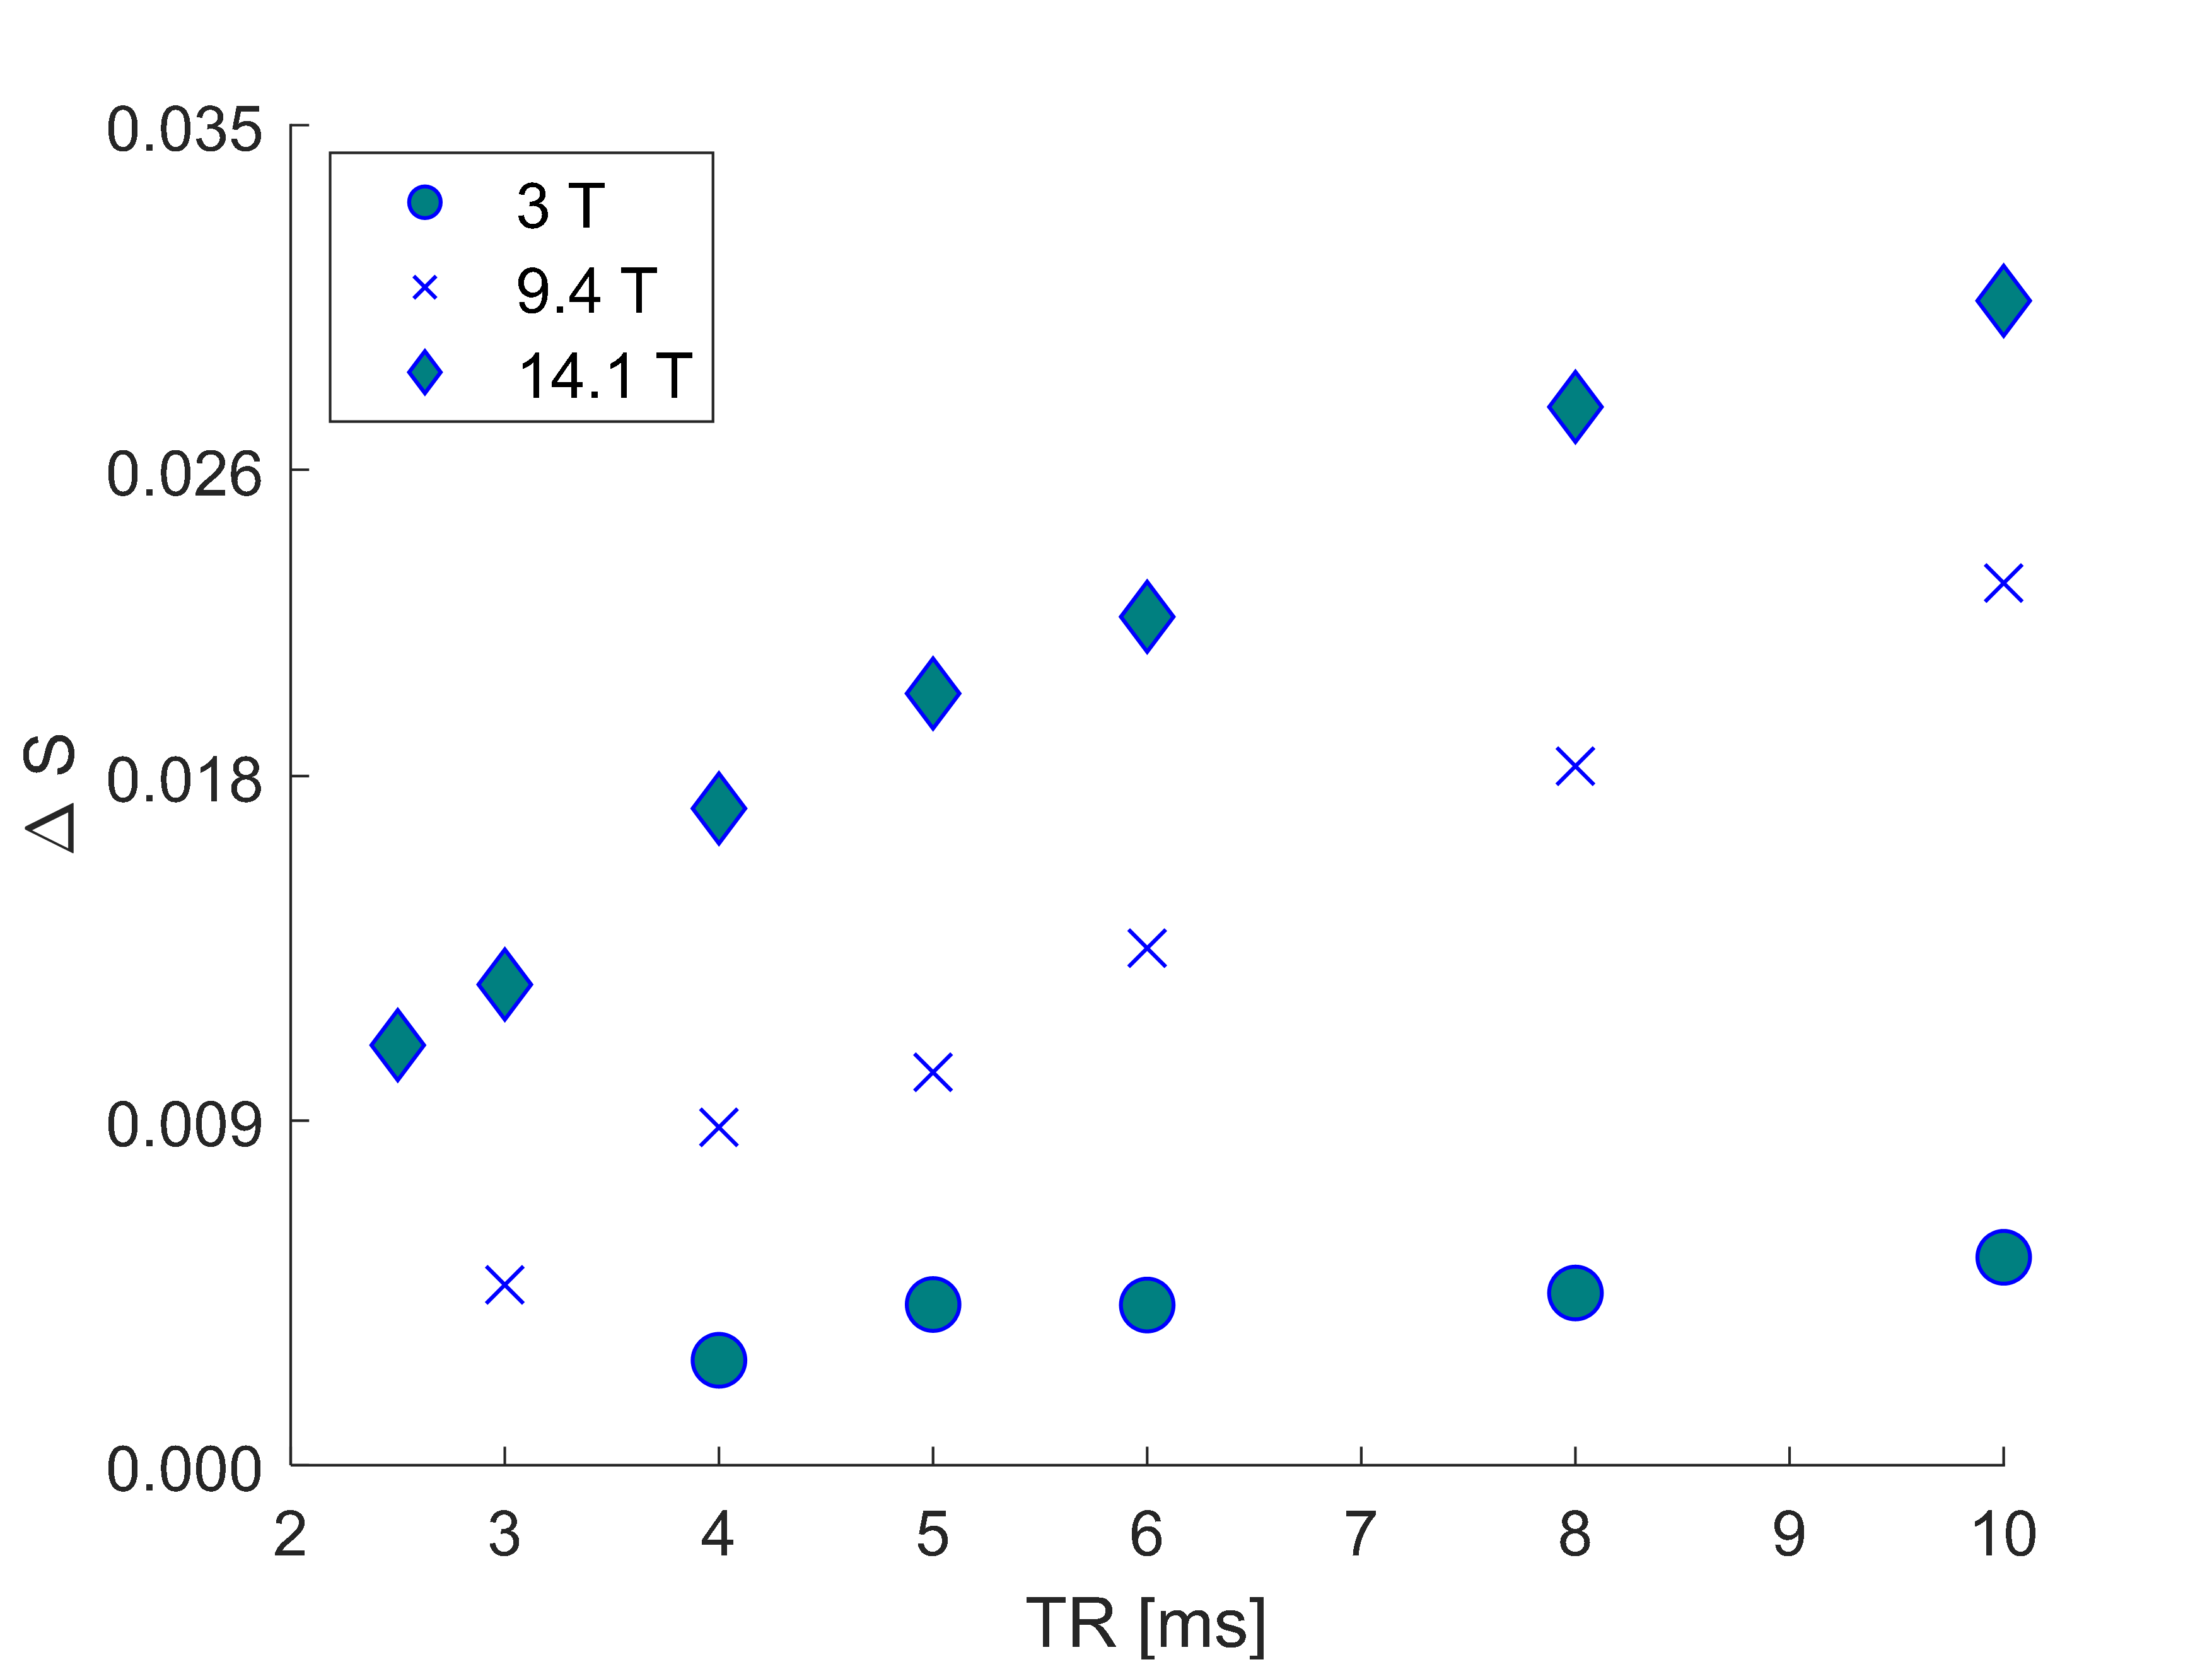
Figure 2. Normalized passband bSSFP signal
change ΔS between oxygenated and deoxygenated blood samples versus TR for field
strengths of 3 T, 9.4 T, and 14.1 T.
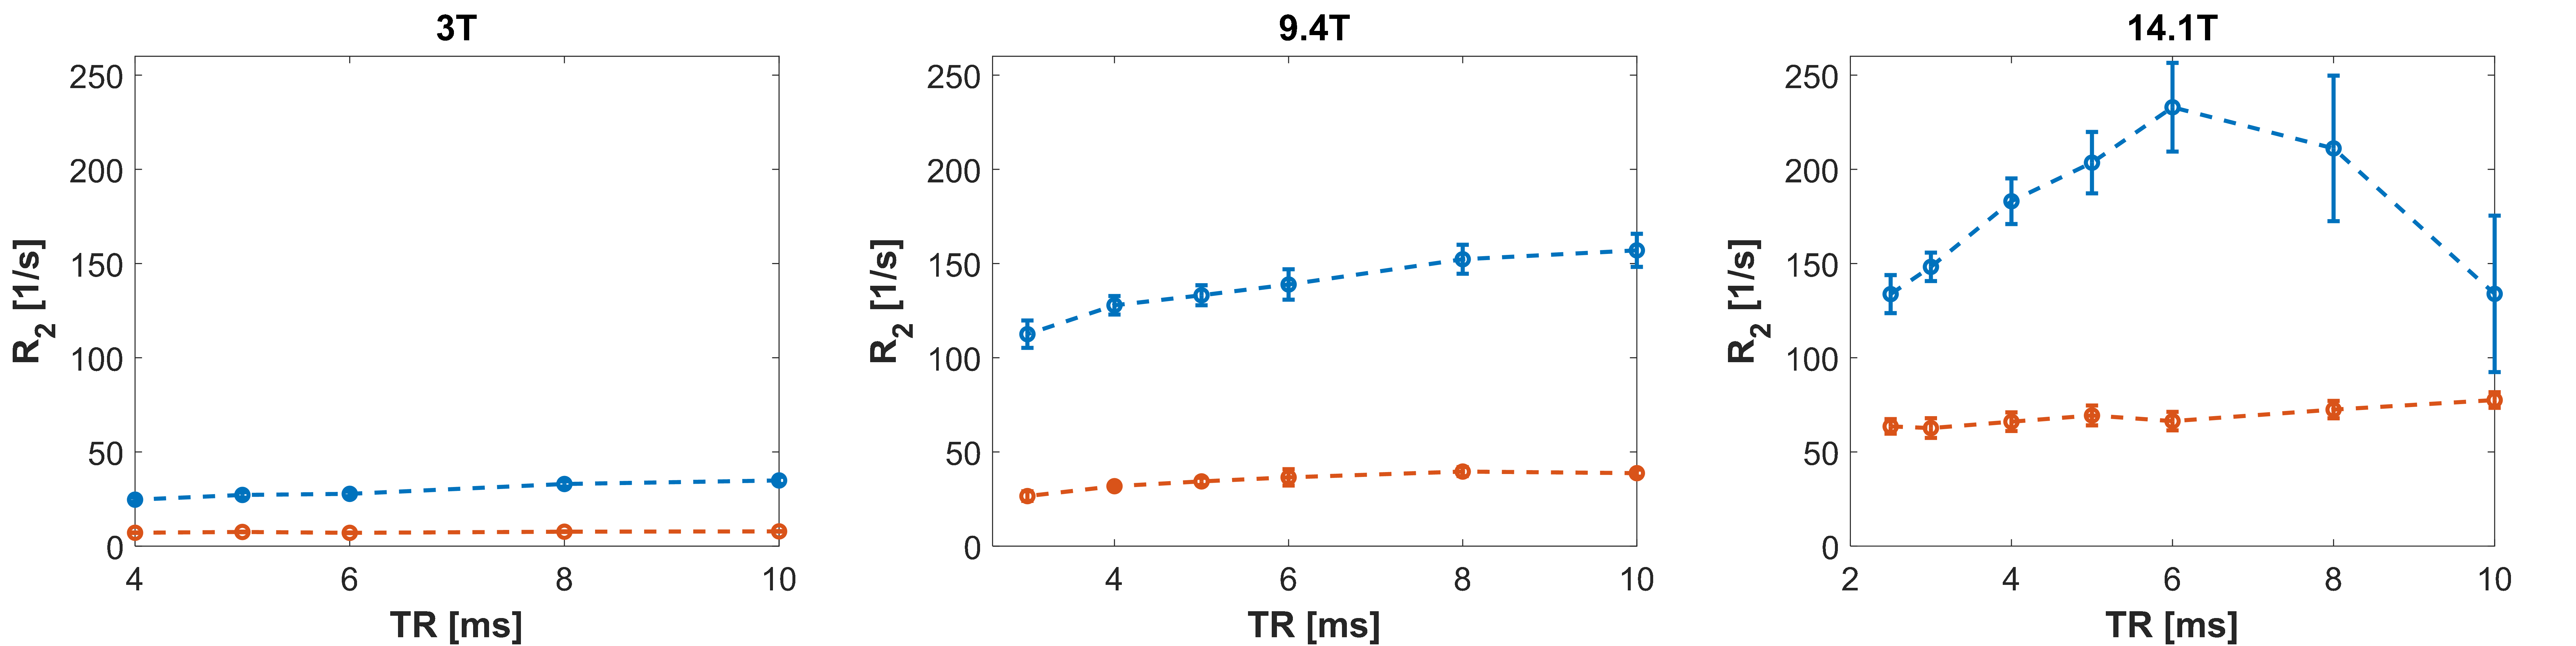
Figure 3. Dependence of MIRACLE-based R2
estimation in oxygenated (red) and deoxygenated (blue) blood samples on TR at 3
T (left), 9.4 T (middle), and 14.1 T (right). Using the concept of MIRACLE
relaxometry9, R2 was obtained intrinsically from the
acquired complex bSSFP frequency response while R1 was fixed to the
measured gold standard values.