1114
Probing dynamic cerebral autoregulation with BOLD fMRI using a thigh cuff challenge1CUBRIC, School of Physics and Astronomy, Cardiff University, Cardiff, United Kingdom
Synopsis
The Thigh Cuff Challenge (TCC) technique is a promising method for assessing dynamic cerebral autoregulation with fMRI. A TCC fMRI experiment was performed in order to better understand the BOLD fMRI signal changes associated with autoregulation. We demonstrate that TCC event-locked cortical fMRI signal changes are widespread across cortical grey matter, with varying response shape both within and between subjects. The TCC BOLD response is on average ~0.3%, which we estimate on a voxel-wise basis using a novel informed basis set, which provides a proof-of-concept demonstrating the potential of TCC and fMRI to probe cerebrovascular function.
Purpose
The thigh cuff challenge (TCC) is a widely employed technique for assessing dynamic cerebral autoregulation (dCA), as it causes a transient drop in blood pressure (BP) [1, 2]. It is routinely coupled with Transcranial Doppler (TCD) ultrasound to measure the cerebral blood flow velocity (CBFV) dynamics in large arteries associated with dCA in both health and disease. However, the high spatial resolution, whole brain coverage and superior sensitivity to microvascular flow makes functional MRI (fMRI) a highly attractive alternative to TCD when investigating autoregulatory processes. The purpose of this study is to investigate the feasibility of TCC as a tool for measuring dCA with BOLD fMRI. The few existing previous reports of TCC fMRI have invariably relied on global metrics to characterise dCA [3-6], thus not exploiting the full benefits of fMRI. To address this we use a data driven approach to derive a novel informed temporal basis set in order to increase the statistical power to measure complex and variable TCC responses across the brain. This approach affords voxel-wise sensitivity to the TCC responses, which is the first step in providing regional measures of dCA that exploit fMRI’s high spatial resolution.Methods
Experimental and imaging protocolAn fMRI TCC experiment was performed in 6 healthy male volunteers. The TCC protocol was as follows: Pneumatic cuffs were placed around the tops of both thighs and inflated to +40 mmHg above systolic BP for 152 s, and then rapidly deflated. Scanning was timed such that data collection began 20 second before deflation. After each TCC deflation, there was a period of 148 s before the next inflation. Each EPI sequence lasted 90 s (except for two subjects for whom it was 60 s). A series of 5 TCC maneuvers were repeated for five of the subjects, with the final subject completing 8 repeats. Data were acquired on a Siemens 3T MAGNETOM Prisma scanner with a 32-channel receiver head coil. The CMRR SMS sequence was used to acquire multiband EPI data with the following parameters: TR=1s, TE=30ms, flip angle=58°, 2mm2 in-plane resolution 60 slices (2mm thick), SMS=4, GRAPPA=2.
Analysis
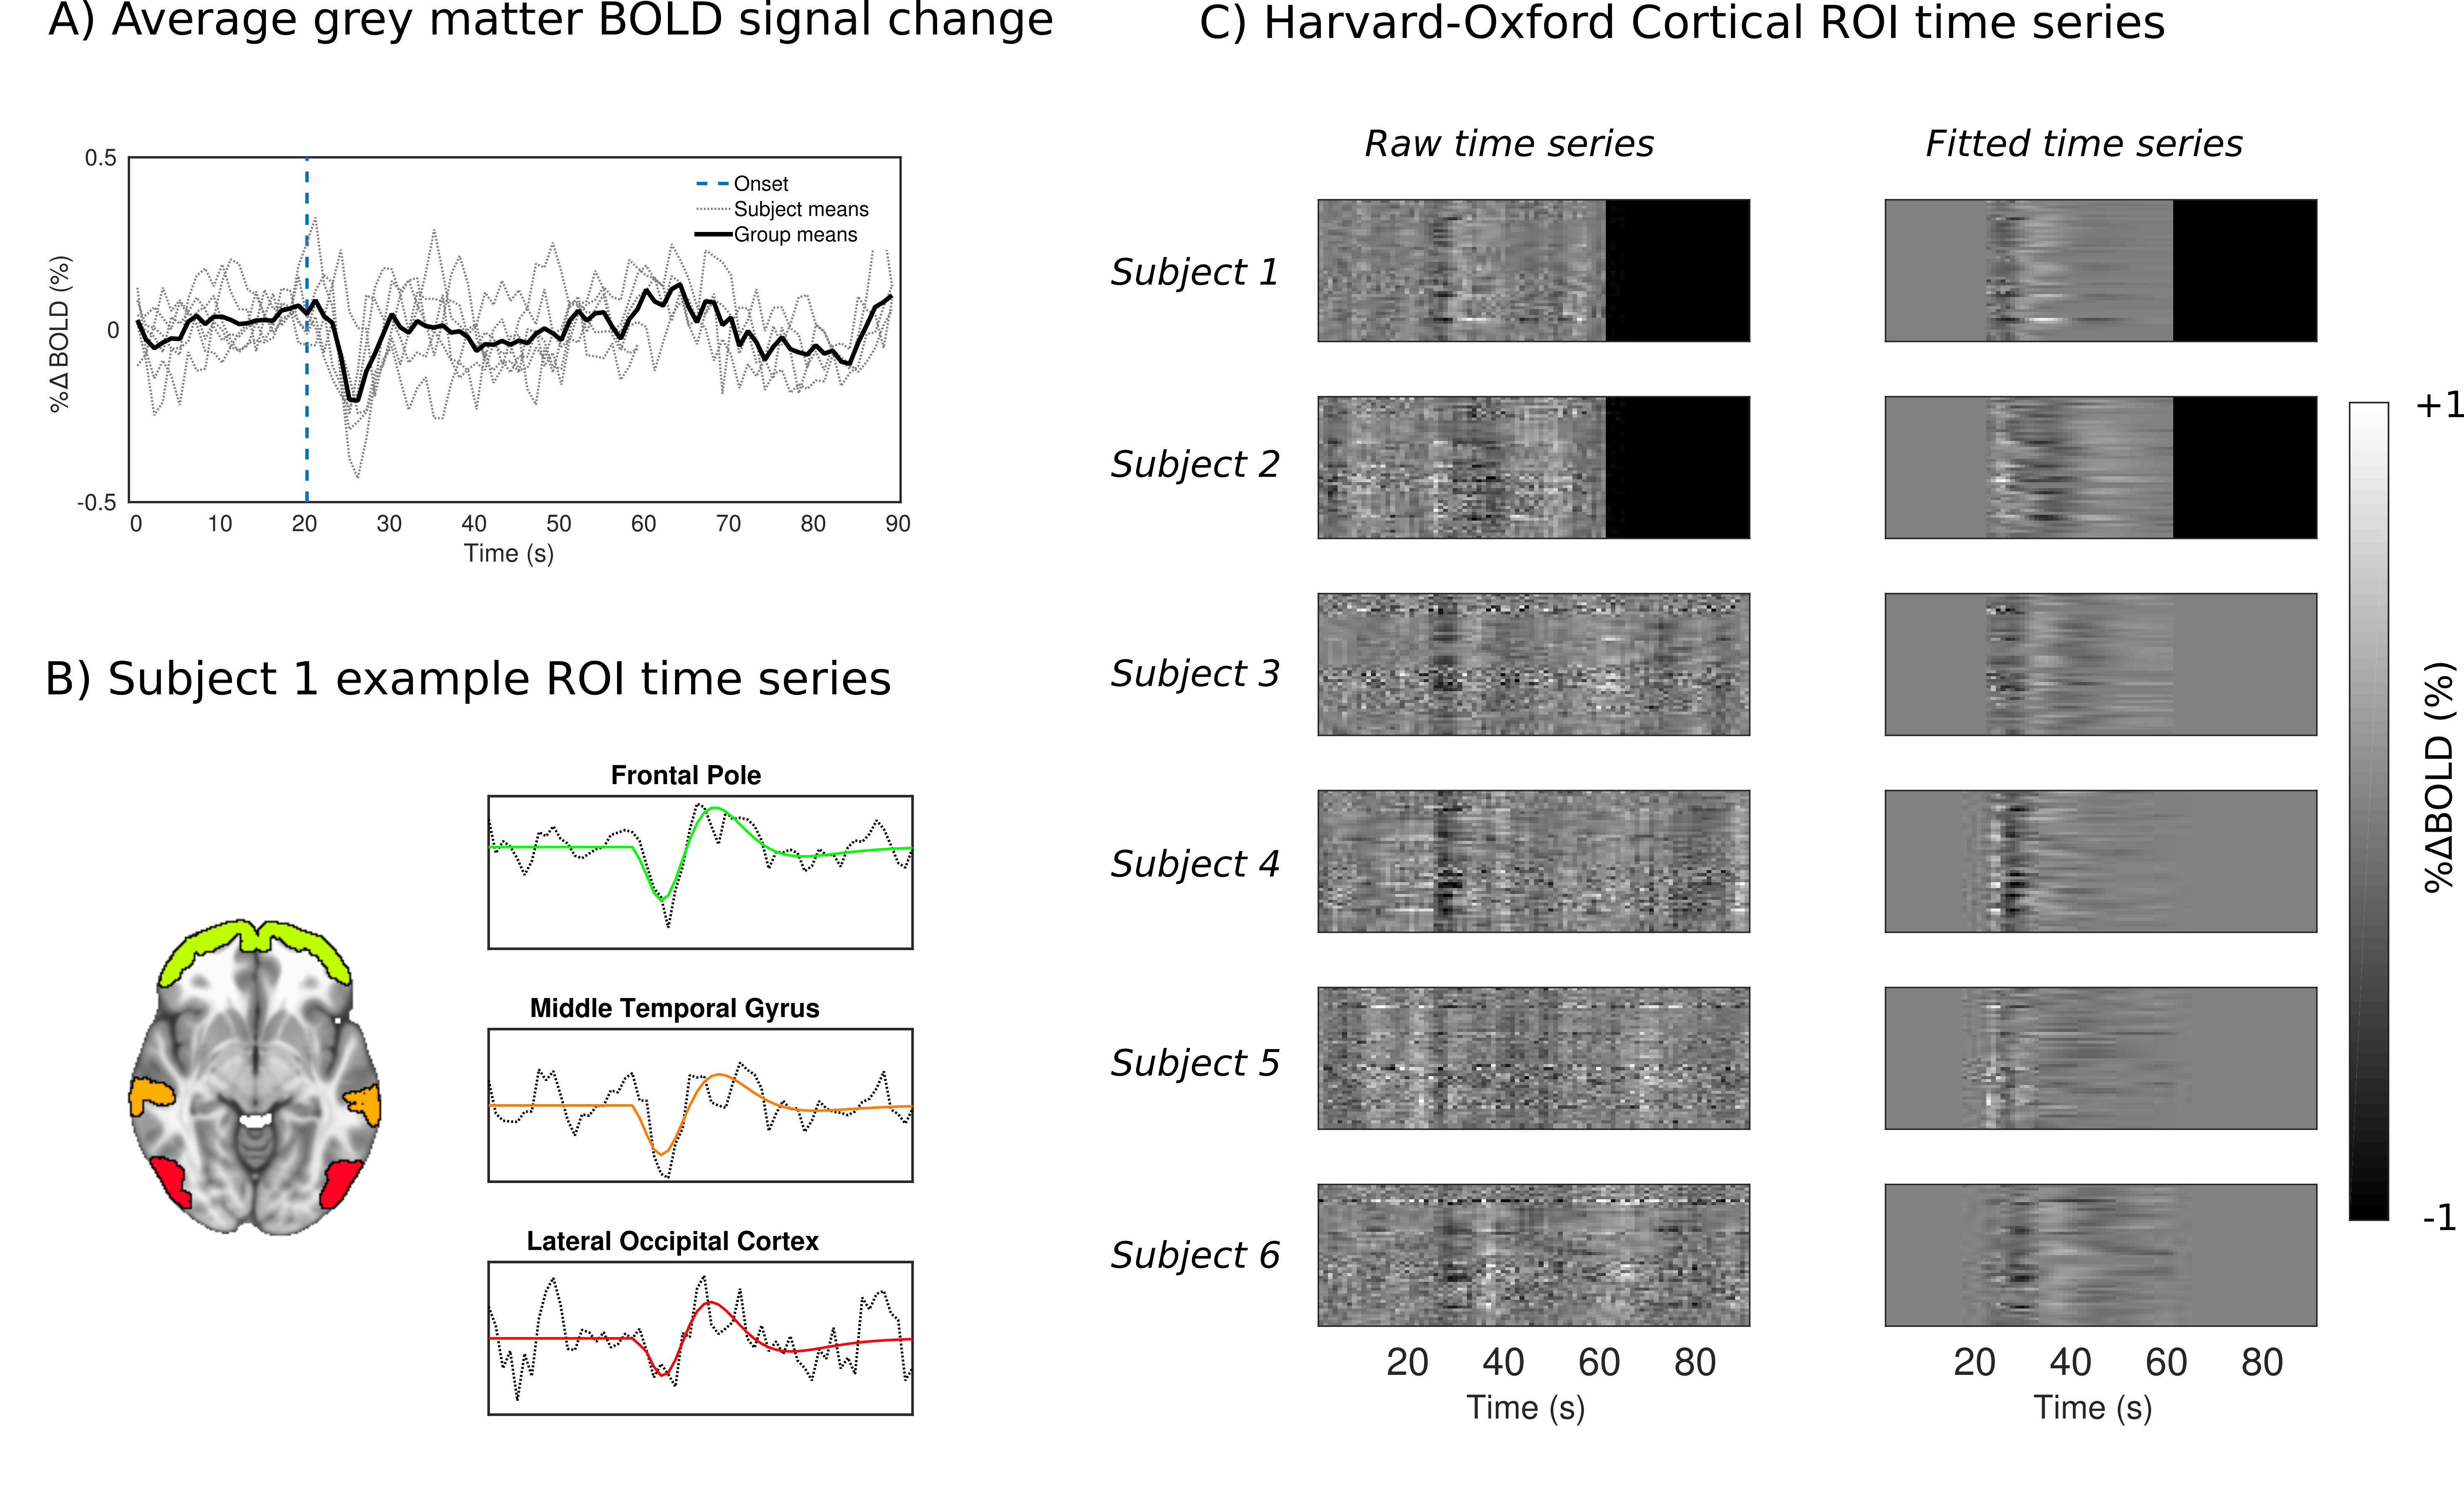
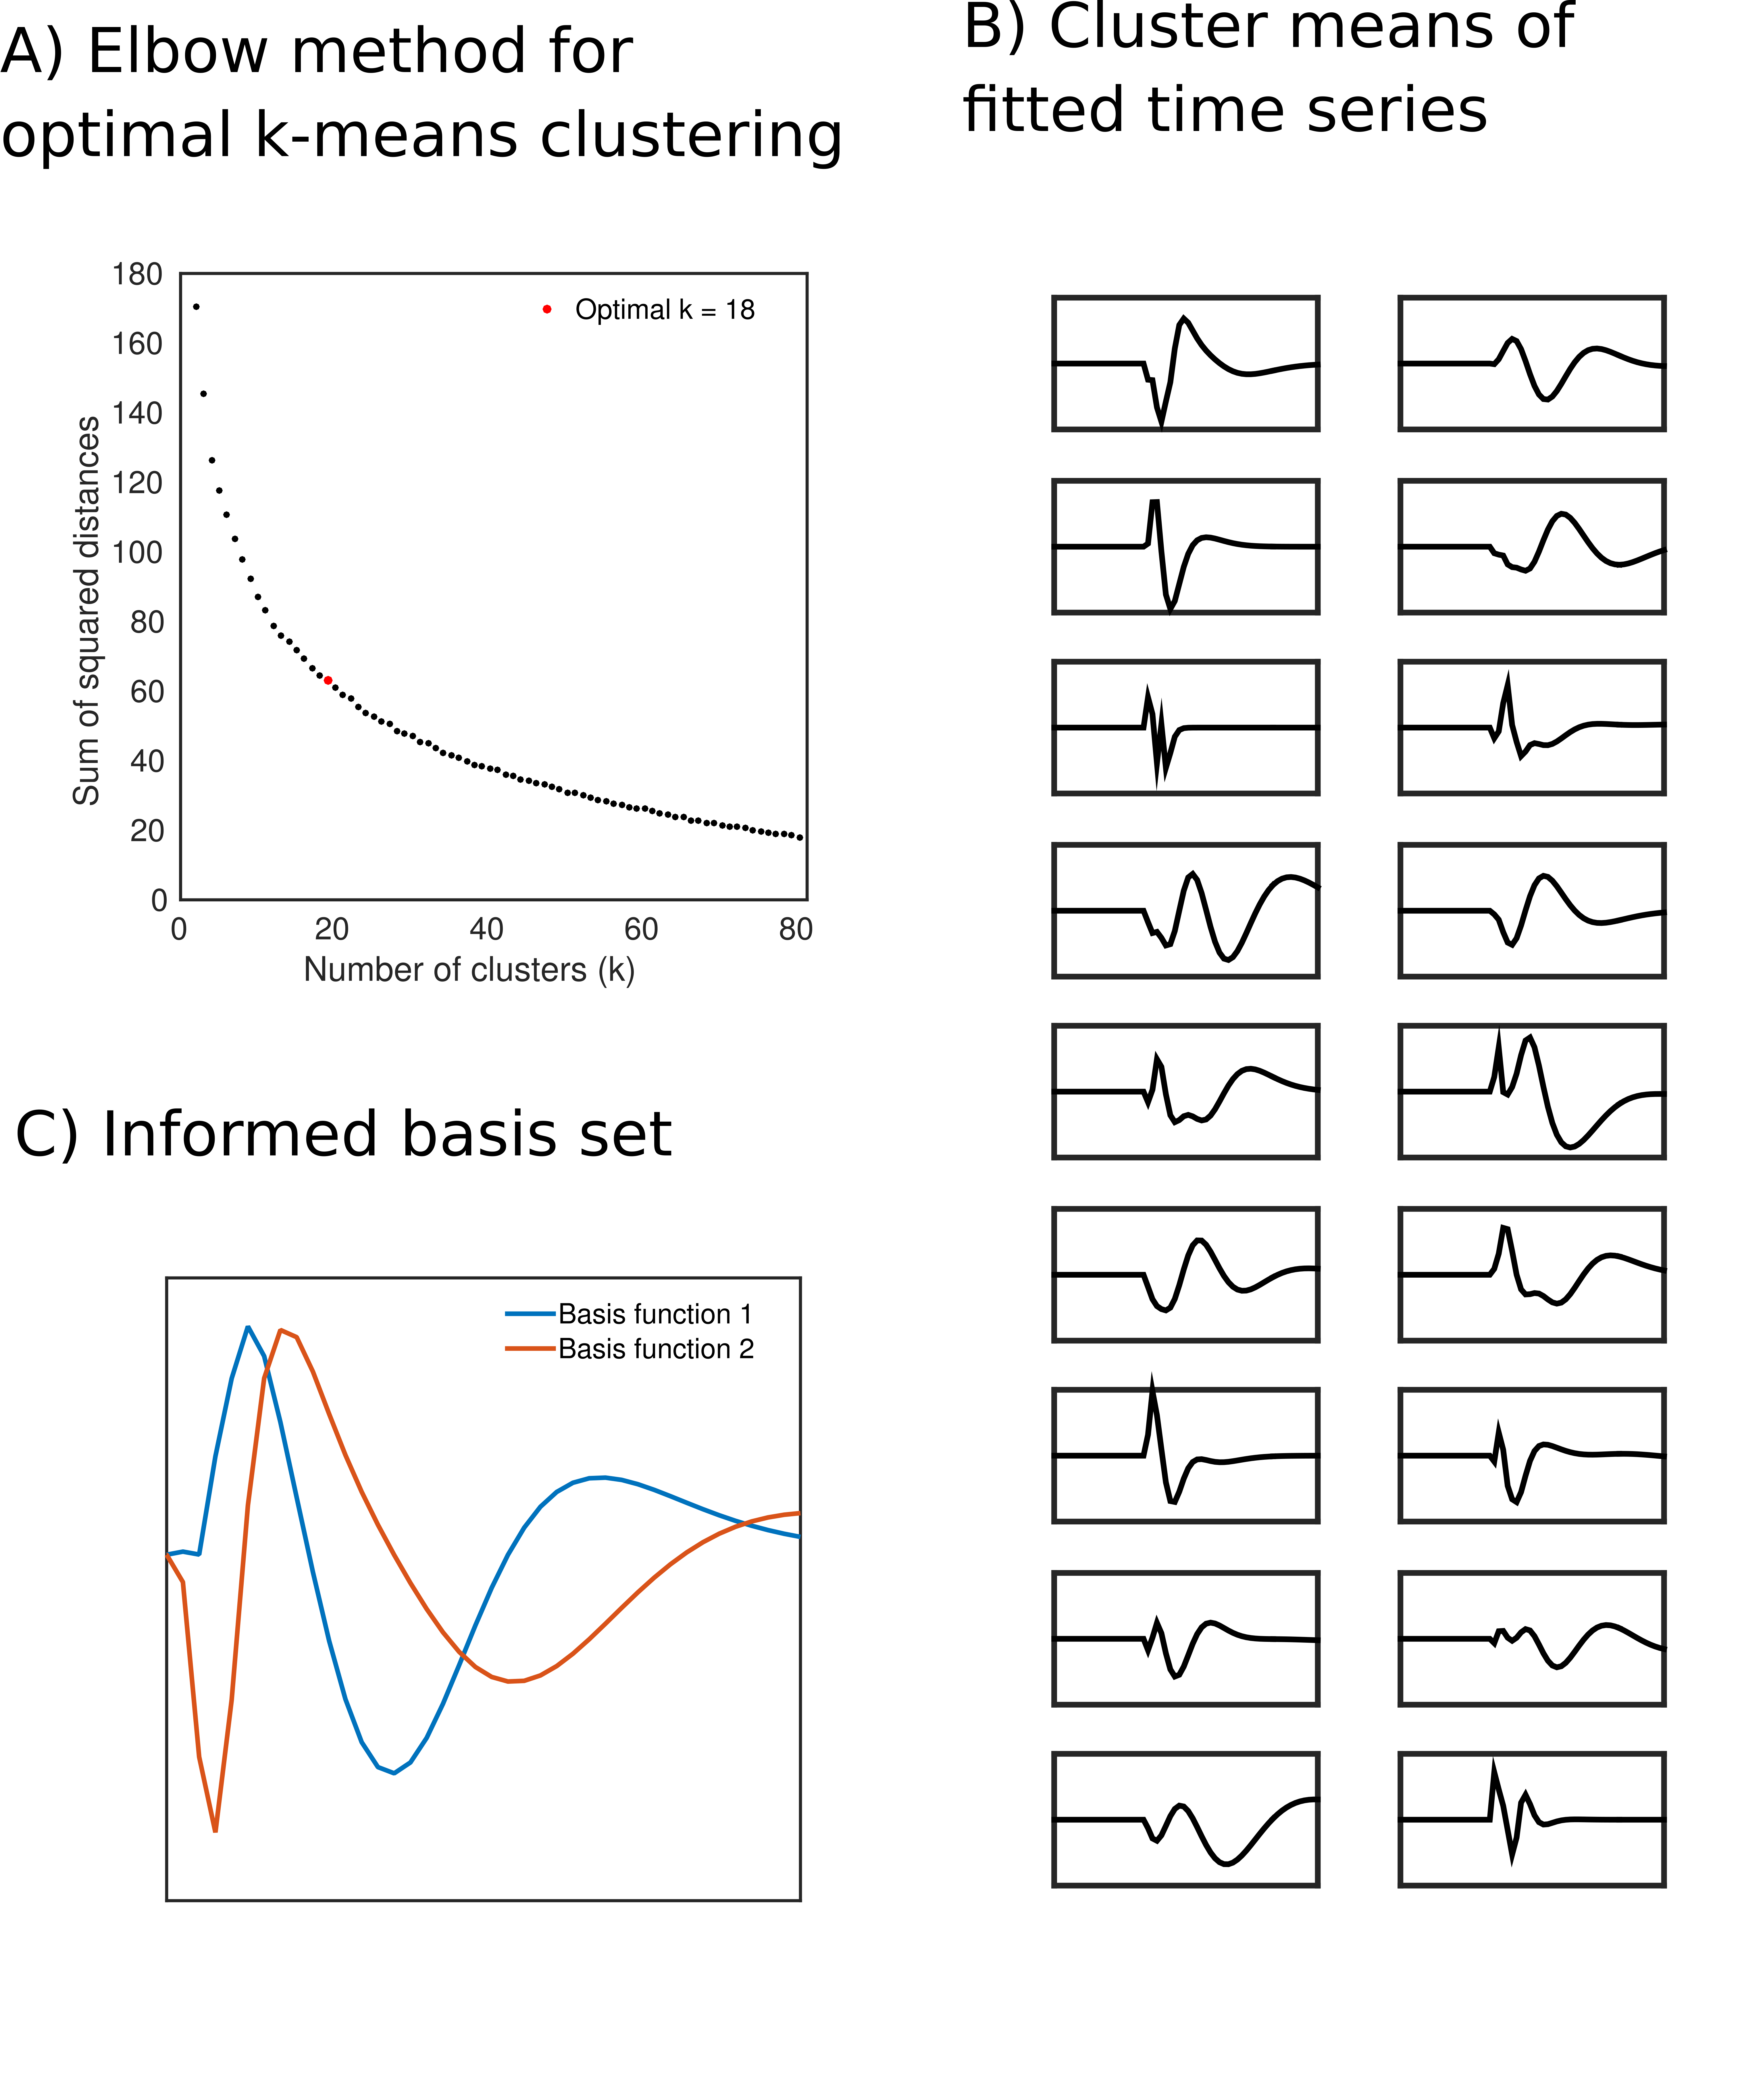
Data were motion corrected, cleaned (ANATICOR and motion parameters) and registered to MNI space. For each subject, TCC repeats were averaged to create a single TCC response dataset. The Harvard-Oxford cortical atlas was used to extract mean responses from 48 cortical ROIs. A set of generic basis functions was constructed from Laguerre polynomial functions (basisgen), which were then used to estimate the impulse response function (IRF) for each ROI. A voxel-wise analysis was performed using a novel set of informed temporal basis functions (basisinf) that were constructed as follows: A dimensionality reduction step was performed on the complete group set of ROI time-series basisgen fitted values by grouping them into a number of clusters using the k-means algorithm (Fig.2A). Singular value decomposition was performed on the mean time-series from each cluster (Fig.2B), and the novel basisinf set was composed of the first two eigenvectors (Fig.2C). Voxel-wise coefficients were then estimated using linear regression and resulting parameter maps were spatially smoothed (Gaussian kernel, FWHM=4mm).
Results
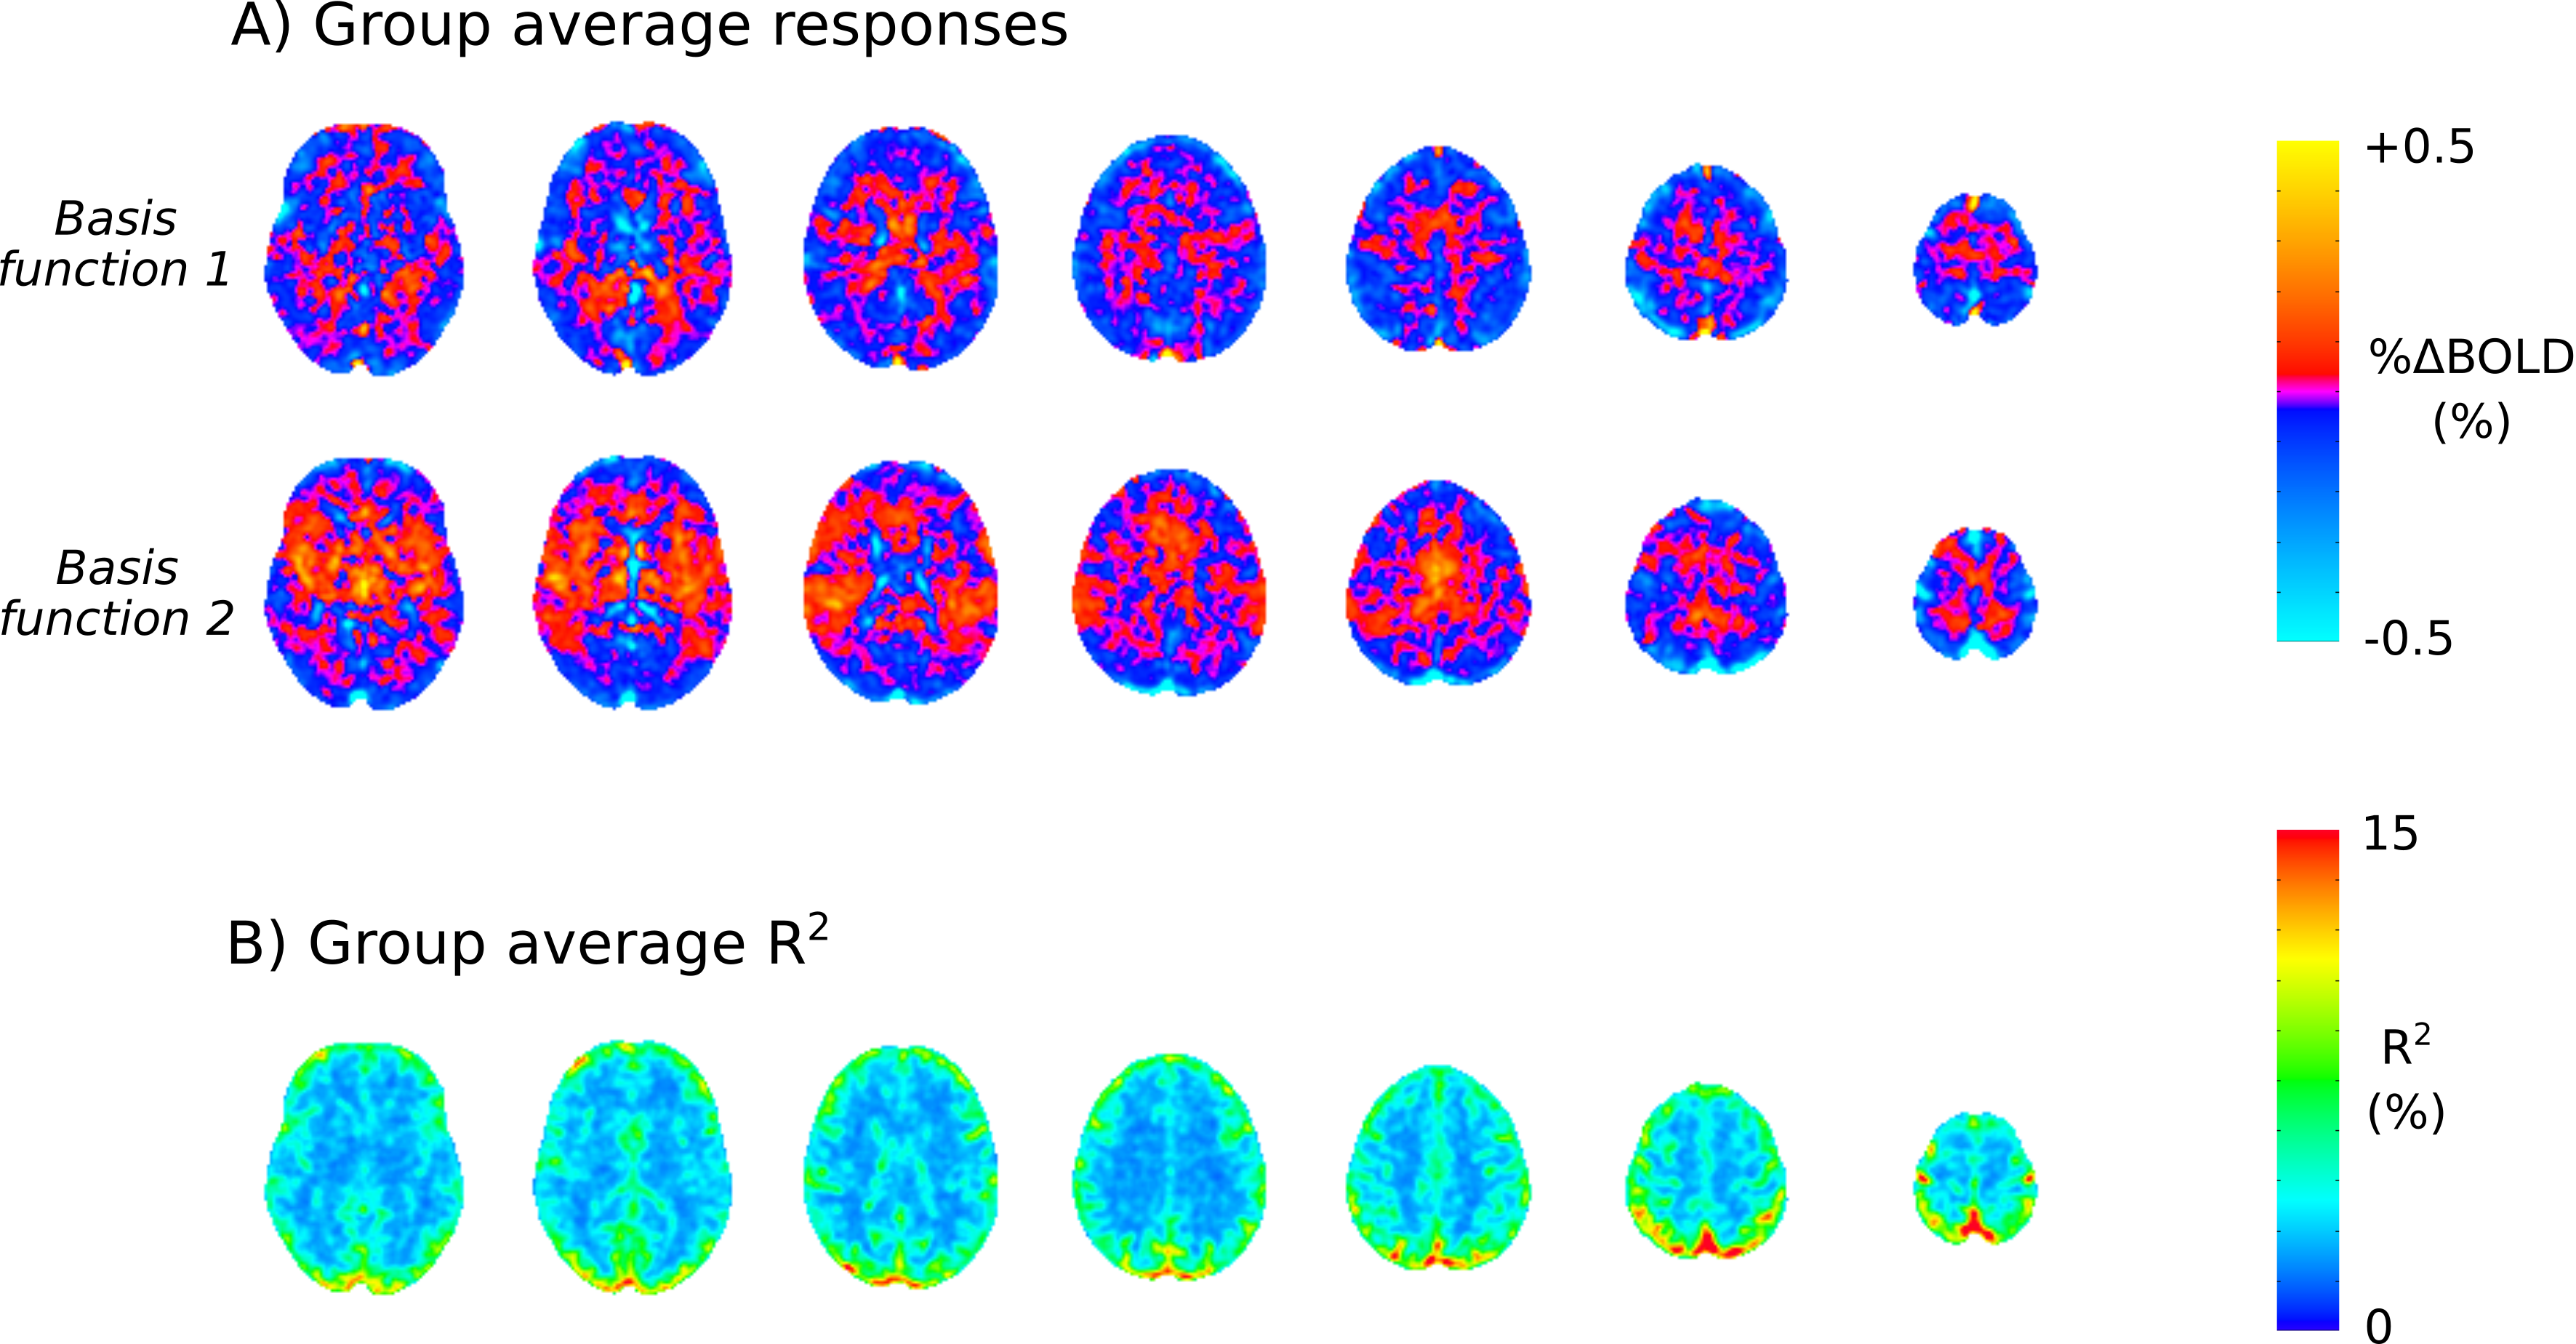
The group-level mean grey-matter (GM) response to the TCC is show in Fig. 1A. It is characterised by a transient drop in BOLD signal on the order of ~0.3%. Example time series from 3 cortical ROIs from subject 1 are shown in Fig. 1B, where a marked overshoot is visible. When viewing the ROI time-series for each ROI as an image (Fig. 1C) one can see there is good agreement in responses across the cortex within-subject, yet some between-subject variability in timing and shape of response. The fitted responses highlight a damped oscillatory nature of the IRF, which is more evident in some subjects.Group level voxel-wise basisinf fitted responses are shown in Fig. 3A. There is clear anatomical structure in these responses with visible GM/WM contrast, regional variability and “hot spots”, e.g. at the Superior Sagittal Sinus (SSS) where there is a large draining vein. The group averaged R2 of model fit shows strong GM/WM contrast and most variance is explained in the region of the SSS. Across subjects the whole brain average R2 value is 4.5±1.6 % and the peak R2 value is 59.2±12.3 %.
Discussion
This study characterises the BOLD fMRI TCC response in a group of young healthy subjects, and demonstrates that global event-locked responses can be robustly measured at the individual subject level. Furthermore, using the novel basisinf functions to model the TCC response, we demonstrate the feasibility of obtaining voxel-wise dCA estimates with fMRI. Factoring in between-subject variability, the basisinf set can fit varied TCC responses across the brain parsimoniously. Fig. 3A demonstrates this approach has enough sensitivity to resolve regional differences in response shape across the brain.These data are the first step in developing a robust approach to measuring dCA with fMRI. Further work is needed to inform on how best to extract summary measures that characterise the important features of the TCC response, e.g. magnitude of initial drop, rate of recovery, overshoot etc. However this study shows that TCC is a promising method for studying cerebrovascular function with fMRI.
Acknowledgements
We would like to thank Michalis Kassinopoulos (McGill University, Ca) for guidance on using Laguerre functions to form a basis set. This work was supported by the Wellcome Trust [WT200804]
References
1. Aaslid, R., et al., Cerebral autoregulation dynamics in humans. Stroke, 1989. 20(1): p. 45-52.
2. Mahony, P.J., et al., Assessment of the thigh cuff technique for measurement of dynamic cerebral autoregulation. Stroke, 2000. 31(2): p. 476-80.
3. Horsfield, M.A., et al., Regional differences in dynamic cerebral autoregulation in the healthy brain assessed by magnetic resonance imaging. PLoS One, 2013. 8(4): p. e62588.
4. Macey, P.M., et al., Global brain blood-oxygen level responses to autonomic challenges in obstructive sleep apnea. PLoS One, 2014. 9(8): p. e105261.
5. Panerai, R.B., et al., Dynamic cerebral autoregulation following acute ischaemic stroke: Comparison of transcranial Doppler and magnetic resonance imaging techniques. J Cereb Blood Flow Metab, 2016. 36(12): p. 2194-2202.
6. Saeed, N.P., et al., Measurement of cerebral blood flow responses to the thigh cuff maneuver: a comparison of TCD with a novel MRI method. J Cereb Blood Flow Metab, 2011. 31(5): p. 1302-10.
Figures