1113
Comparison of calibrated fMRI with calibration factor M determined by hypercapnia vs. gas-free R2'1School of Medicine, Department of Neuroradiology, Technical University of Munich, Munich, Germany, 2MRRC, Yale University, New Haven, CT, United States, 3School of Medicine, Department of Radiology, Technical University of Munich, Munich, Germany, 4Philips Healthcare, Hamburg, Germany, 5School of Medicine, Clinic of Neurology, Technical University of Munich, Munich, Germany
Synopsis
Calibrated-fMRI is highly promising to quantify human brain function via mapping changes of cerebral metabolic rate of oxygen. While the R2’-based approach is easily applicable, systematic differences to the well-established hypercapnia-calibration have been reported. We present data from an ongoing study in seven healthy young subjects correlating calibration factors M from R2' vs. hypercapnia. We hypothesized better correlation after methodological improvements in R2'-mapping and pseudo-continuous arterial spin labeling (pCASL). Our results confirmed this hypothesis, with good correlations between both fMRI-calibrations. However, we found potentially confounding hypercapnia effects on pCASL. Thus, our results suggest benefits of gas-free R2’-calibration for future applications.
Purpose
The blood oxygenation level dependent (BOLD) effect1,2 is widely used to map human brain function. Since the measured BOLD response to functional brain activation results from a complex interplay of increased oxygen consumption and blood supply,3-5 differences in BOLD signal changes cannot reliably be interpreted in terms of neuronal activity,6 especially in patients with vascular impairments7.To quantify changing cerebral metabolic rate of oxygen (CMRO2) as a proxy for neuronal activation,8,9 different calibration approaches have been developed.10,11 The most established hypercapnia-calibration relies on the Davis model12 and requires CBF and BOLD signal change measurements during a hypercapnia challenge. The resulting calibration factor M, i.e. maximum BOLD signal change, allows calculation of ∆CMRO2 changes in additionally acquired task-experiments. However, the required complicated gas setup limited wider applications.11 A more easily applicable and gas-free alternative is based on quantifying the susceptibility-related transverse relaxation rate R2’.13-17 However, systematic differences between hypercapnia- and R2’-calibration have been reported.10,18 While hypercapnia calibration may benefit from recently available pseudo-continuous arterial spin labeling (pCASL)19 with optimized timings,20 R2’-based calibration can benefit from 3D-GraSE T2-imaging21 and T2*-imaging with corrections for macroscopic background gradients and motion.22-24
The aim of our ongoing study was therefore, to compare calibration factors M obtained by hypercapnia- and R2’-calibration in healthy young subjects. We furthermore investigated potential influences of hypercapnia-related flow velocity increases on ASL labeling efficiency. We hypothesized that longer post label delays (PLD) in pCASL resolve previously confounding effects of commonly used short inversion delays.
Methods
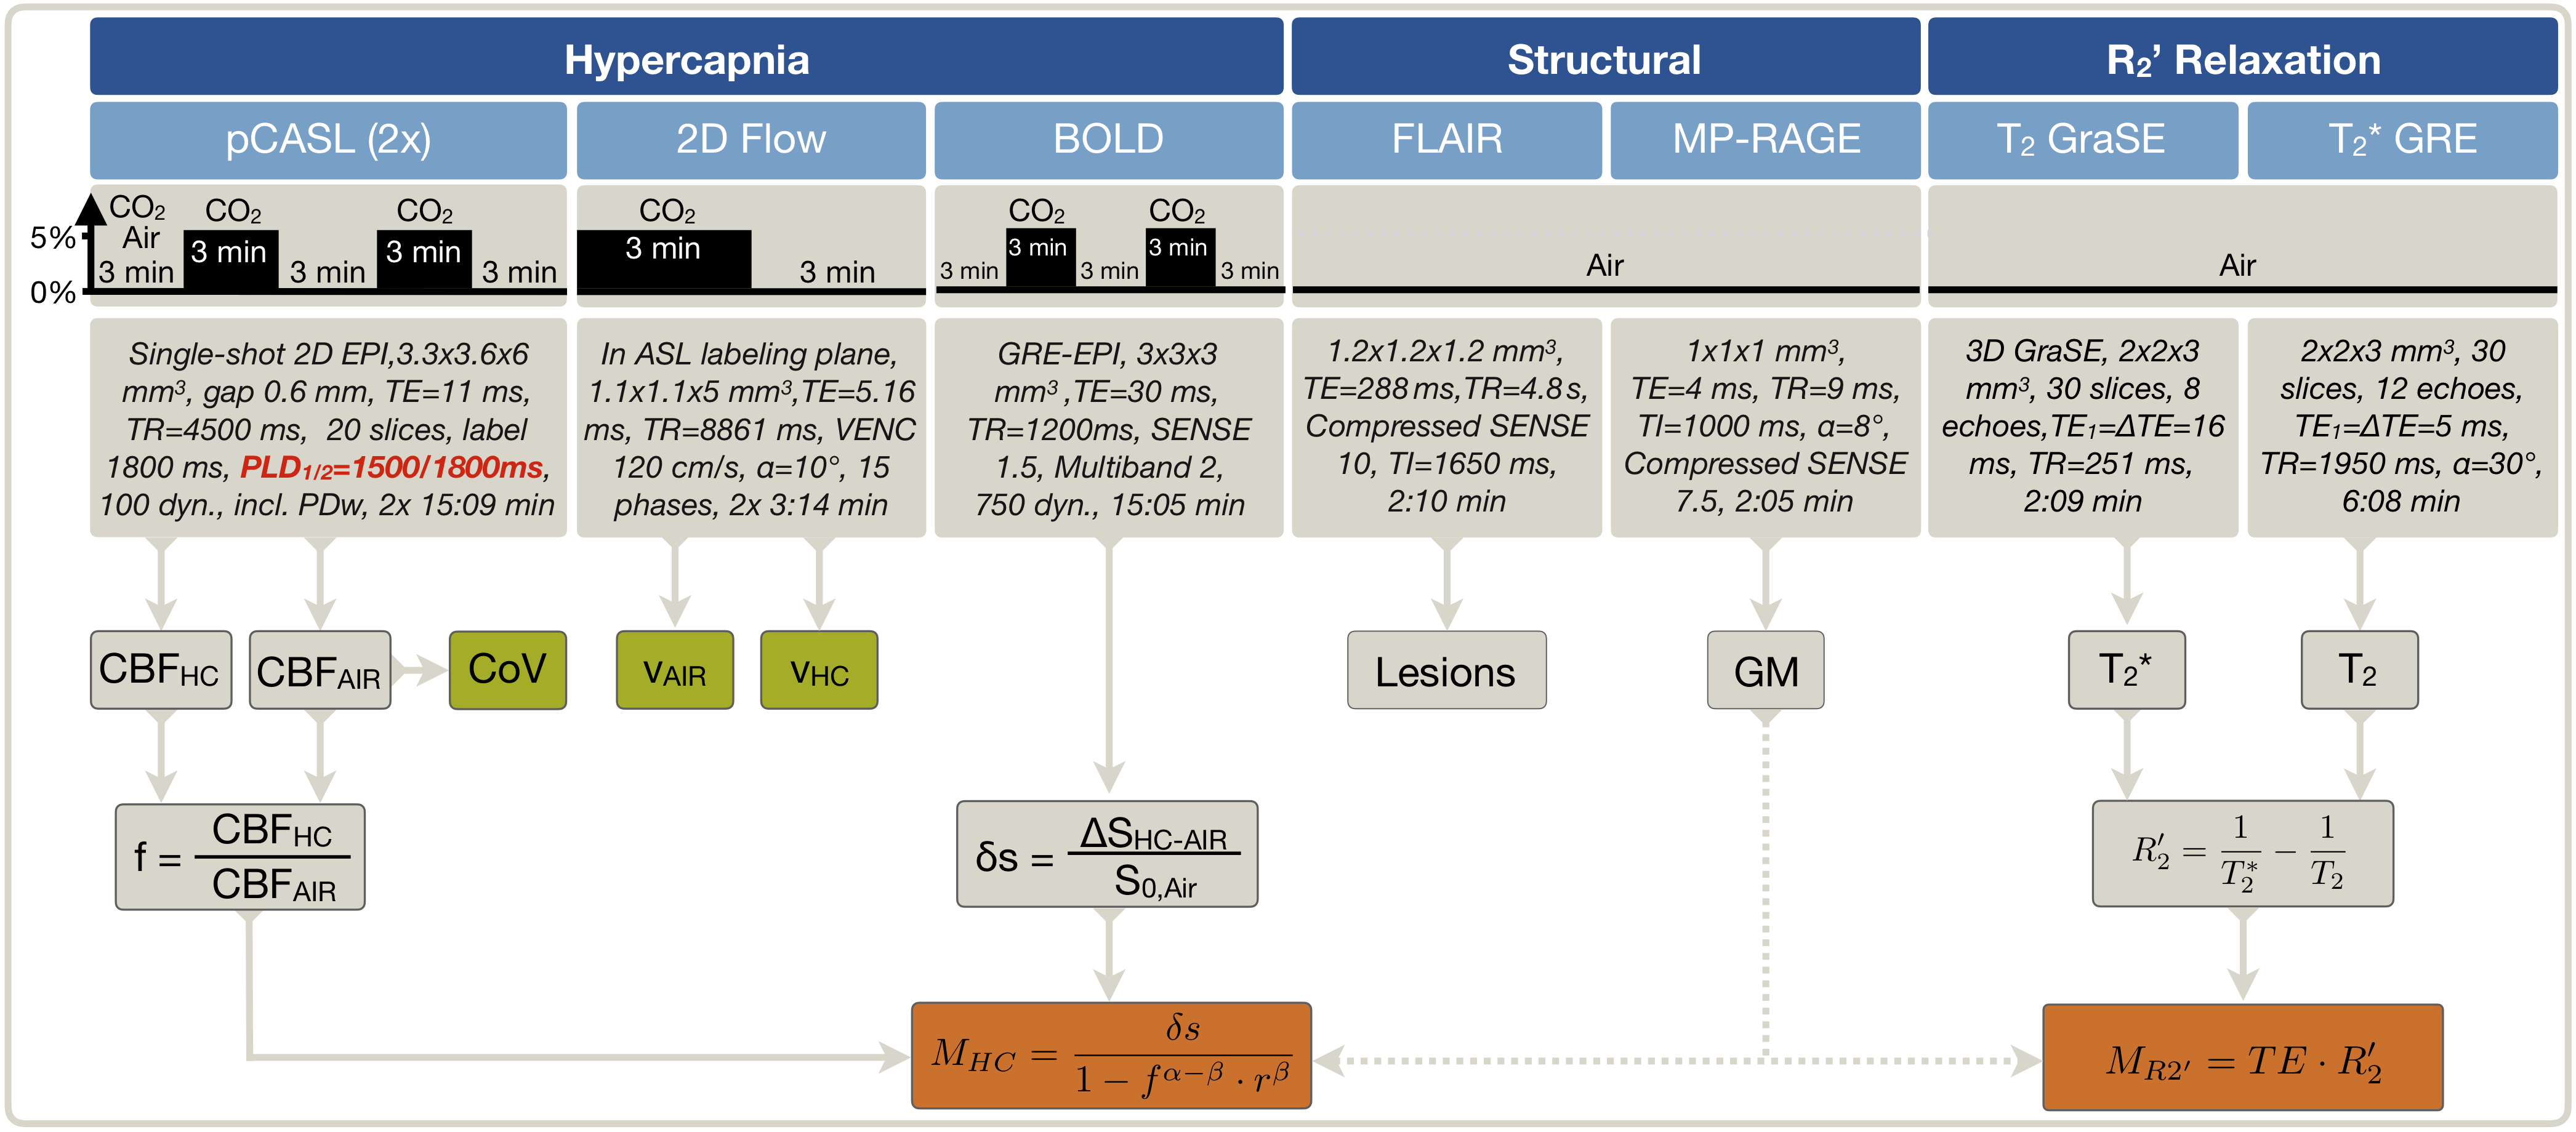
Seven healthy young participants (age=29.3±10.5y) underwent MRI on a 3T Philips Ingenia Elition (Philips Healthcare, Best, Netherlands) using a 32-channel head-coil. The imaging protocol and derived parameters are summarized in Figure 1. The respiratory setup consisted of an air-CO2 mixer (Altitrainer, SMTec, Switzerland), sealed face masks similar to the Hoge setup25 and a gas-analyzer facilitating end-tidal CO2 and O2 measurements (ML206, AD Instruments, USA). Medical air (21% O2) and hypercapnia (5% CO2) were applied in a 3-minute block-design for BOLD and pCASL (Fig.1). Two pCASL-sequences were compared with shorter PLD=1500 ms and longer PLD=1800 ms, the latter following latest recommendations19. Peak systolic arterial blood flow velocities in the labeling plane were measured during air and hypercapnia. Additionally, R2’ was imaged based on separate measurements of T2 and T2* (Fig.1).15 Processing was performed with Labchart (AD Instruments), custom Matlab programs and SPM1226.Potential arterial-transit-time delay artefacts of pCASL-CBF were quantified by spatial coefficient of variation (CoV) analysis.27 For M-factor comparisons, each subject’s values were calculated for hypercapnia-calibration by11 $$M_{HC}=\frac{\delta{s}}{1-f^{\alpha-\beta}r^{\beta}}\qquad[1]$$ with $$$\alpha=0.18,^{28}\,\beta=1.3$$$29 and $$$r=1$$$, assuming isometabolic CBF increases during CO2-application,10 and for R2'-calibration in baseline (air) by10,30$$M_{R_2’}=TE\cdot R_{2}^{'}\qquad[2]$$ with $$$TE=30\,ms$$$.
Results
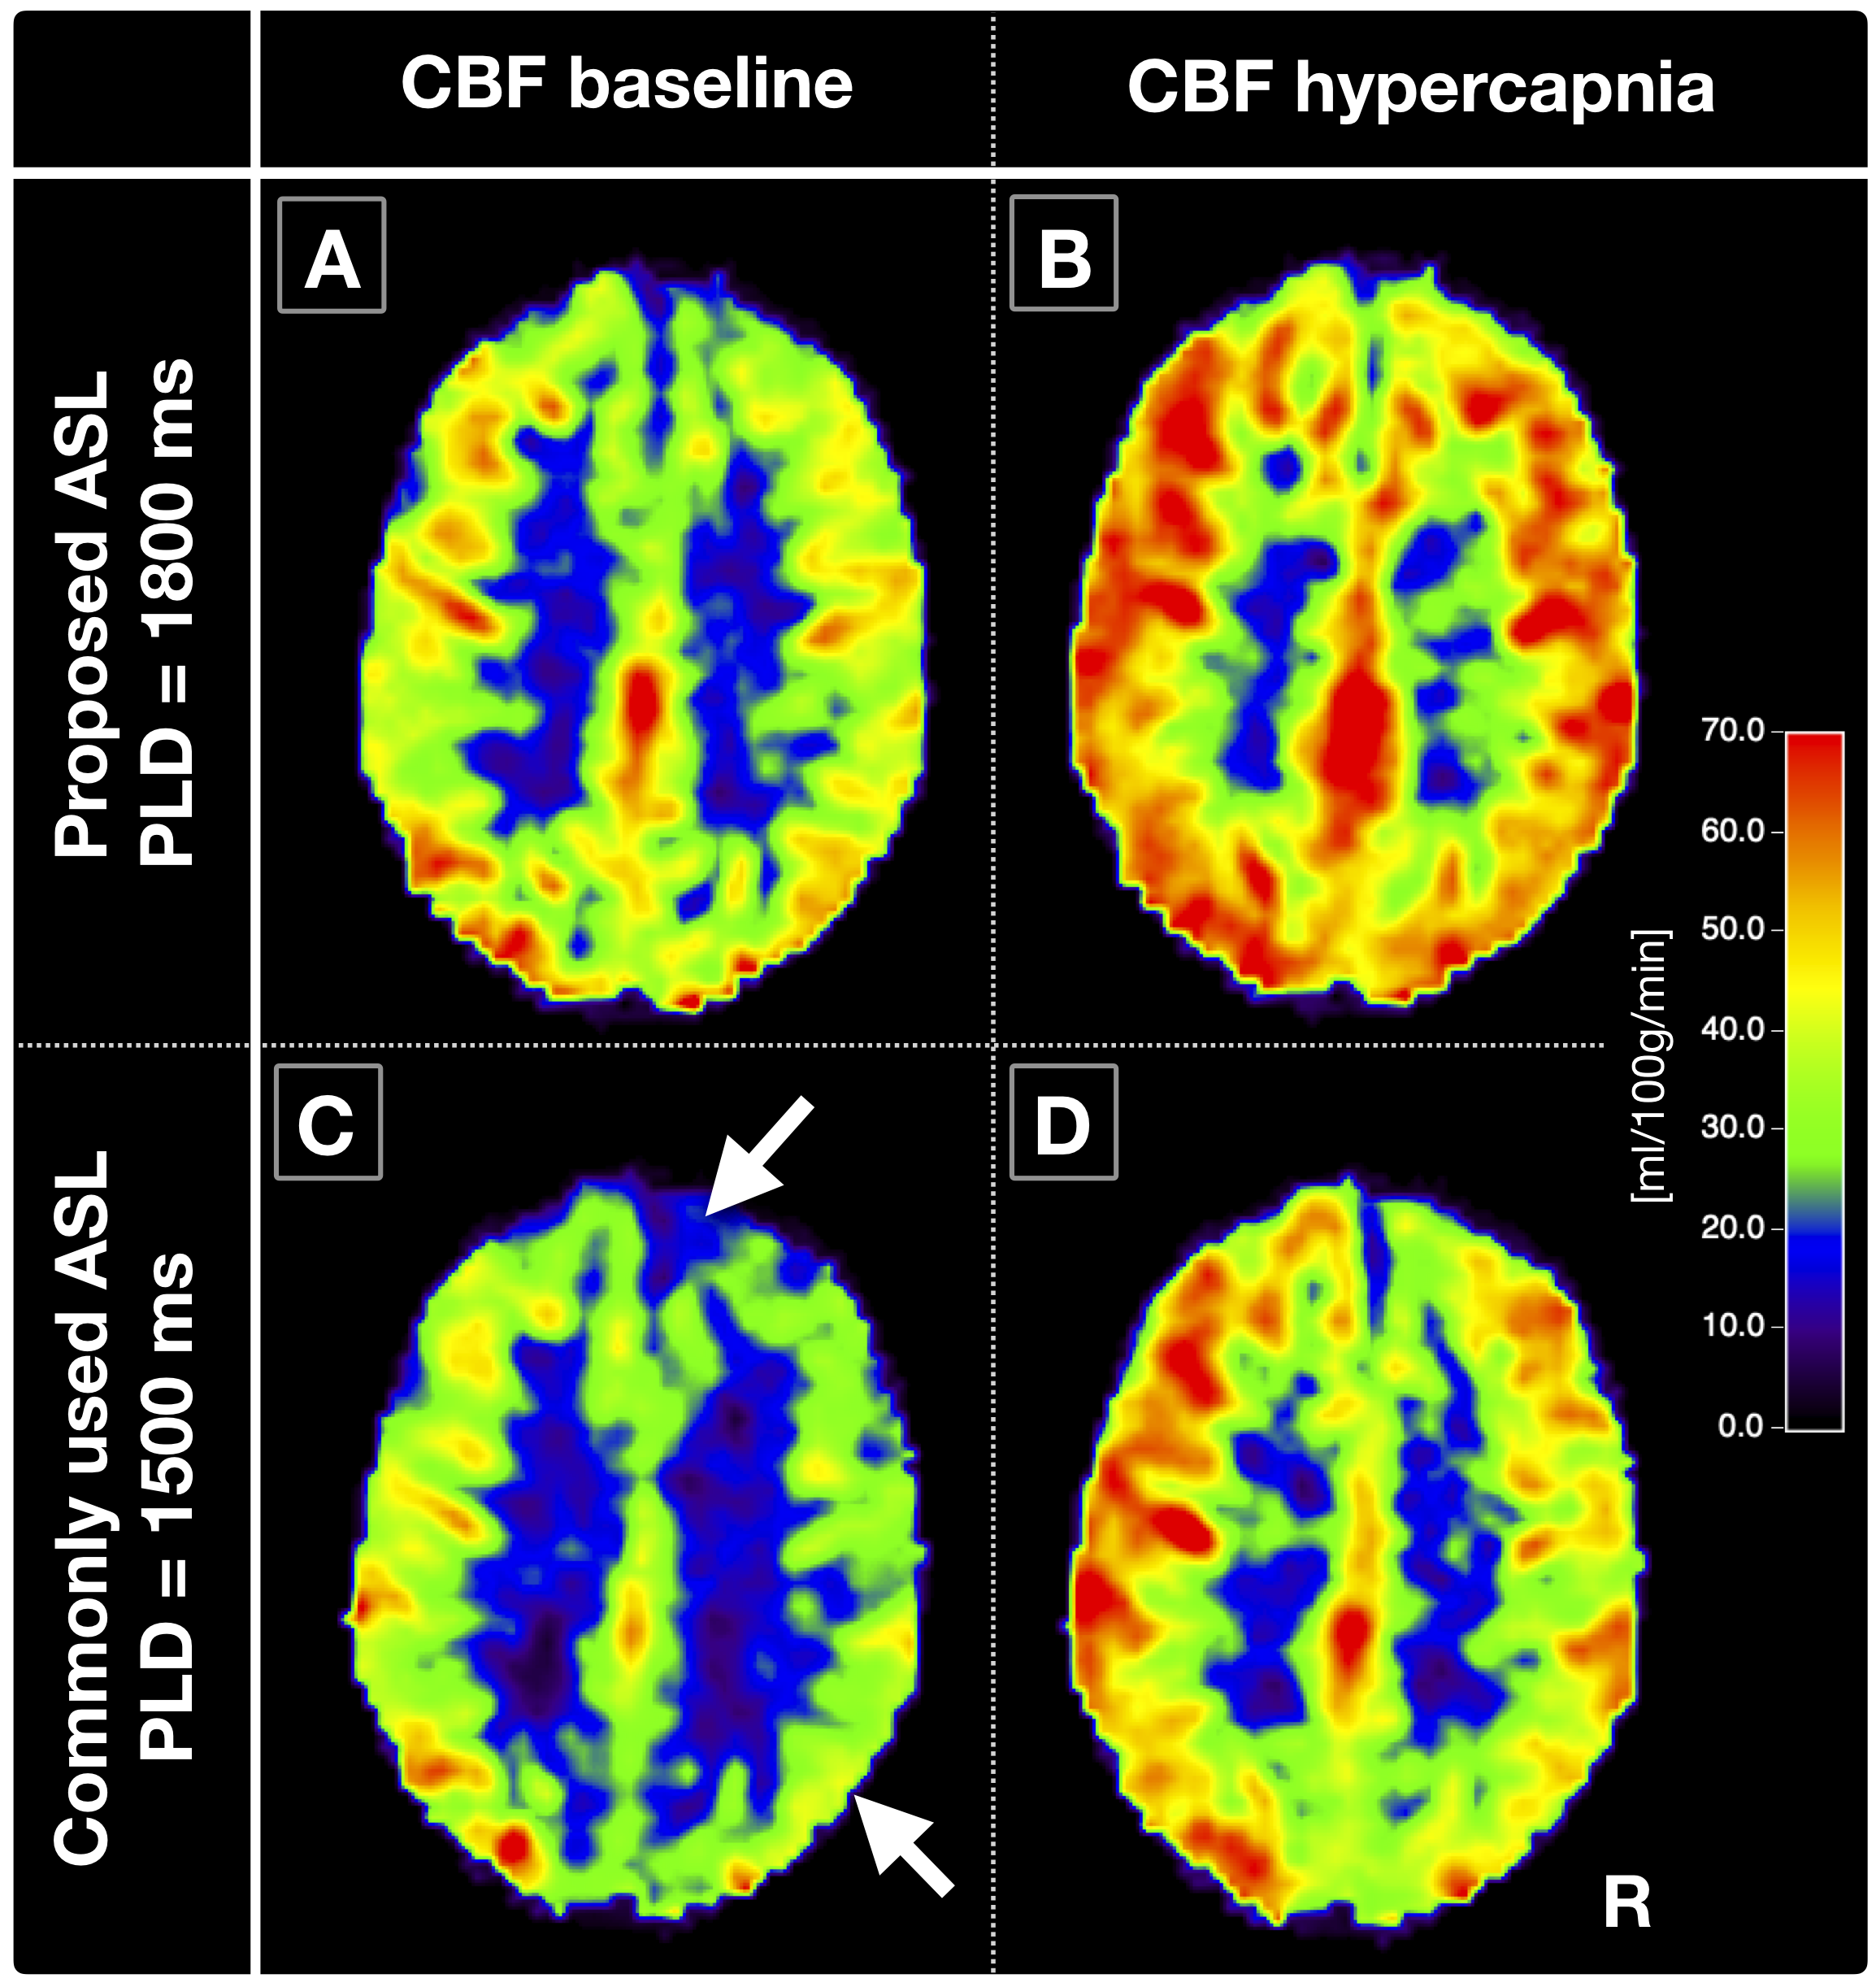
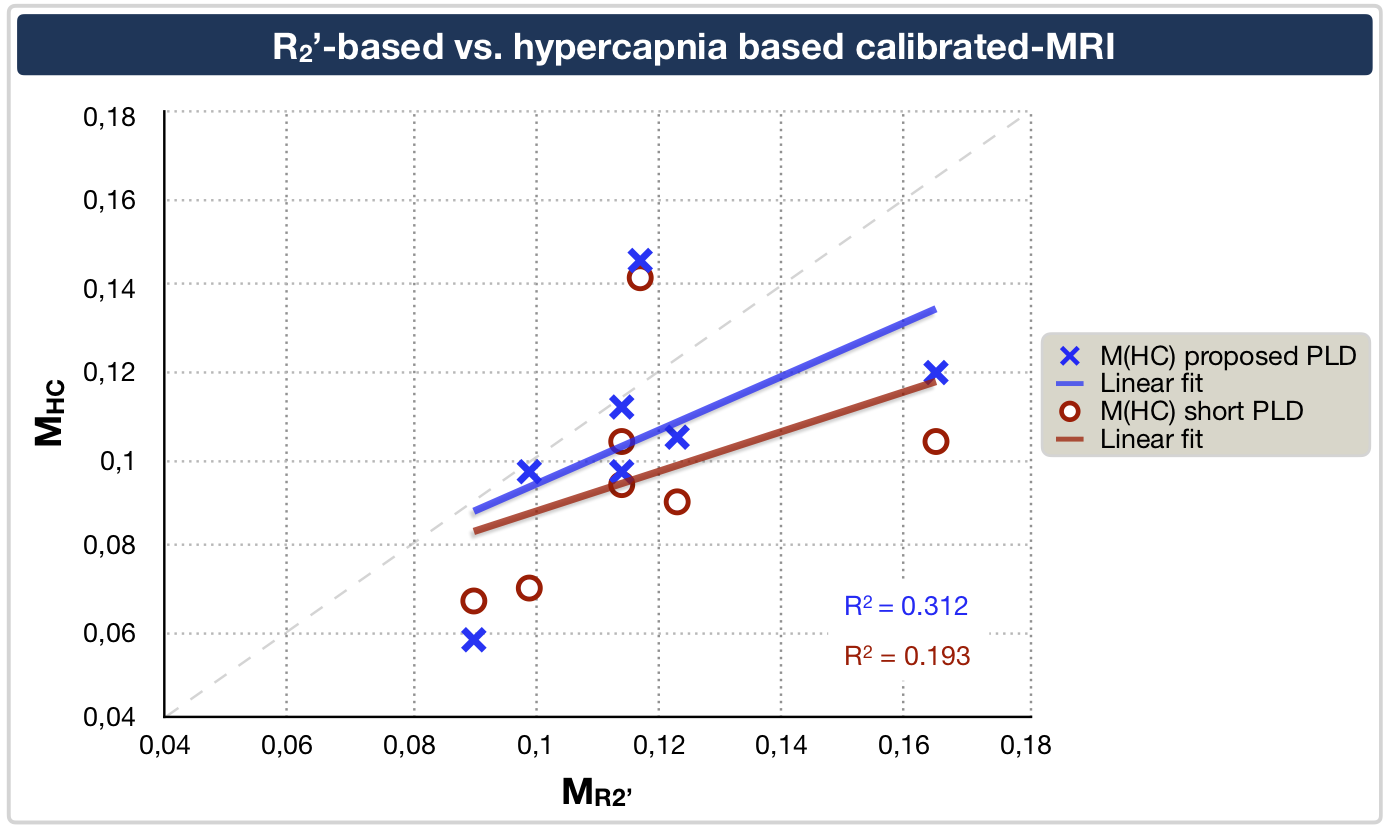
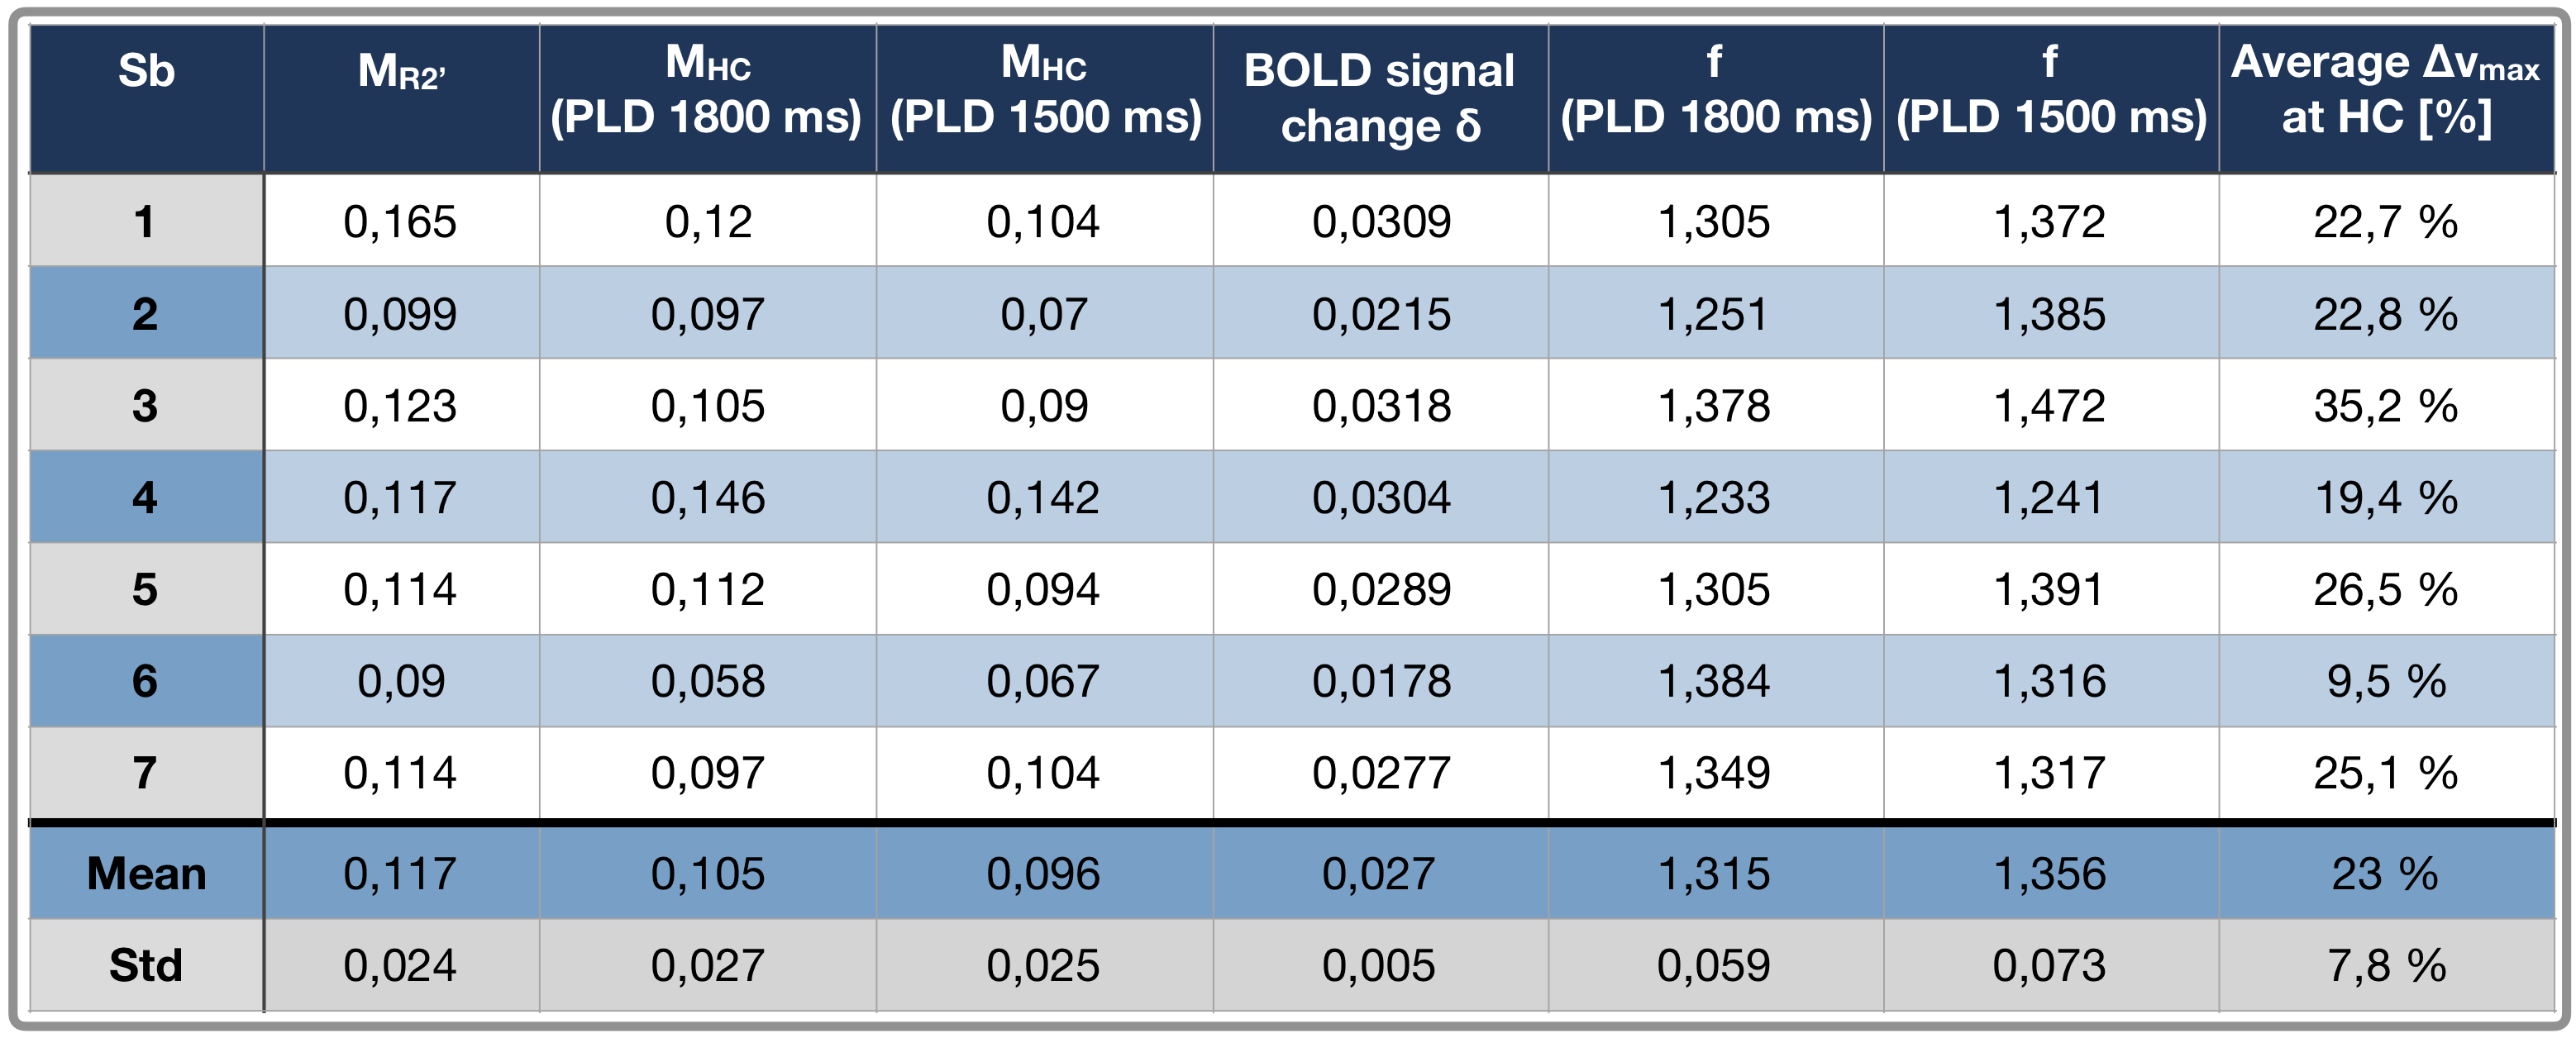
Exemplary CBF-maps are shown in Figure 2A,B. On group level, M-values obtained by hypercapnia- vs. R2’-calibration correlated reasonably well, with comparable means and standard deviations, MHC=0.105±0.024 vs. MR2’=0.117±0.024 (Tab.1), when using the proposed longer PLD (Fig.3, blue).The pCASL-sequence with shorter PLD revealed slightly higher CoV (CoV=34.0±5.6) and lower CBF-values compared to pCASL with longer PLD (CoV=28.7±2.4, Fig.2A-D). MHC with short PLD also correlated worse with MR2’ (Fig.3, red).
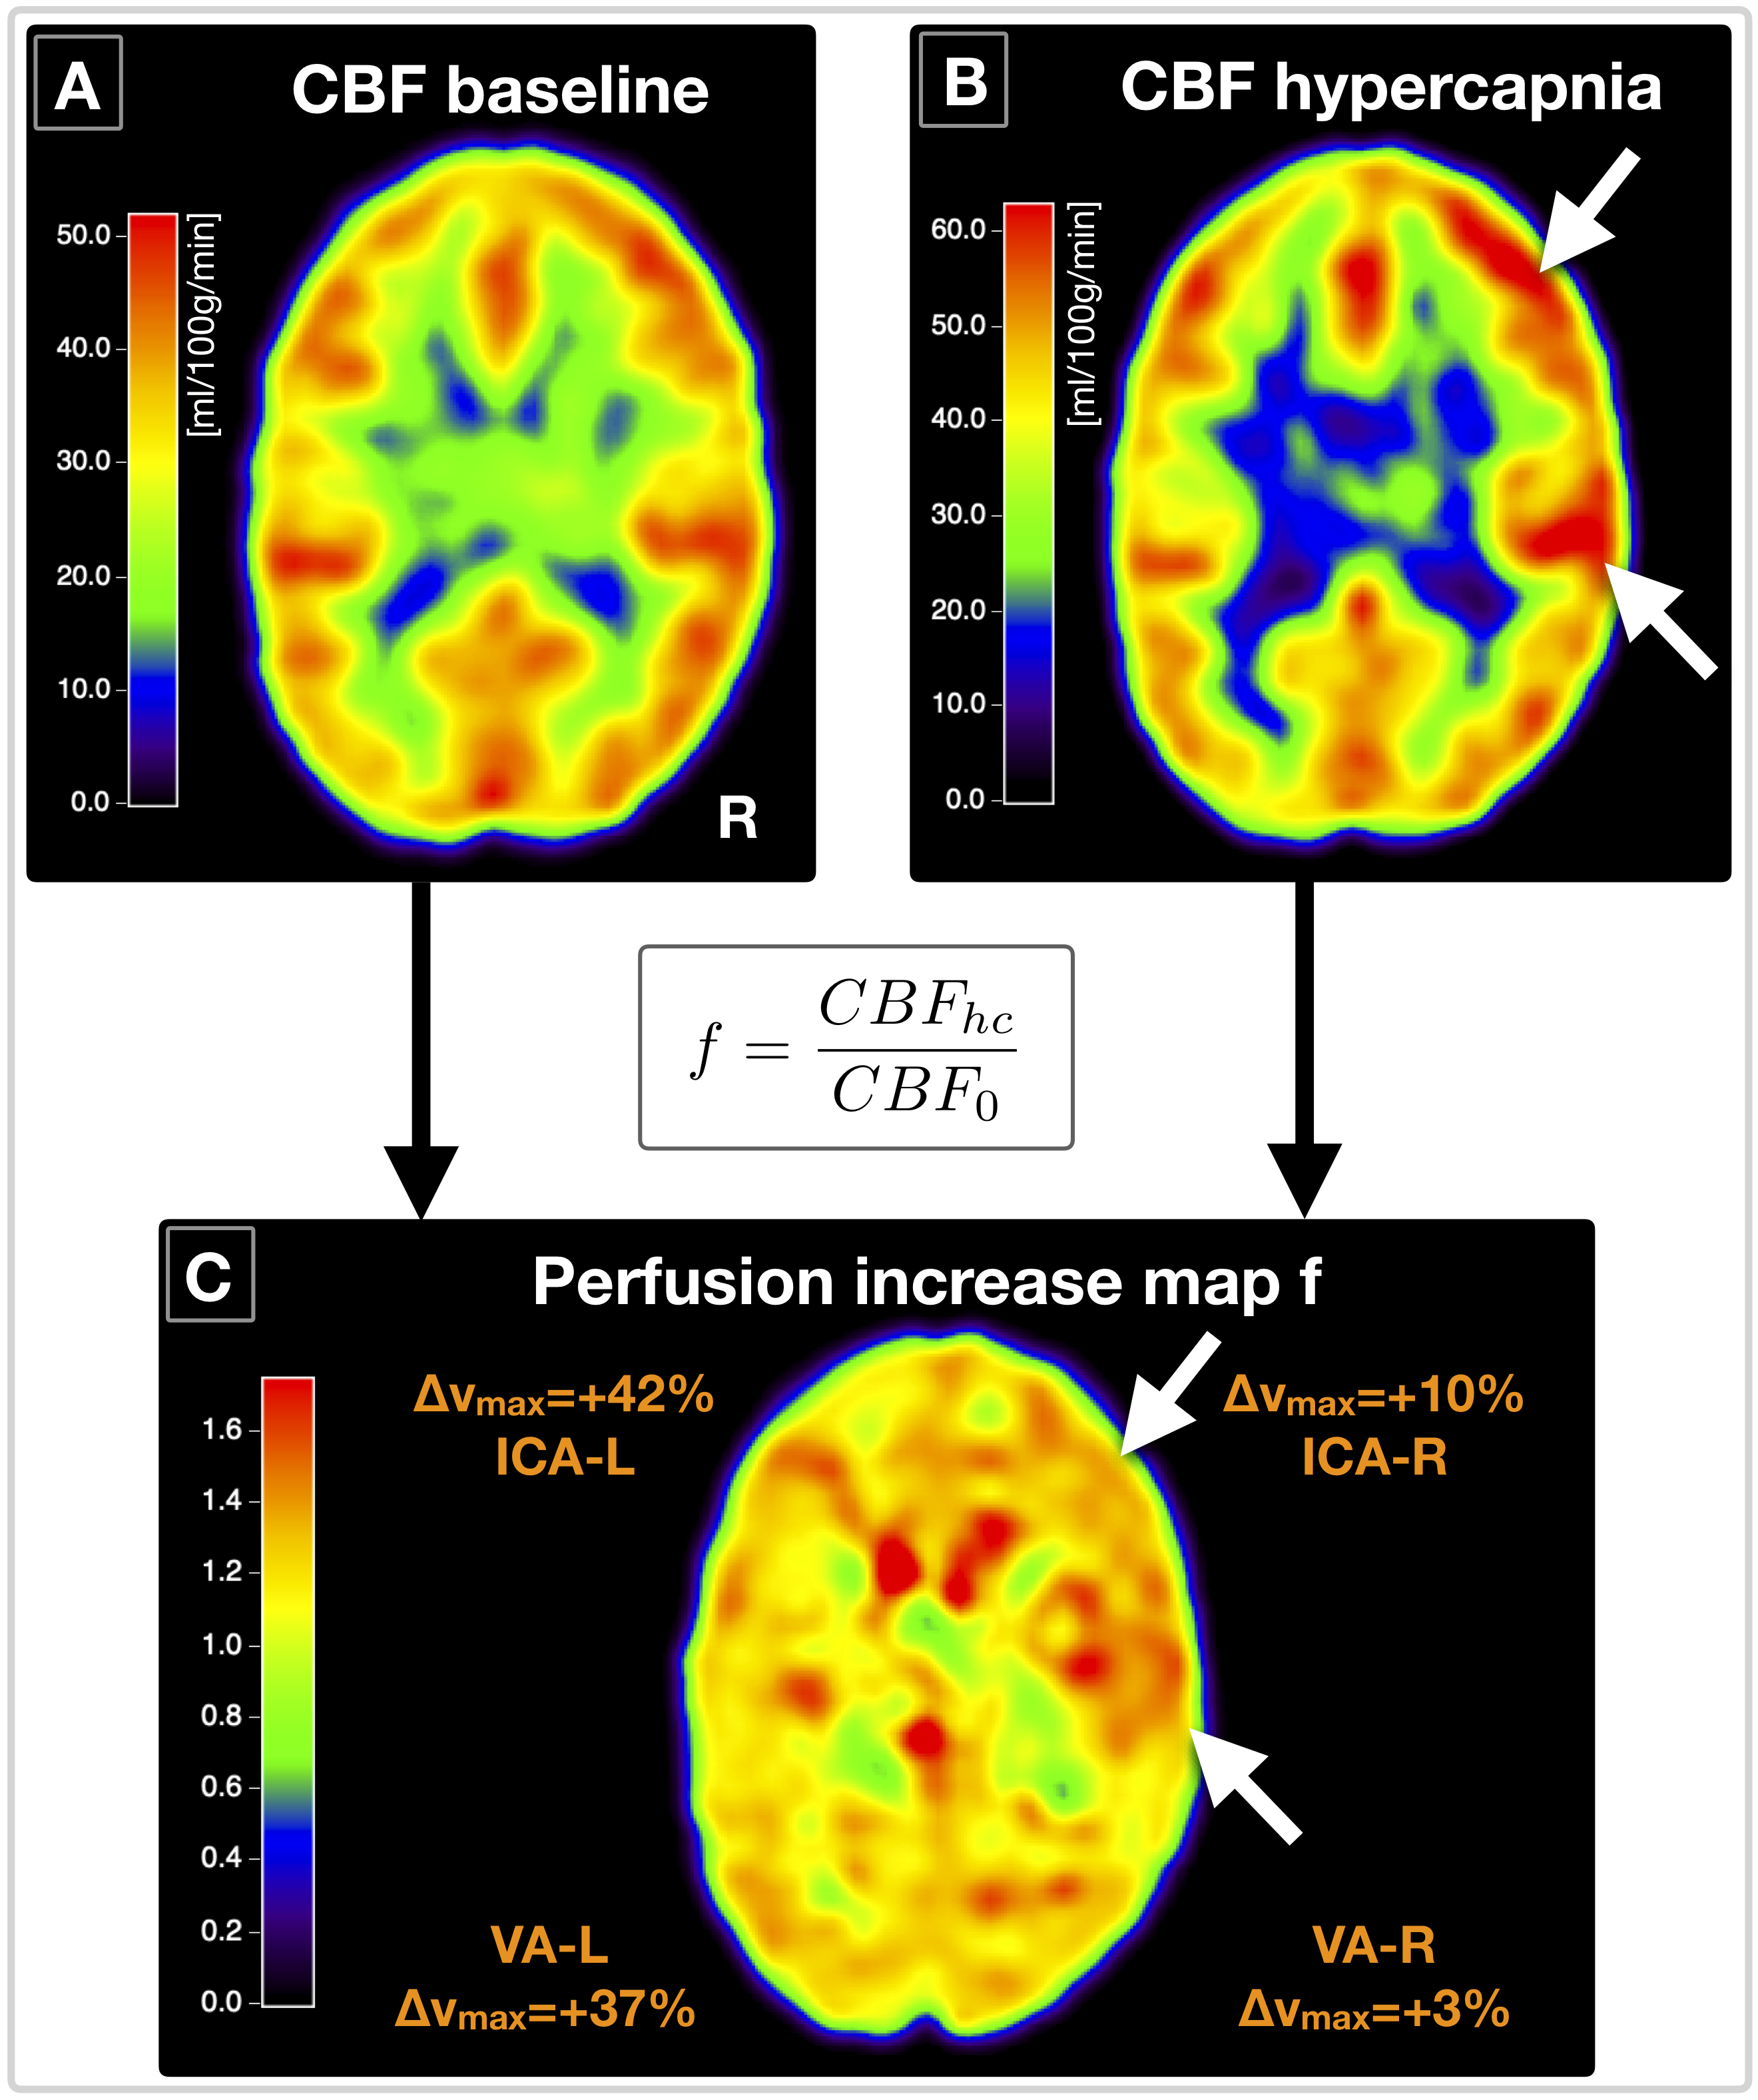
The velocity in the brain feeding arteries at hypercapnia vs. air increased on average by +22.7%. Flow velocities were higher in the ICAs (vmaxHC=48.7 cm/s) compared to VAs (vmaxHC=35.4 cm/s), and differed between left-sided (∆vmax=28.8%) and right-sided arteries (∆vmax=16.6%).
Discussion
Our results demonstrated good correlations of R2’- and hypercapnia-calibration after applying sequence optimizations, as hypothesized. R2’-mapping with separate acquisitions for T2, with optimized 3D-GraSE readout,21 and T2*, with macroscopic background gradient and motion corrections,22-24 seemed to improve the R2’-calibration reliability. The optimized pCASL-sequence with prolonged PLD showed excellent image quality. Signal changes with hypercapnia agreed very well with the literature.31 Minor residual deviations may be explained by separate acquisitions and different underlying model assumptions.10,16 Altogether, we found better accordance between MR2’ and MHC than previously presented.18Those differences could be related to ASL-sequence timings, potentially compromising previous calibrated-fMRI approach comparisons. Our results confirmed that short PLDs degrade CBF-value reliability from pCASL,19 also influencing MHC and deteriorating correlations to MR2’. Though CoV evaluations did not imply severe arterial-transit delay artefacts,27 the short PLD obviously corrupted the CBF-map quality (Fig.2).
Hypercapnia caused increased arterial blood flow velocities, as expected.32 Those velocity increases may influence CBF-values via velocity dependent pCASL labeling efficiency.33,34 A flow increase of 20% from v=50 cm/s is expected to decrease the labeling efficiency by ≈3%,33,34 resulting in ≈9% M overestimations (assuming δSBOLD=2.7%, Tab.1). Assuming 3% CBFHC underestimation in our data would improve MHC vs. MR2’ correlation to R2=0.35. Regarding single arteries, flow velocities in ICAs were higher compared to VAs, in accordance with literature.32 Interestingly, velocity increased higher in left-sided arteries, potentially related to anatomical differences, which may affect calibrated-fMRI (Fig.4).
Conclusion
We successfully compared R2’- vs. hypercapnia-calibration in healthy young subjects by applying optimized pCASL and R2’-mapping. M-values of both calibration approaches revealed similar results and correlated well with each other. The proposed pCASL-sequence with prolonged PLD showed excellent image quality and improved hypercapnia calibration - compared to common calibrated-fMRI protocols. However, even with optimized pCASL-PLD, flow dependent labeling efficiency can strongly affect hypercapnia-calibration. While further studies are required, our results indicate clear benefits of gas-free R2’-calibration, especially for future clinical fMRI-applications.Acknowledgements
We acknowledge support by the Friedrich-Ebert-Stiftung, Dr.-Ing. Leonhard-Lorenz-Stiftung (grant SK 971/19) and the German research Foundation (DFG, grant numbers PR 1039/6-1, SO 1336/4-1).References
1. Ogawa S, Tank DW, Menon R, et al. Intrinsic signal changes accompanying sensory stimulation: functional brain mapping with magnetic resonance imaging. Proc Natl Acad Sci U S A 1992;89:5951-5.
2. Kwong KK, Belliveau JW, Chesler DA, et al. Dynamic magnetic resonance imaging of human brain activity during primary sensory stimulation. Proc Natl Acad Sci U S A 1992;89:5675-9.
3. Pike GB. Quantitative functional MRI: Concepts, issues and future challenges. NeuroImage 2012;62:1234-40.
4. Fox PT, Raichle ME. Focal physiological uncoupling of cerebral blood flow and oxidative metabolism during somatosensory stimulation in human subjects. Proc Natl Acad Sci U S A 1986;83:1140-4.
5. Gagnon L, Sakadzic S, Lesage F, et al. Quantifying the microvascular origin of BOLD-fMRI from first principles with two-photon microscopy and an oxygen-sensitive nanoprobe. J Neurosci 2015;35:3663-75.
6. Bandettini PA. Neuronal or hemodynamic? Grappling with the functional MRI signal. Brain Connect 2014;4:487-98.
7. Gottler J, Preibisch C, Riederer I, et al. Reduced blood oxygenation level dependent connectivity is related to hypoperfusion in Alzheimer's disease. J Cereb Blood Flow Metab 2019;39:1314-25.
8. Hoge RD, Pike GB. Oxidative metabolism and the detection of neuronal activation via imaging. J Chem Neuroanat 2001;22:43-52.
9. Herman P, Sanganahalli BG, Blumenfeld H, Rothman DL, Hyder F. Quantitative basis for neuroimaging of cortical laminae with calibrated functional MRI. Proc Natl Acad Sci U S A 2013;110:15115-20.
10. Blockley NP, Griffeth VEM, Simon AB, Buxton RB. A review of calibrated blood oxygenation level-dependent (BOLD) methods for the measurement of task-induced changes in brain oxygen metabolism. NMR in biomedicine 2013;26:987-1003.
11. Blockley NP, Griffeth VEM, Buxton RB. A general analysis of calibrated BOLD methodology for measuring CMRO(2) responses: comparison of a new approach with existing methods. Neuroimage 2012;60:279-89.
12. Davis TL, Kwong KK, Weisskoff RM, Rosen BR. Calibrated functional MRI: Mapping the dynamics of oxidative metabolism. Proceedings of the National Academy of Sciences of the United States of America 1998;95:1834-9.
13. Yablonskiy DA, Haacke EM. Theory of NMR signal behavior in magnetically inhomogeneous tissues: The static dephasing regime. Magnetic Resonance in Medicine 1994;32:749-63.
14. Christen T, Bolar DS, Zaharchuk G. Imaging Brain Oxygenation with MRI Using Blood Oxygenation Approaches: Methods, Validation, and Clinical Applications. American Journal of Neuroradiology 2013;34:1113-23.
15. Hirsch NM, Toth V, Forschler A, Kooijman H, Zimmer C, Preibisch C. Technical considerations on the validity of blood oxygenation level-dependent-based MR assessment of vascular deoxygenation. NMR Biomed 2014;27:853-62.
16. Shu CY, Herman P, Coman D, et al. Brain region and activity-dependent properties of M for calibrated fMRI. Neuroimage 2016;125:848-56.
17. Kida I, Kennan RP, Rothman DL, Behar KL, Hyder F. High-Resolution CMRO2 Mapping in Rat Cortex: A Multiparametric Approach to Calibration of BOLD Image Contrast at 7 Tesla. Journal of Cerebral Blood Flow & Metabolism 2000;20:847-60.
18. Liu EY, Guo J, Simon AB, Haist F, Dubowitz DJ, Buxton RB. The potential for gas-free measurements of absolute oxygen metabolism during both baseline and activation states in the human brain. Proceedings of the 26th Annual Meeting of ISMRM; 2018; Paris, France.
19. Alsop DC, Detre JA, Golay X, et al. Recommended implementation of arterial spin-labeled perfusion MRI for clinical applications: A consensus of the ISMRM perfusion study group and the European consortium for ASL in dementia. Magnetic Resonance in Medicine 2015;73:102-16.
20. Fan AP, Jahanian H, Holdsworth SJ, Zaharchuk G. Comparison of cerebral blood flow measurement with [15O]-water positron emission tomography and arterial spin labeling magnetic resonance imaging: A systematic review. J Cereb Blood Flow Metab 2016;36:842-61.
21. Kaczmarz S, Goettler J, Hock A, et al. Reducing T2-related bias in mq-BOLD derived maps of Oxygen Extraction Fraction by 3D acquisition. Proc Intl Soc Mag Reson Med 26; 2018; Paris, France.
22. Hirsch NM, Preibisch C. T2* mapping with background gradient correction using different excitation pulse shapes. AJNR Am J Neuroradiol 2013;34:E65-8.
23. Baudrexel S, Volz S, Preibisch C, et al. Rapid single-scan T 2*-mapping using exponential excitation pulses and image-based correction for linear background gradients. Magnetic Resonance in Medicine 2009;62:263-8.
24. Noth U, Volz S, Hattingen E, Deichmann R. An improved method for retrospective motion correction in quantitative T2* mapping. Neuroimage 2014;92:106-19.
25. Tancredi FB, Lajoie I, Hoge RD. A simple breathing circuit allowing precise control of inspiratory gases for experimental respiratory manipulations. BMC Res Notes 2014;7:235.
26. SPM. Statistical Parametric Mapping software (SPM12) Version 6225: www.fil.ion.ucl.ac.uk/spm.
27. Mutsaerts HJ, Petr J, Vaclavu L, et al. The spatial coefficient of variation in arterial spin labeling cerebral blood flow images. J Cereb Blood Flow Metab 2017;37:3184-92.
28. Chen JJ, Pike GB. MRI measurement of the BOLD-specific flow-volume relationship during hypercapnia and hypocapnia in humans. Neuroimage 2010;53:383-91.
29. Mark CI, Fisher JA, Pike GB. Improved fMRI calibration: precisely controlled hyperoxic versus hypercapnic stimuli. Neuroimage 2011;54:1102-11.
30. Buxton RB, Wong EC, Frank LR. Dynamics of blood flow and oxygenation changes during brain activation: the balloon model. Magn Reson Med 1998;39:855-64.
31. Gauthier CJ, Hoge RD. A generalized procedure for calibrated MRI incorporating hyperoxia and hypercapnia. Hum Brain Mapp 2013;34:1053-69.
32. Sato K, Sadamoto T, Hirasawa A, et al. Differential blood flow responses to CO(2) in human internal and external carotid and vertebral arteries. J Physiol 2012;590:3277-90.
33. Gevers S, Bokkers RP, Hendrikse J, et al. Robustness and reproducibility of flow territories defined by planning-free vessel-encoded pseudocontinuous arterial spin-labeling. AJNR Am J Neuroradiol 2012;33:E21-5.
34. Verbree J, van Osch MJP. Influence of the cardiac cycle on pCASL: cardiac triggering of the end-of-labeling. MAGMA 2018;31:223-33.
Figures