1112
Short breathing tasks at the start of a resting state scan: feasible measures of cerebrovascular reactivity1Northwestern University, Chicago, IL, United States
Synopsis
Cerebrovascular reactivity (CVR), the blood flow response to a vasodilatory stimulus, is changed in many pathologies. CVR can be estimated without gas challenges by performing breathing tasks or by analyzing natural CO2 fluctuations at rest. We added two short breathing tasks (hypercapnic: breath hold, hypocapnia: cued deep breathing) to the start of two resting state fMRI scans. When using all the data, or just the breathing segments, adequate CVR maps could be estimated; this was not the case when just using the resting portions. This paradigm can provide an estimate of CVR, and help improve analysis of resting state data.
Introduction
Cerebrovascular reactivity (CVR) is the vascular response to a vasodilatory stimulus. fMRI measures of CVR are becoming accepted as a useful clinical marker with applications in healthy aging and pathology1,2,3. Many fMRI CVR studies use breathing challenges to modulate CO2 levels, inducing a vasodilatory response. A simpler approach may be to use natural fluctuations in CO2 levels that occur during normal variations in breathing patterns during resting state fMRI (rs-fMRI) to characterize CVR. However, this rs-fMRI CVR mapping has had mixed success4,5,6, and remains to be fully adopted. In fMRI studies of neural activity, these resting fluctuations in CO2 levels are a major physiologic confound. It is important to remove these effects, via nuisance regression, particularly in rs-fMRI data where functional connectivity may be confounded by CO2 fluctuations7,8,9.Here, we combine these two priorities – characterizing CVR and denoising rs-fMRI data – and propose a feasible addition to a typical rs-fMRI scan: 2-3 minutes of a breathing task at the start of a rs-fMRI scan. We hypothesize that this simple addition can give more robust estimates of CVR. We compare two scans: one with breath-hold (BH) challenges preceding rs-fMRI, and one with cued deep breathing tasks (CDB)10,11 preceding. By measuring the end-tidal CO2 (PETCO2) we can produce semi-quantitative maps of CVR both from the hypercapnic stimuli (BH) and the hypocapnic stimuli (CDB).
Methods
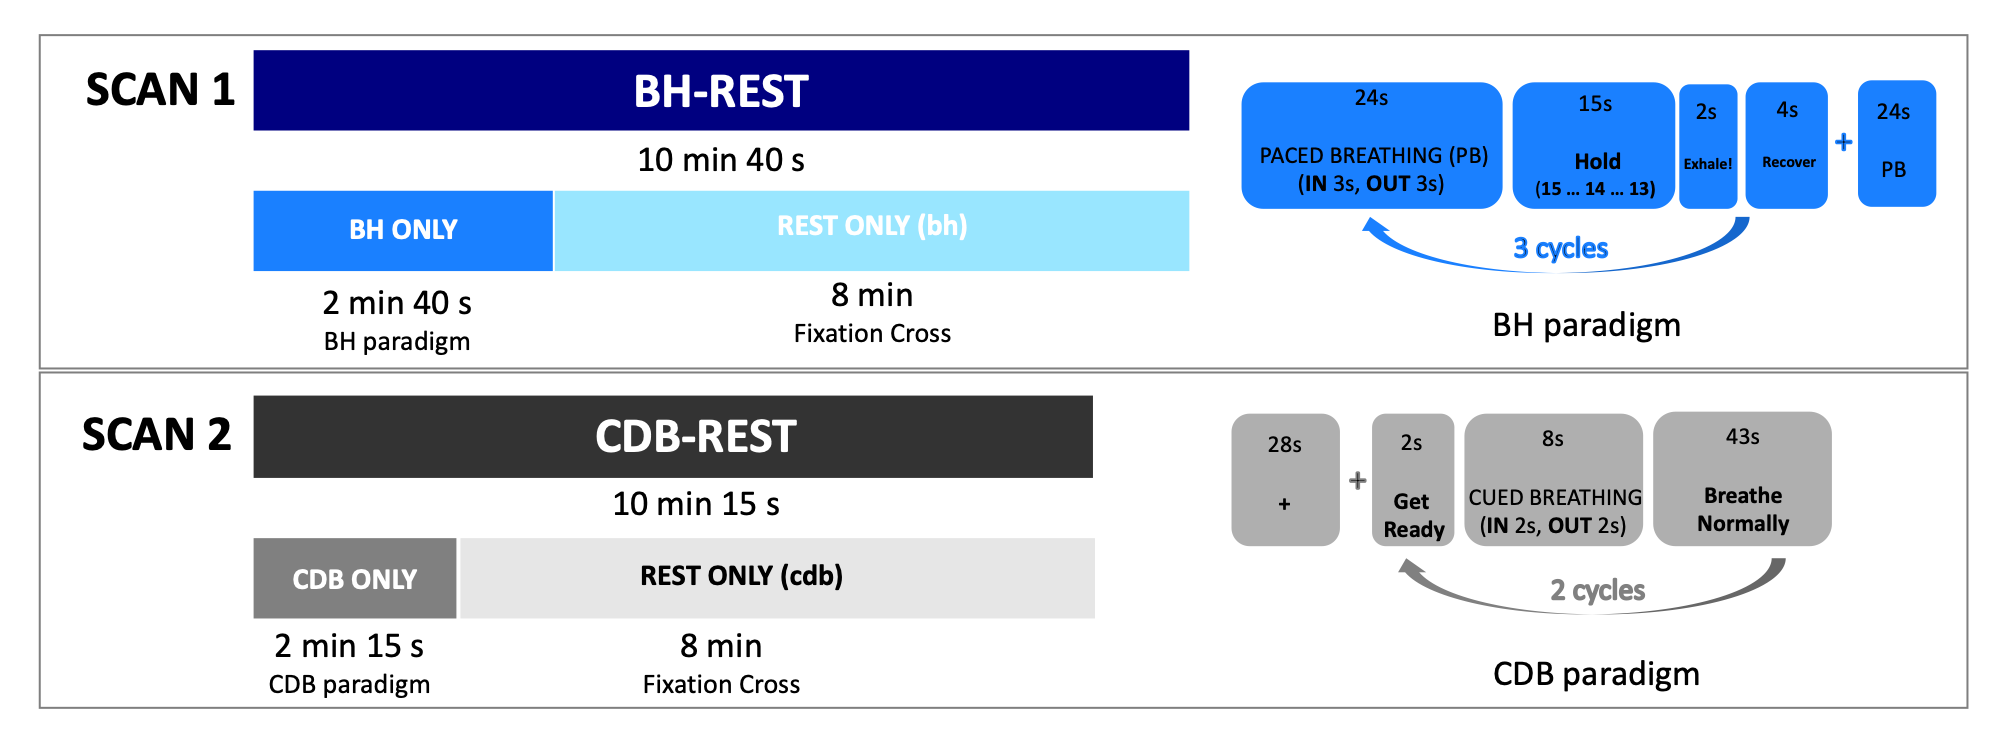
Data Collection: Numbers in the text are Mean±SD, unless otherwise stated. 10 healthy subjects were recruited (6 Female; 26.20±3.82 years). Subjects practiced the tasks before the scan. Figure 1 explains the BH and CDB visual instructions displayed during scanning, as well as how data from each scan is segmented and visualized throughout this abstract. The data was acquired on a Siemens 3T Prisma MRI system with a 64-channel head coil. The fMRI scans were gradient-echo EPI with T2* weighting: TR/TE=1200/34ms; FA=63; 2mm isotropic; 60 slices; multi-band acceleration factor=4. A T1-weighted scan was acquired for registration and tissue segmentation. The order of the functional scans was counterbalanced across subjects. Expired CO2 levels were sampled with a nasal cannula at 1000Hz, using an ADInstruments Gas Analyzer and Power Lab.Data Analysis: fMRI scans were volume registered to the single-band reference (SBRef) image of the functional middle scan, and brain extracted (AFNI, FSL). The T1-weighted image was segmented (FAST, FSL) and the gray matter (GM) mask was co-registered to functional space (FLIRT, FSL). In MATLAB, PETCO2 values were extracted, convolved with a canonical HRF, and down-sampled to match the fMRI acquisitions. The temporal shift between this PETCO2 regressor and the average GM timeseries was calculated using cross-correlation. Multiple linear regression was performed separately for BH-REST, CDB-REST, BH ONLY, CDB ONLY, REST ONLY (bh) and REST ONLY (cdb) segments of the scans. The model consisted of mean, drift terms, 6 demeaned motion parameters, and the demeaned PETCO2 time-series. The beta-weight calculated for the PETCO2 regressor, when divided by the beta-weight for the mean, reflects CVR in units of %BOLD signal change per change in PETCO2 (in mmHg). Significant voxels were identified by the t-statistic for fit of the PETCO2 regressor, thresholded at p<0.05 and FDR corrected. This thresholding takes in account there are different degrees-of-freedom for each data segment. The number of significant voxels, the mean and standard deviation of CVR was extracted across the GM, and compared across segments of data.
Results
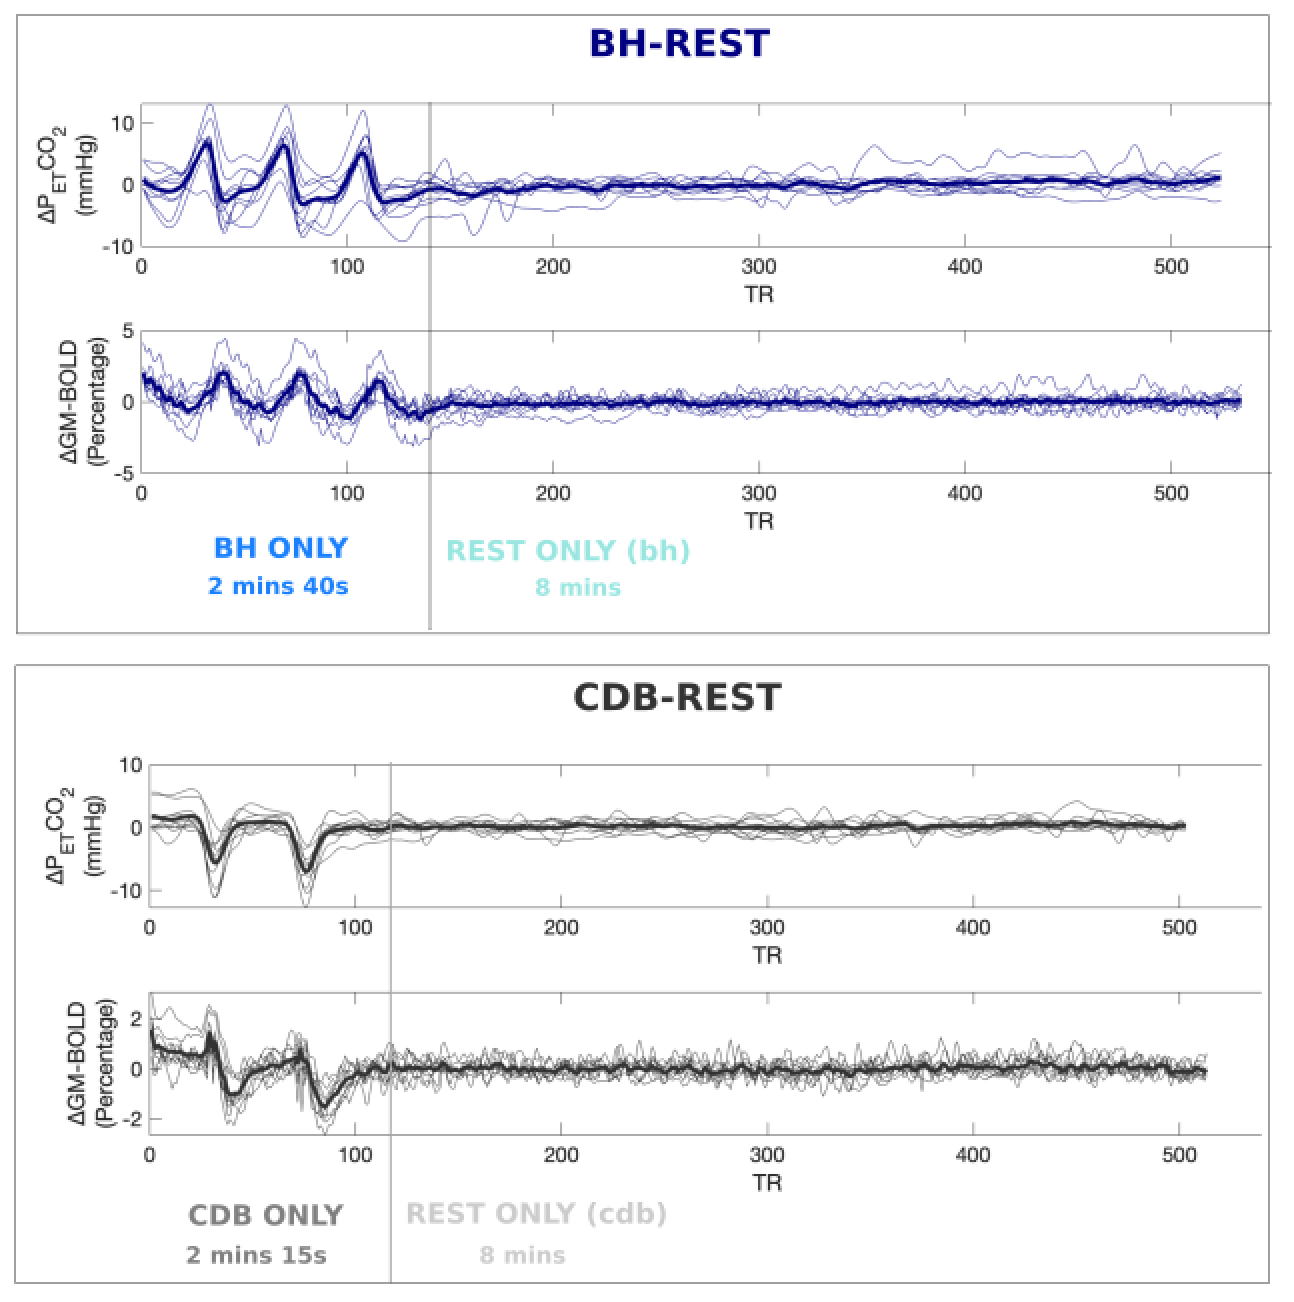
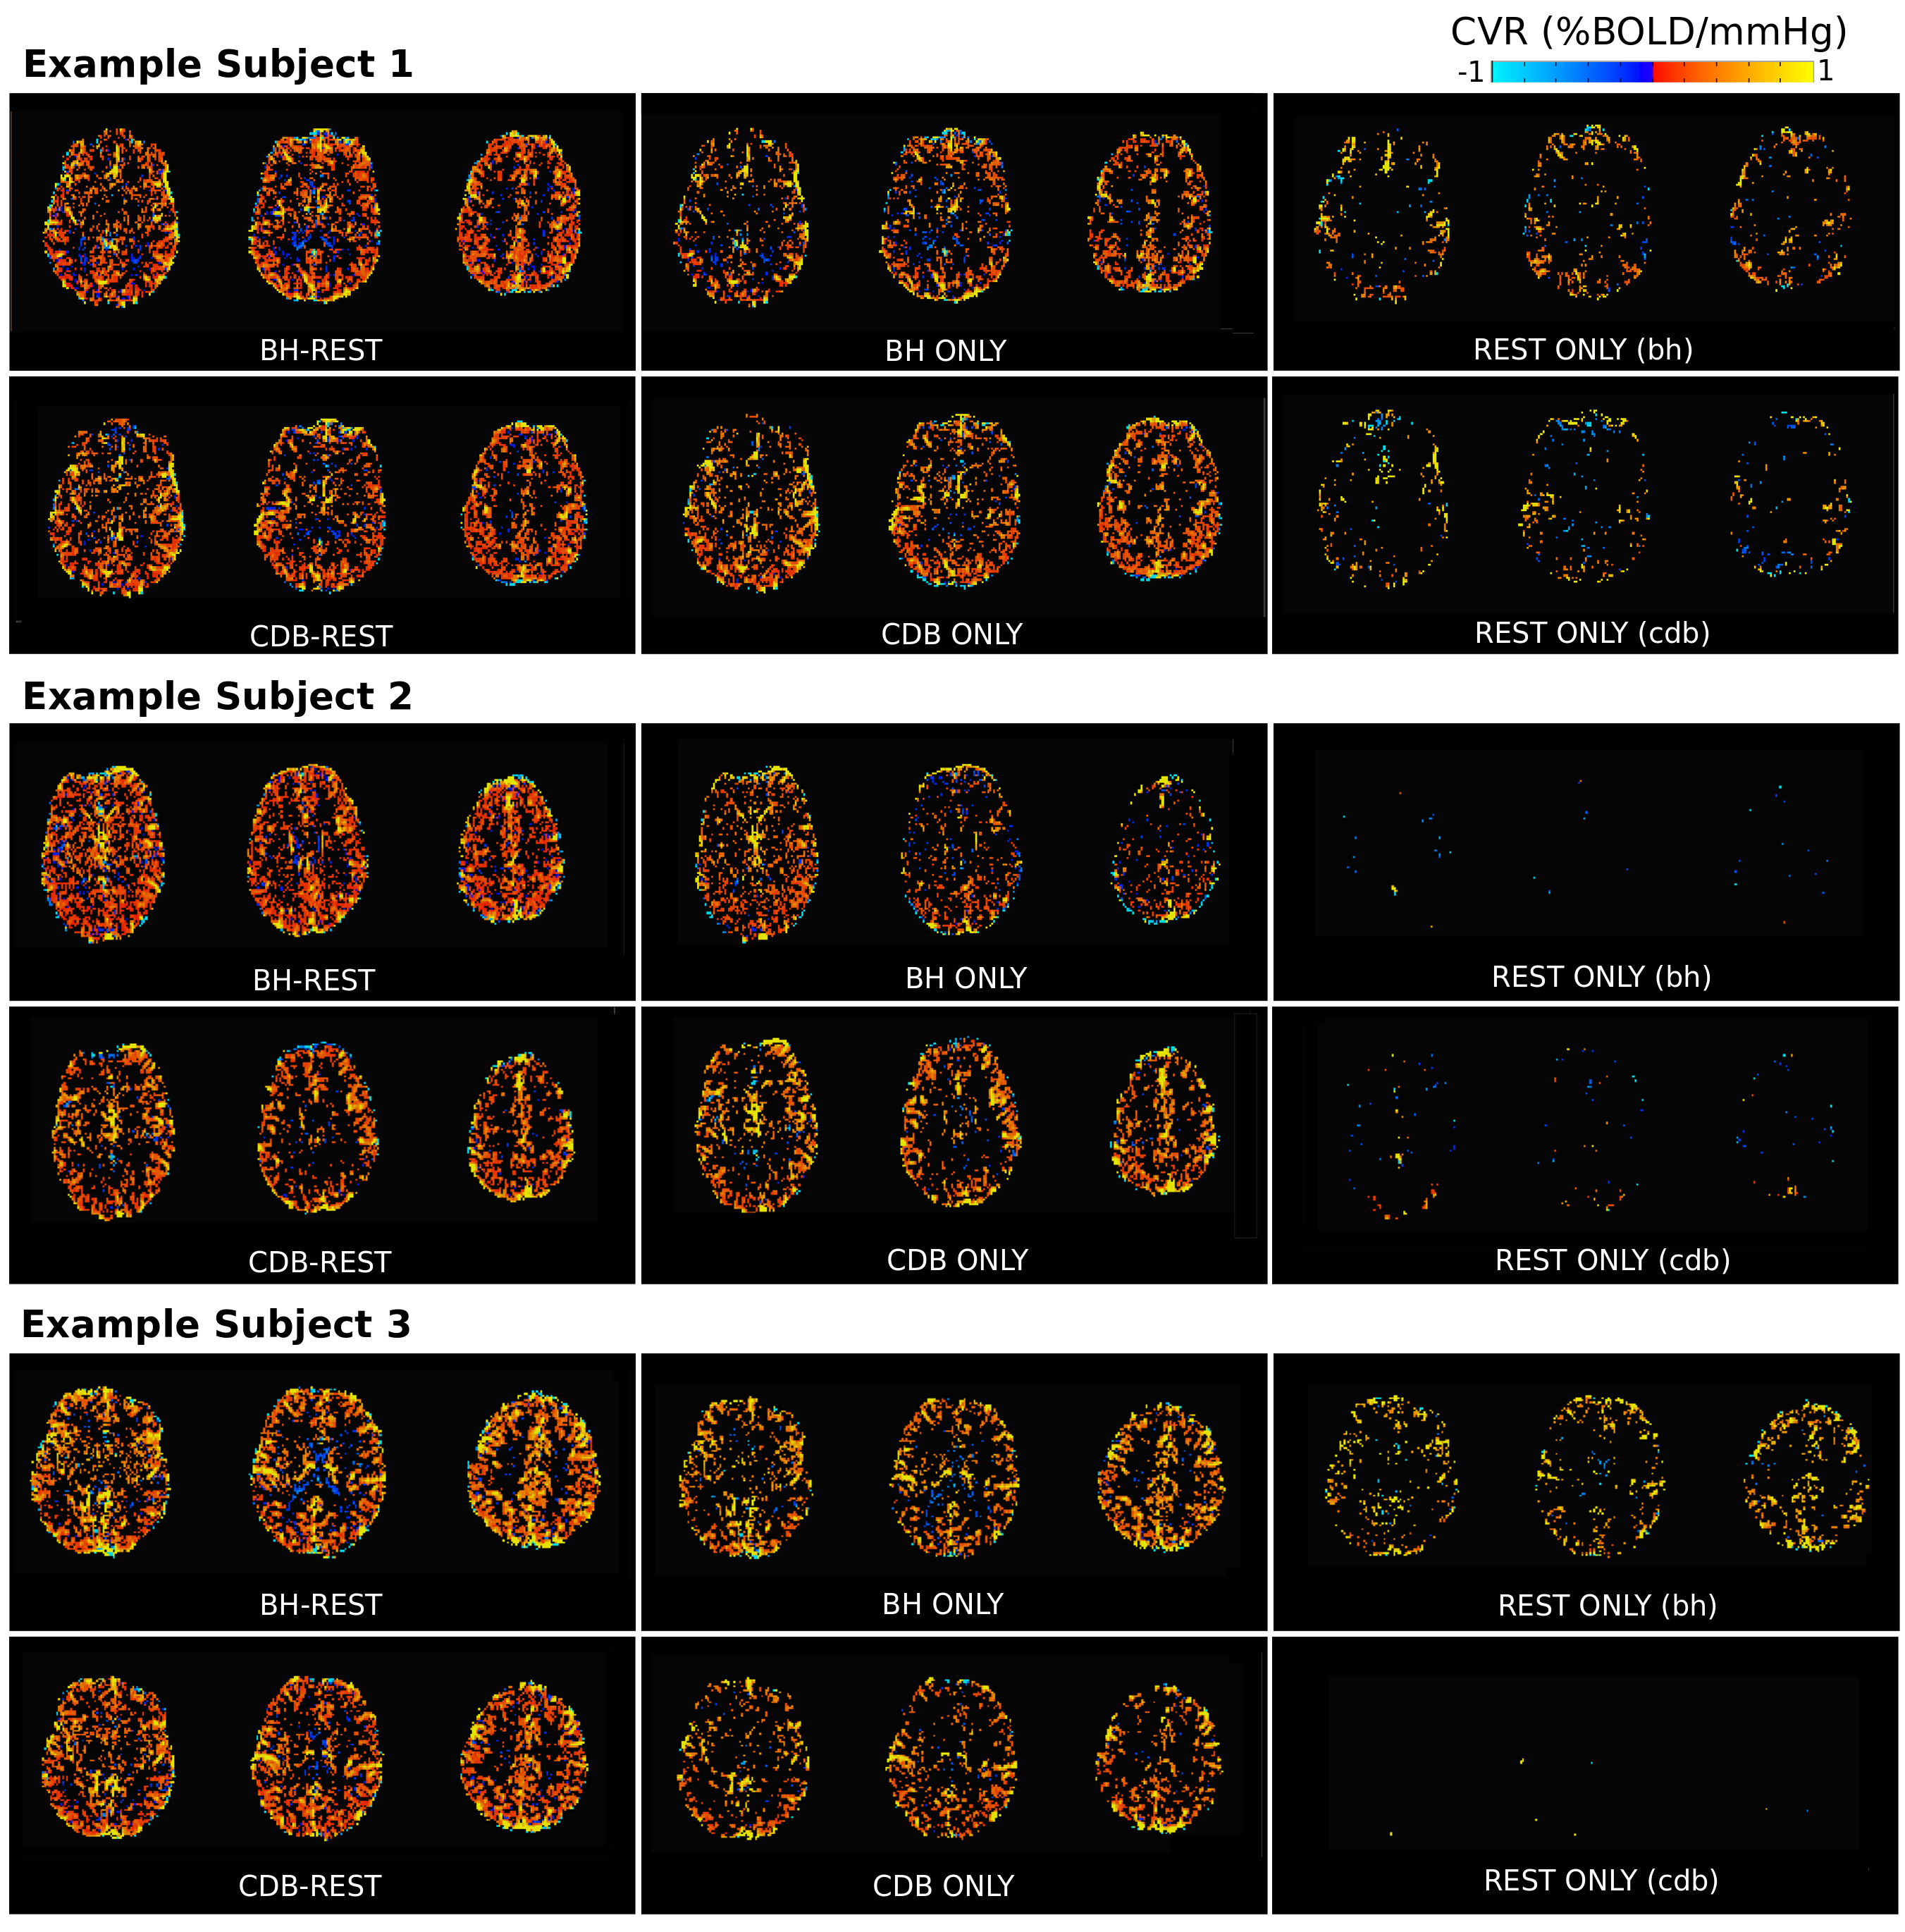
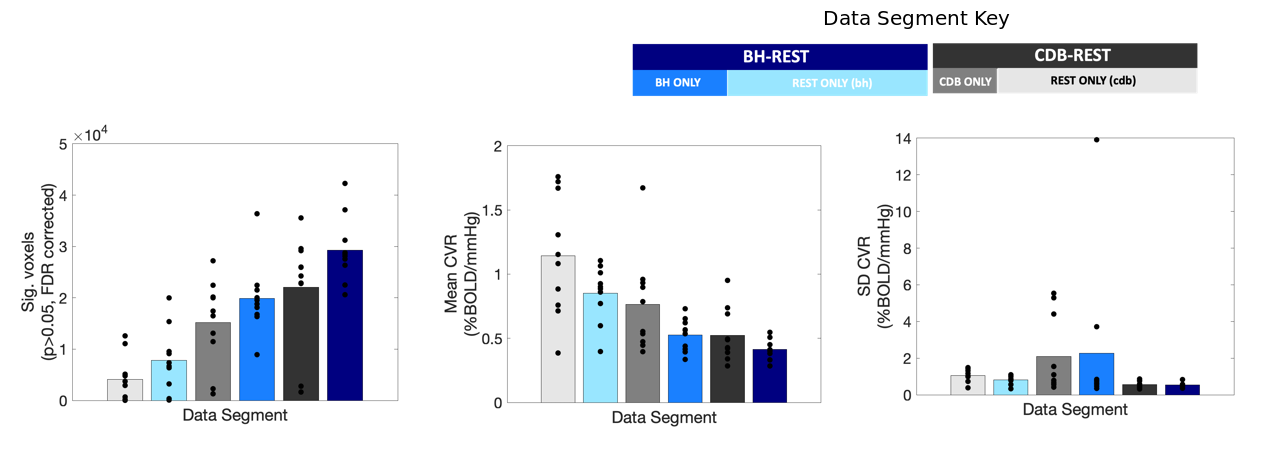
Figure 2 displays the %BOLD GM average time-series for each person, highlighting a good temporal similarity with the PETCO2 trace. On average, the BHs induced +6mmHg and CDBs induced -6mmHg from baseline PETCO2 levels.Figure 3 shows CVR maps from three subjects, and Figure 4 summarizes the CVR values for all subjects. There are consistently a greater number of significant voxels when using the full datasets and fewer in the REST segments. Mean CVR values show an opposite pattern, where the full datasets resulted in the lowest CVR. However, these mean CVR values agree with the gas inhalation literature, where BOLD-CVR of <1 is consistently reported,12,13,14. The BH-REST, CDB-REST, BH and CDB data result in more sensible anatomical distribution of CVR values for all participants. The CVR maps using REST data only are very variable across people; some participants have almost no significant voxels.
Discussion and Conclusion
Including a simple breathing task at the start of a rs-fMRI scan can produce better CVR maps compared to just using the rs-fMRI data alone. Using the full dataset seemed to actually give the best result; this may simply be due to more degrees of freedom, but could be related to task correlated motion. In the BH scan, larger motion artifacts occur at the same time as the PETCO2 changes, due to the nature of the task instructions. Adding in data from resting state, where motion is less correlated with PETCO2, may help the model fit variation that is more meaningfully related to PETCO2 . In general, adequate CVR maps may be possible with resting state data, but only if there is enough variability to fit this relationship. CVR is an important metric of cerebrovascular health, and accounting for it will also help us better model vascular confounds in fMRI signals.Acknowledgements
No acknowledgement found.References
1. Pillai JJ, Mikulis DJ. Cerebrovascular Reactivity Mapping: An Evolving Standard for Clinical Functional Imaging. AJNR Am J Neuroradiol. 2014:1-7. doi:10.3174/ajnr.A3941
2. Marshall O, Chawla S, Lu H, Pape L, Ge Y. Cerebral blood flow modulation insufficiency in brain networks in multiple sclerosis: A hypercapnia MRI study. J Cereb Blood Flow Metab. 2016;36(12):2087-2095. doi:10.1177/0271678X16654922
3. Chen JJ. Cerebrovascular-Reactivity Mapping Using MRI: Considerations for Alzheimer’s Disease. Front Aging Neurosci. 2018;10:170. doi:10.3389/fnagi.2018.00170
4. Lipp I, Murphy K, Caseras X, Wise RG. Agreement and repeatability of vascular reactivity estimates based on a breath-hold task and a resting state scan. Neuroimage. 2015;113:387-396. doi:10.1016/j.neuroimage.2015.03.004
5. Golestani AM, Wei LL, Chen JJ. Quantitative mapping of cerebrovascular reactivity using resting-state BOLD fMRI: Validation in healthy adults. Neuroimage. 2016;138:147-163. doi:10.1016/j.neuroimage.2016.05.025
6. Liu P, Li Y, Pinho M, Park DC, Welch BG, Lu H. Cerebrovascular reactivity mapping without gas challenges. Neuroimage. 2017;146:320-326. doi:10.1016/J.NEUROIMAGE.2016.11.054
7. Bright MG, Murphy K. Cleaning up the fMRI time series: Mitigating noise with advanced acquisition and correction strategies. Neuroimage. 2017;154:1-3. doi:10.1016/j.neuroimage.2017.03.056
8. Wise RG, Ide K, Poulin MJ, Tracey I. Resting fluctuations in arterial carbon dioxide induce significant low frequency variations in BOLD signal. Neuroimage. 2004;21(4):1652-1664. doi:10.1016/J.NEUROIMAGE.2003.11.025
9. Murphy K, Birn RM, Bandettini PA. Resting-state fMRI confounds and cleanup. Neuroimage. 2013;80:349-359. doi:10.1016/j.neuroimage.2013.04.001
10. Bright MG, Bulte DP, Jezzard P, Duyn JH. Characterization of regional heterogeneity in cerebrovascular reactivity dynamics using novel hypocapnia task and BOLD fMRI. Neuroimage. 2009;48(1):166-175. doi:10.1016/j.neuroimage.2009.05.026
11. Bright MG, Bianciardi M, de Zwart JA, Murphy K, Duyn JH. Early anti-correlated BOLD signal changes of physiologic origin. Neuroimage. 2014;87:287-296. doi:10.1016/J.NEUROIMAGE.2013.10.055
12. Liu P, De Vis JB. Cerebrovascular reactivity (CVR) MRI with CO2 challenge: A technical review. Neuroimage. 2019;187:104-115. doi:10.1016/J.NEUROIMAGE.2018.03.047
13. Tancredi FB, Lajoie I, Hoge RD. Test-retest reliability of cerebral blood flow and blood oxygenation level-dependent responses to hypercapnia and hyperoxia using dual-echo pseudo-continuous arterial spin labeling and step changes in the fractional composition of inspired gases. J Magn Reson Imaging. 2015;42(4):1144-1157. doi:10.1002/jmri.24878
14. Golestani AM, Kwinta JB, Strother SC, Khatamian YB, Chen JJ. The association between cerebrovascular reactivity and resting-state fMRI functional connectivity in healthy adults: The influence of basal carbon dioxide. Neuroimage. 2016;132:301-313. doi:10.1016/j.neuroimage.2016.02.051
Figures