1111
Increased negative BOLD responses along the rat visual pathway with short inter-stimulus intervals1Champalimaud Neuroscience Programme, Champalimaud Centre for the Unknown, Lisbon, Portugal
Synopsis
We investigated BOLD responses along the rat visual pathway via inter-stimulus-intervals (ISI) and stimulus pulse width (PW) modulation. PWs did not impact negative BOLD responses (NBRs) while shortening ISI resulted in very large increases in NBRs. Visual cortex (VC) NBRs at short ISIs were accompanied by decreased positive BOLD responses (PBRs) in lateral geniculate nucleus of the thalamus (LGN) and superior colliculus (SC). At the shortest ISI (30ms) NBRs were observed in SC. Along with reported reduced visual evoked potentials amplitude at short ISIs, our findings suggest decreased net excitability as a source for negative BOLD responses in this scenario.
Introduction
Neuronal inhibition was suggested as one possible source of Negative BOLD Responses (NBRs)1-3, but the mechanisms underlying NBRs are still debated4. Decreasing inter-stimulus intervals (ISI) have been shown to attenuate visual evoked potential (VEP) amplitude in visual cortex (VC)5,6 and Superior Colliculus (SC)7 possibly reflecting a local increase in net inhibition. VEPs reflect local average synaptic activity and a similar mechanism underlies the neurovascular couplings governing BOLD signals8, so we hypothesized that VC and SC NBRs will increase as ISI shortens. Our results in the rat visual pathway confirmed this hypothesis pointing to negative feedback mechanisms (or otherwise failure to recover full neuronal excitability) in the visual pathway, as a possible source of negative BOLD responses.Methods
Animal experiments were preapproved by the institutional and national authorities and were carried out according to European Directive 2010/63.Animal preparation: Adult female Long Evan rats (N=11) were kept under medetomidine sedation4 while temperature and respiration rate were monitored and remained stable.
MRI experiments: A 9.4T BioSpec scanner (Bruker, Karlsruhe, Germany) with an 86mm quadrature resonator for transmittance and a 4-element array cryoprobe9,10 (Bruker, Fallanden, Switzerland) for signal reception was used. A SE-EPI sequence was used for the functional MRI (TE/TR=40/1500msec, FOV=18x16.1mm2, in-plane resolution=268x268μm2, slice thickness=1.5mm, tacq=6min45sec). All experiments were performed under hyperoxia condition (95%O2) as this showed evidence for increased sensitivity towards NBRs in preliminary data.
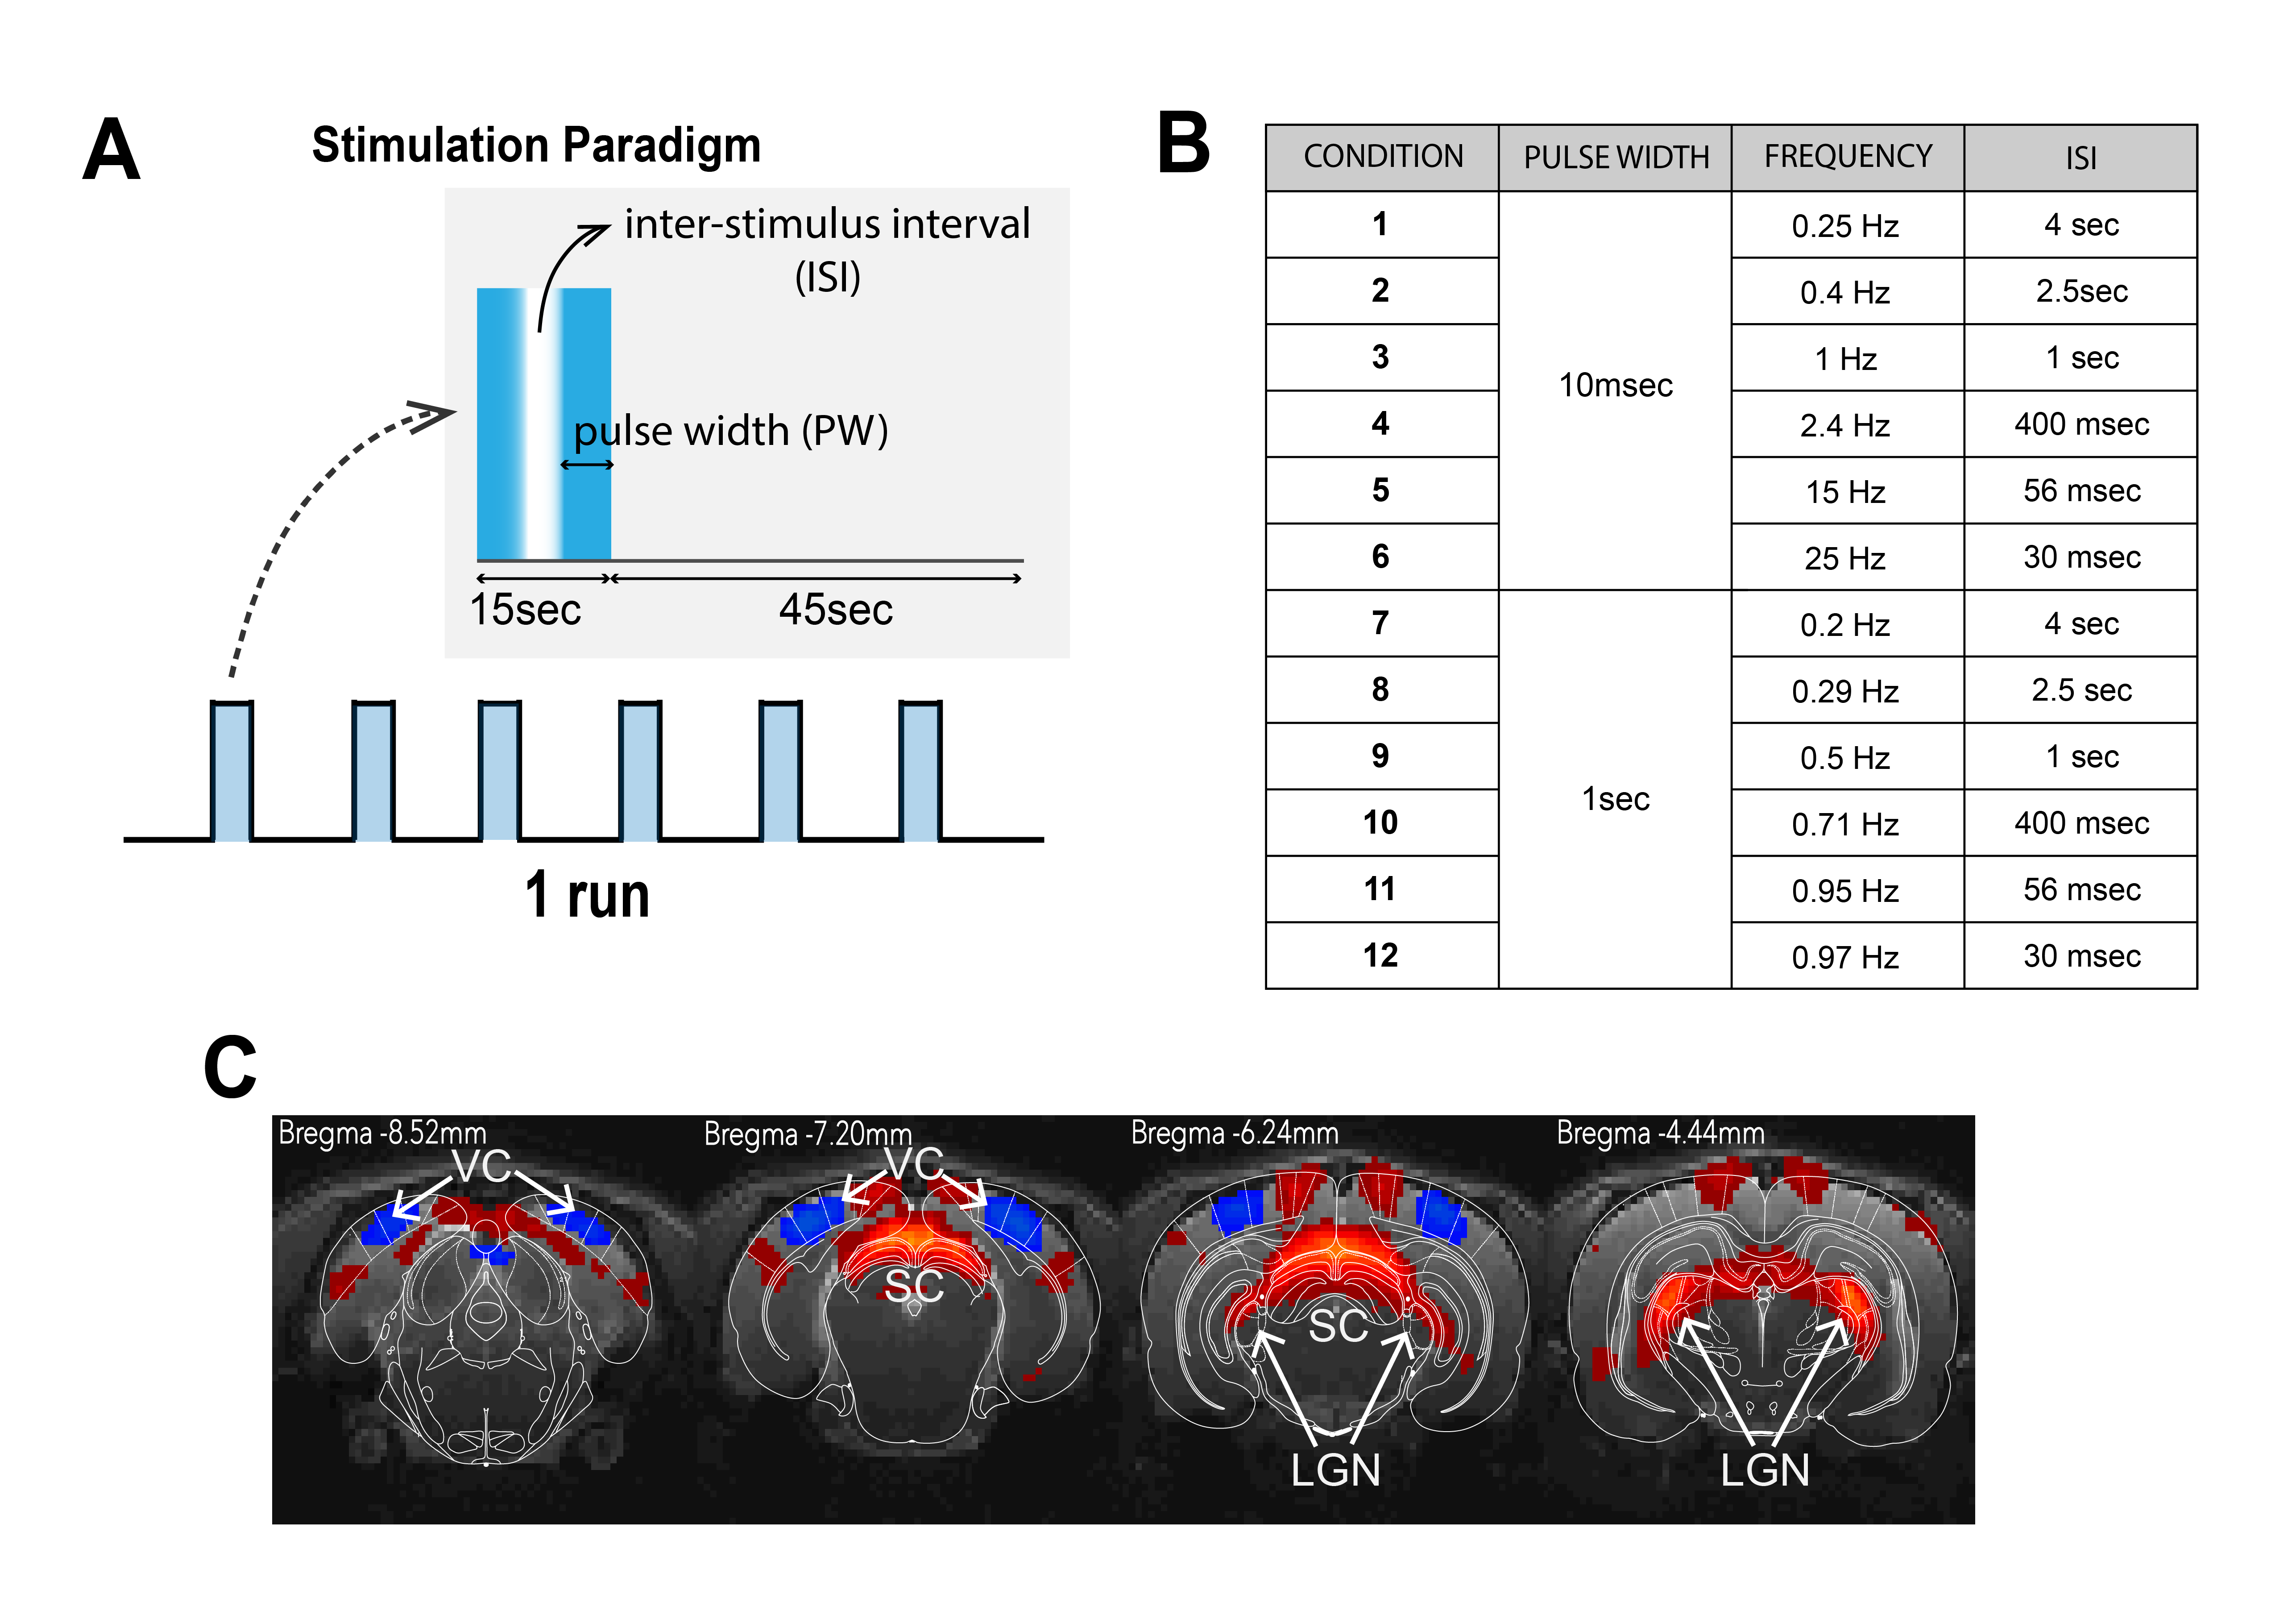
Visual Stimulation: Binocular stimulation was performed with a 470nm LED (2.89x10⁻³W/m2). The stimulation paradigm consisted of six repetitions of 15sec stimulation and 45sec rest (Fig. 1A). ISIs of 4000, 2500, 1000, 400, 56 and 30ms were tested for PWs of 1000 and 10ms (Fig.1B). Each condition was repeated between 8 and 10 times.
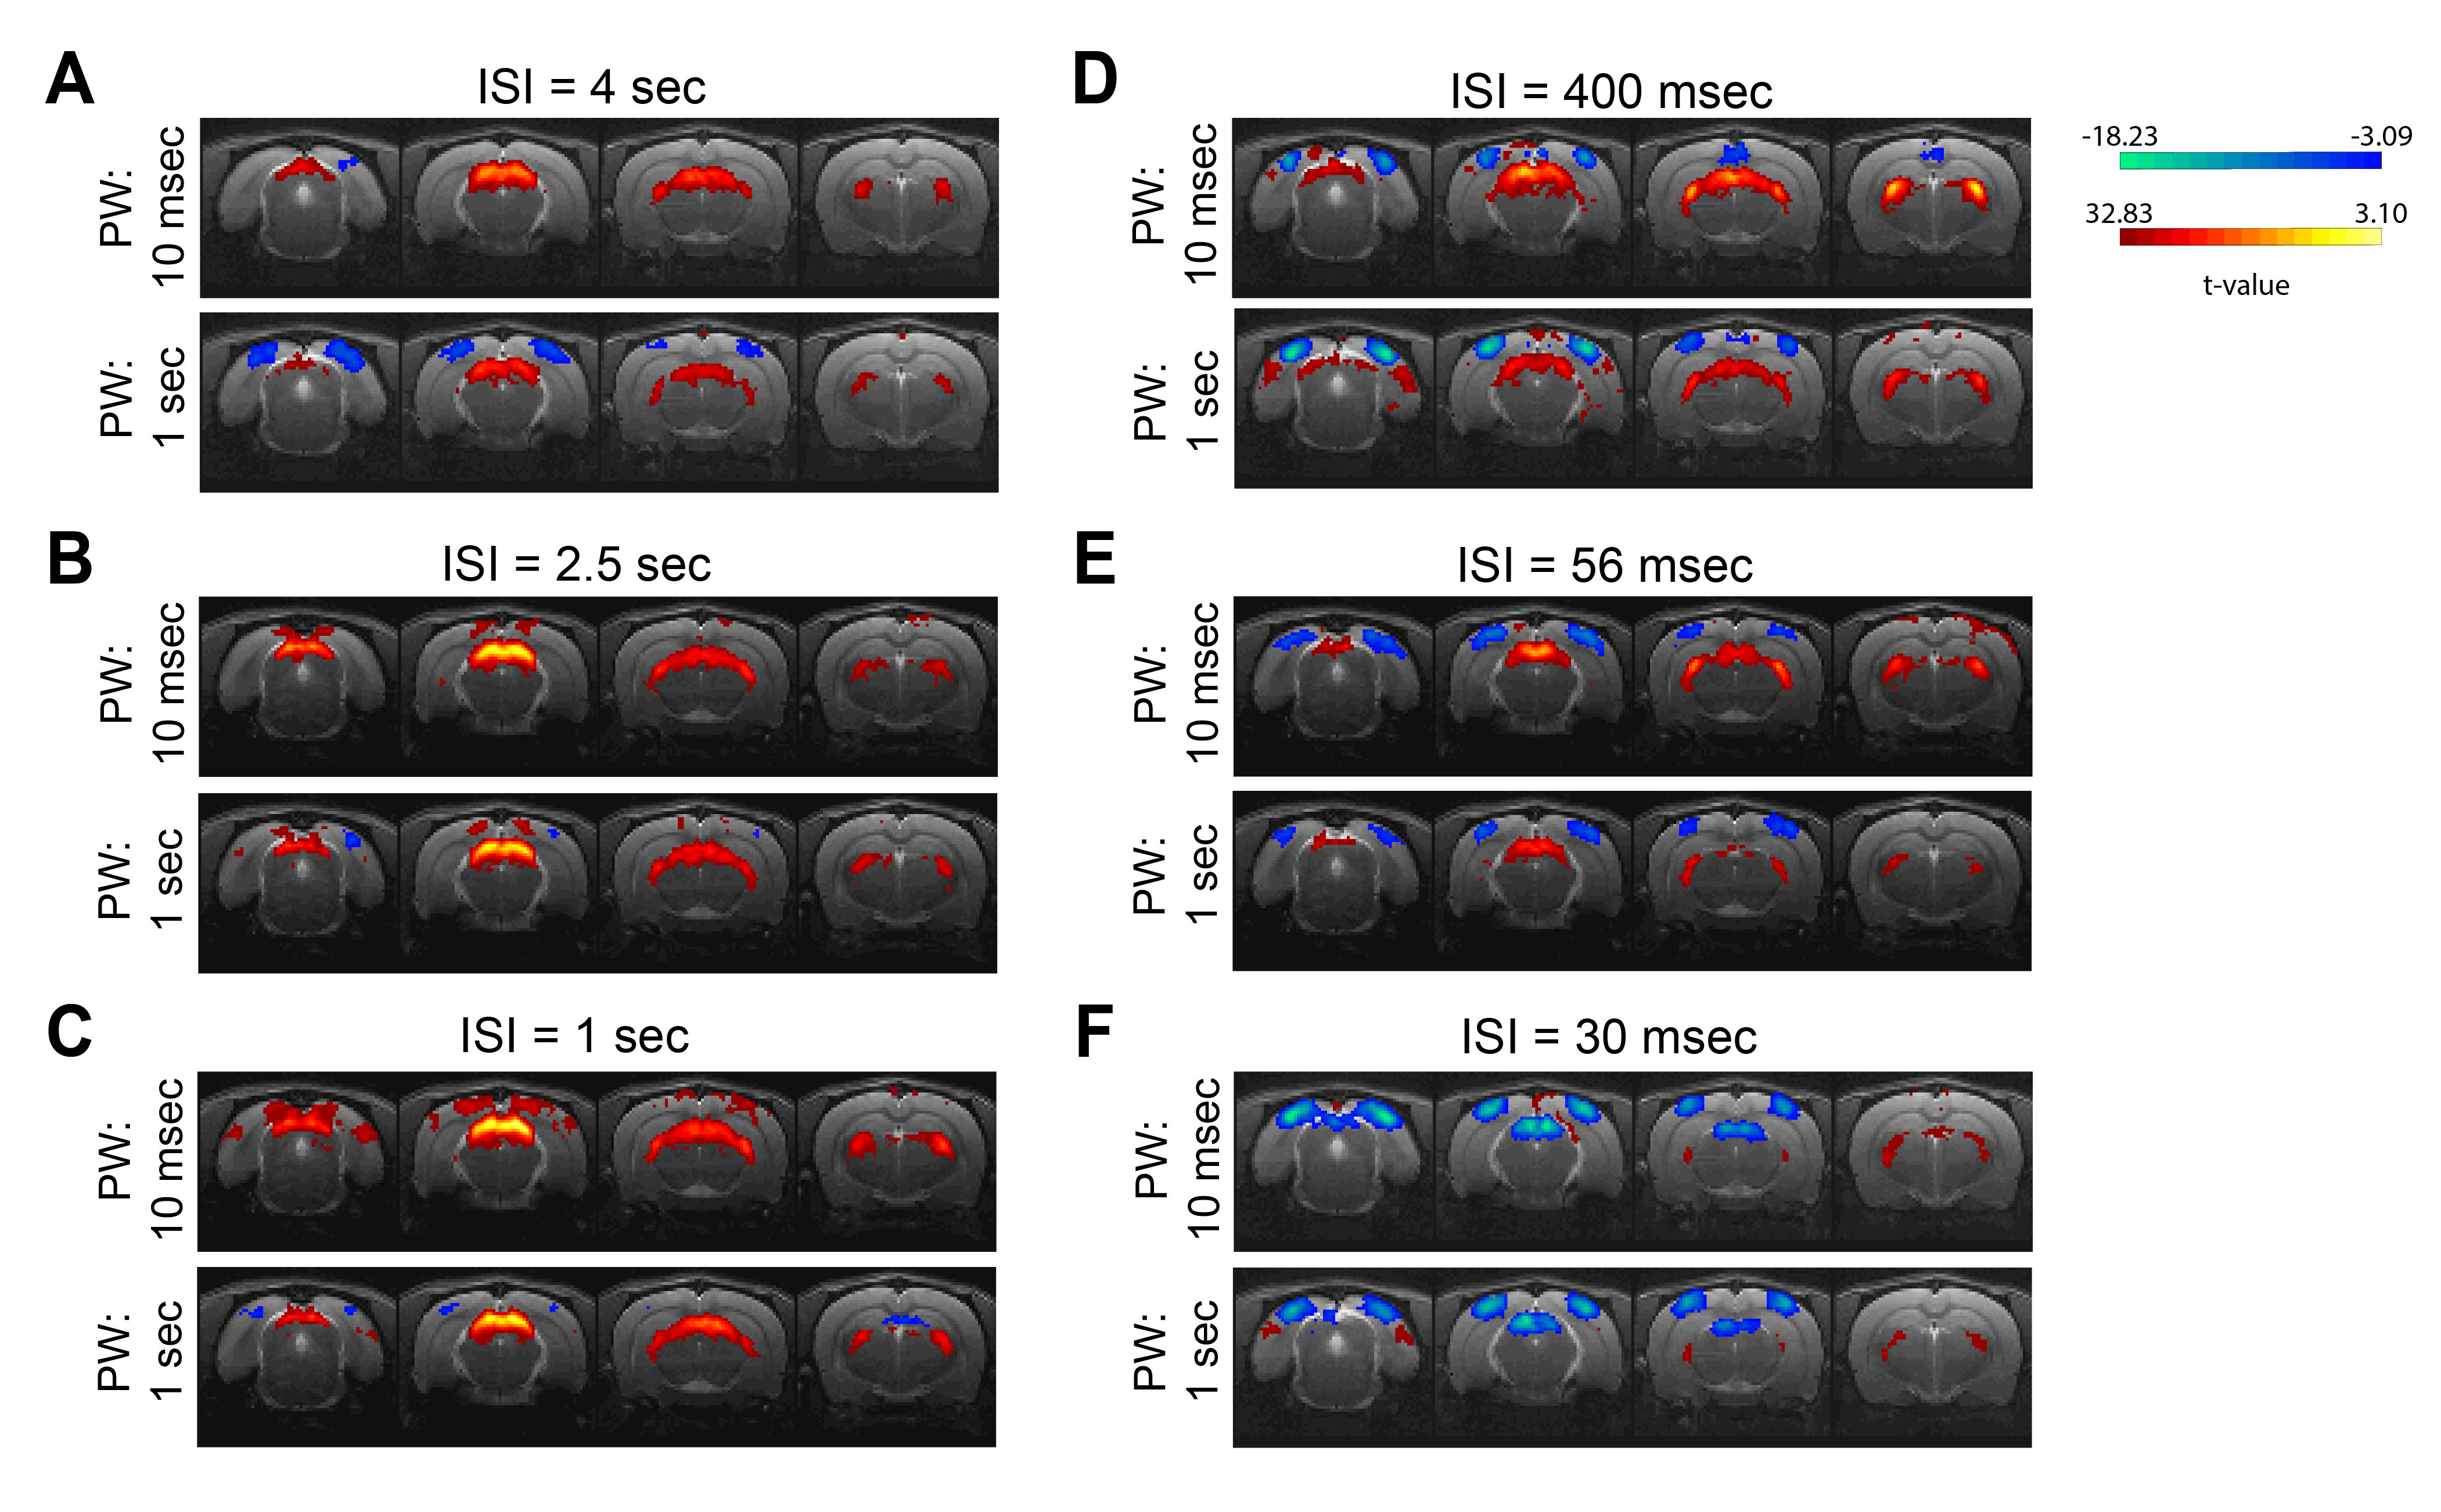
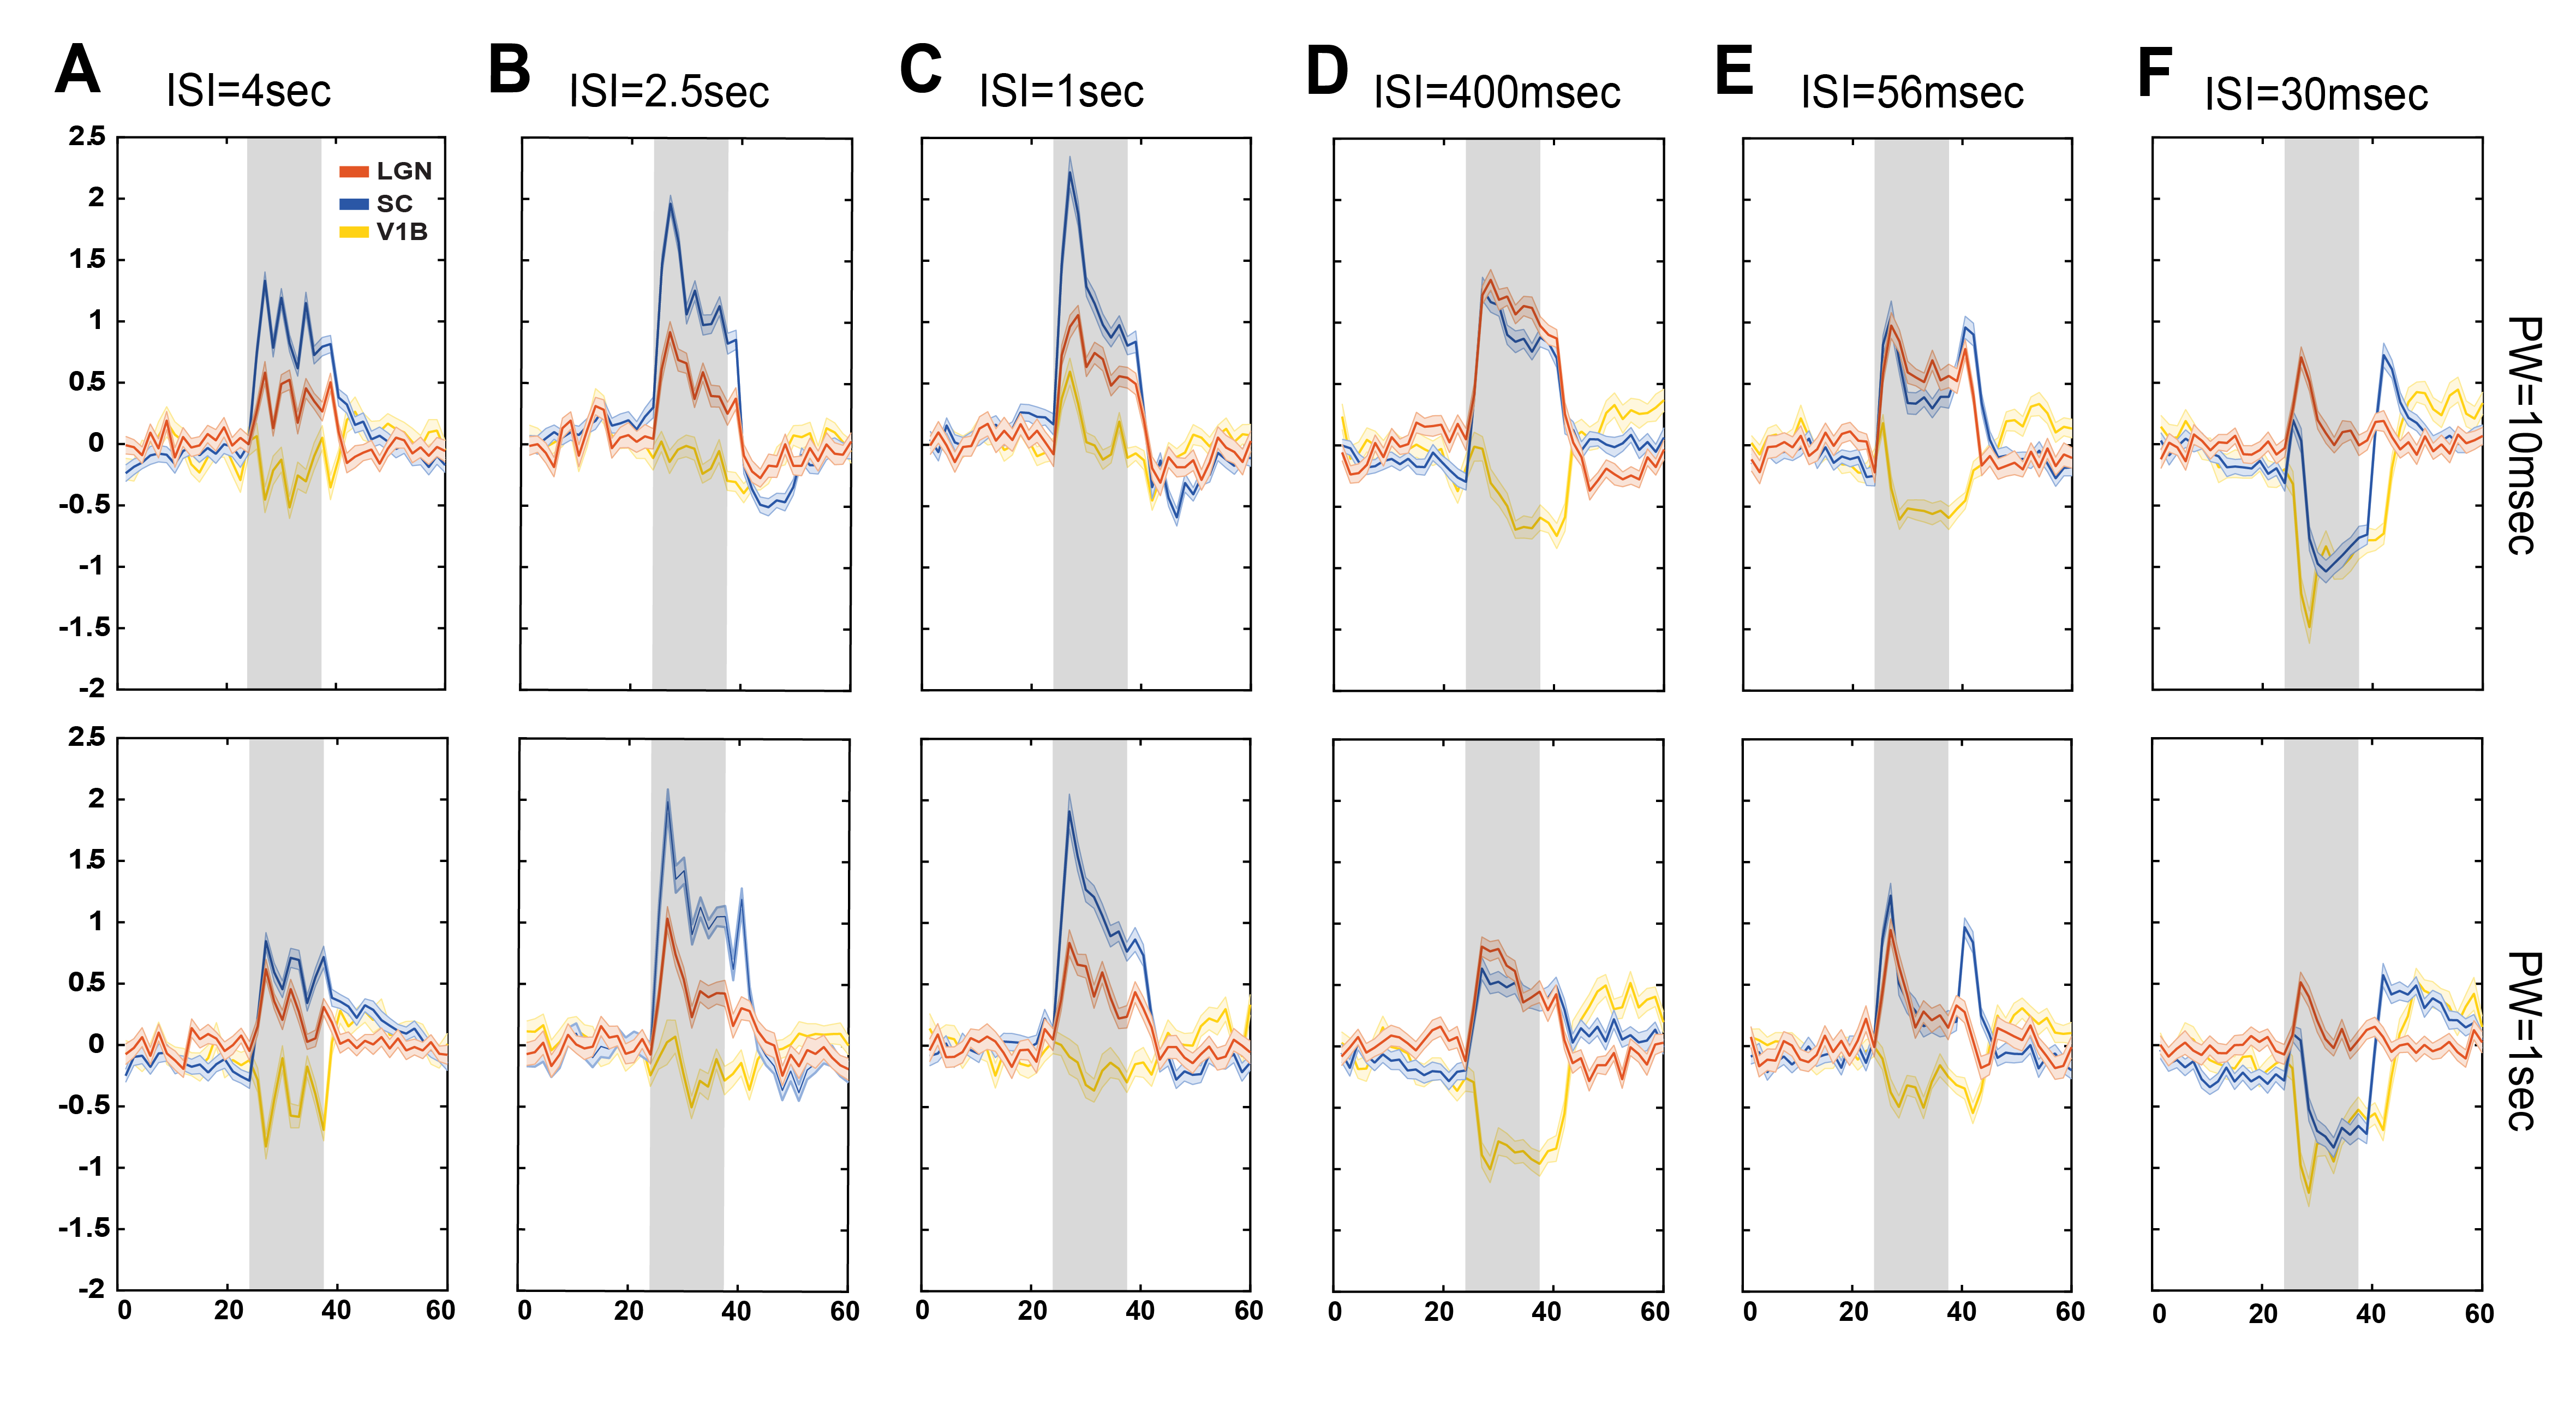
Data analysis: Standard fMRI pre-processing steps included manual outlier correction; slice-timing (sinc-interpolation); smoothing (3D Gaussian kernel, FWHM=0.268mm isotropic); realignment to the mean volume and co-registration to an anatomical reference. The stimulation paradigm was convolved with an HRF peaking at 1sec prior to a General Linear Model (GLM) analysis. A minimum significance level of 0.001 (cluster-FDR corrected) and a minimum cluster size of 8 voxels were applied to the group maps (Fig.2). Regions of interest (ROIs) were manually drawn according to an atlas11 (Fig.1C) and time-courses were detrended with a 4th polynomial fit to resting periods (Fig.3).
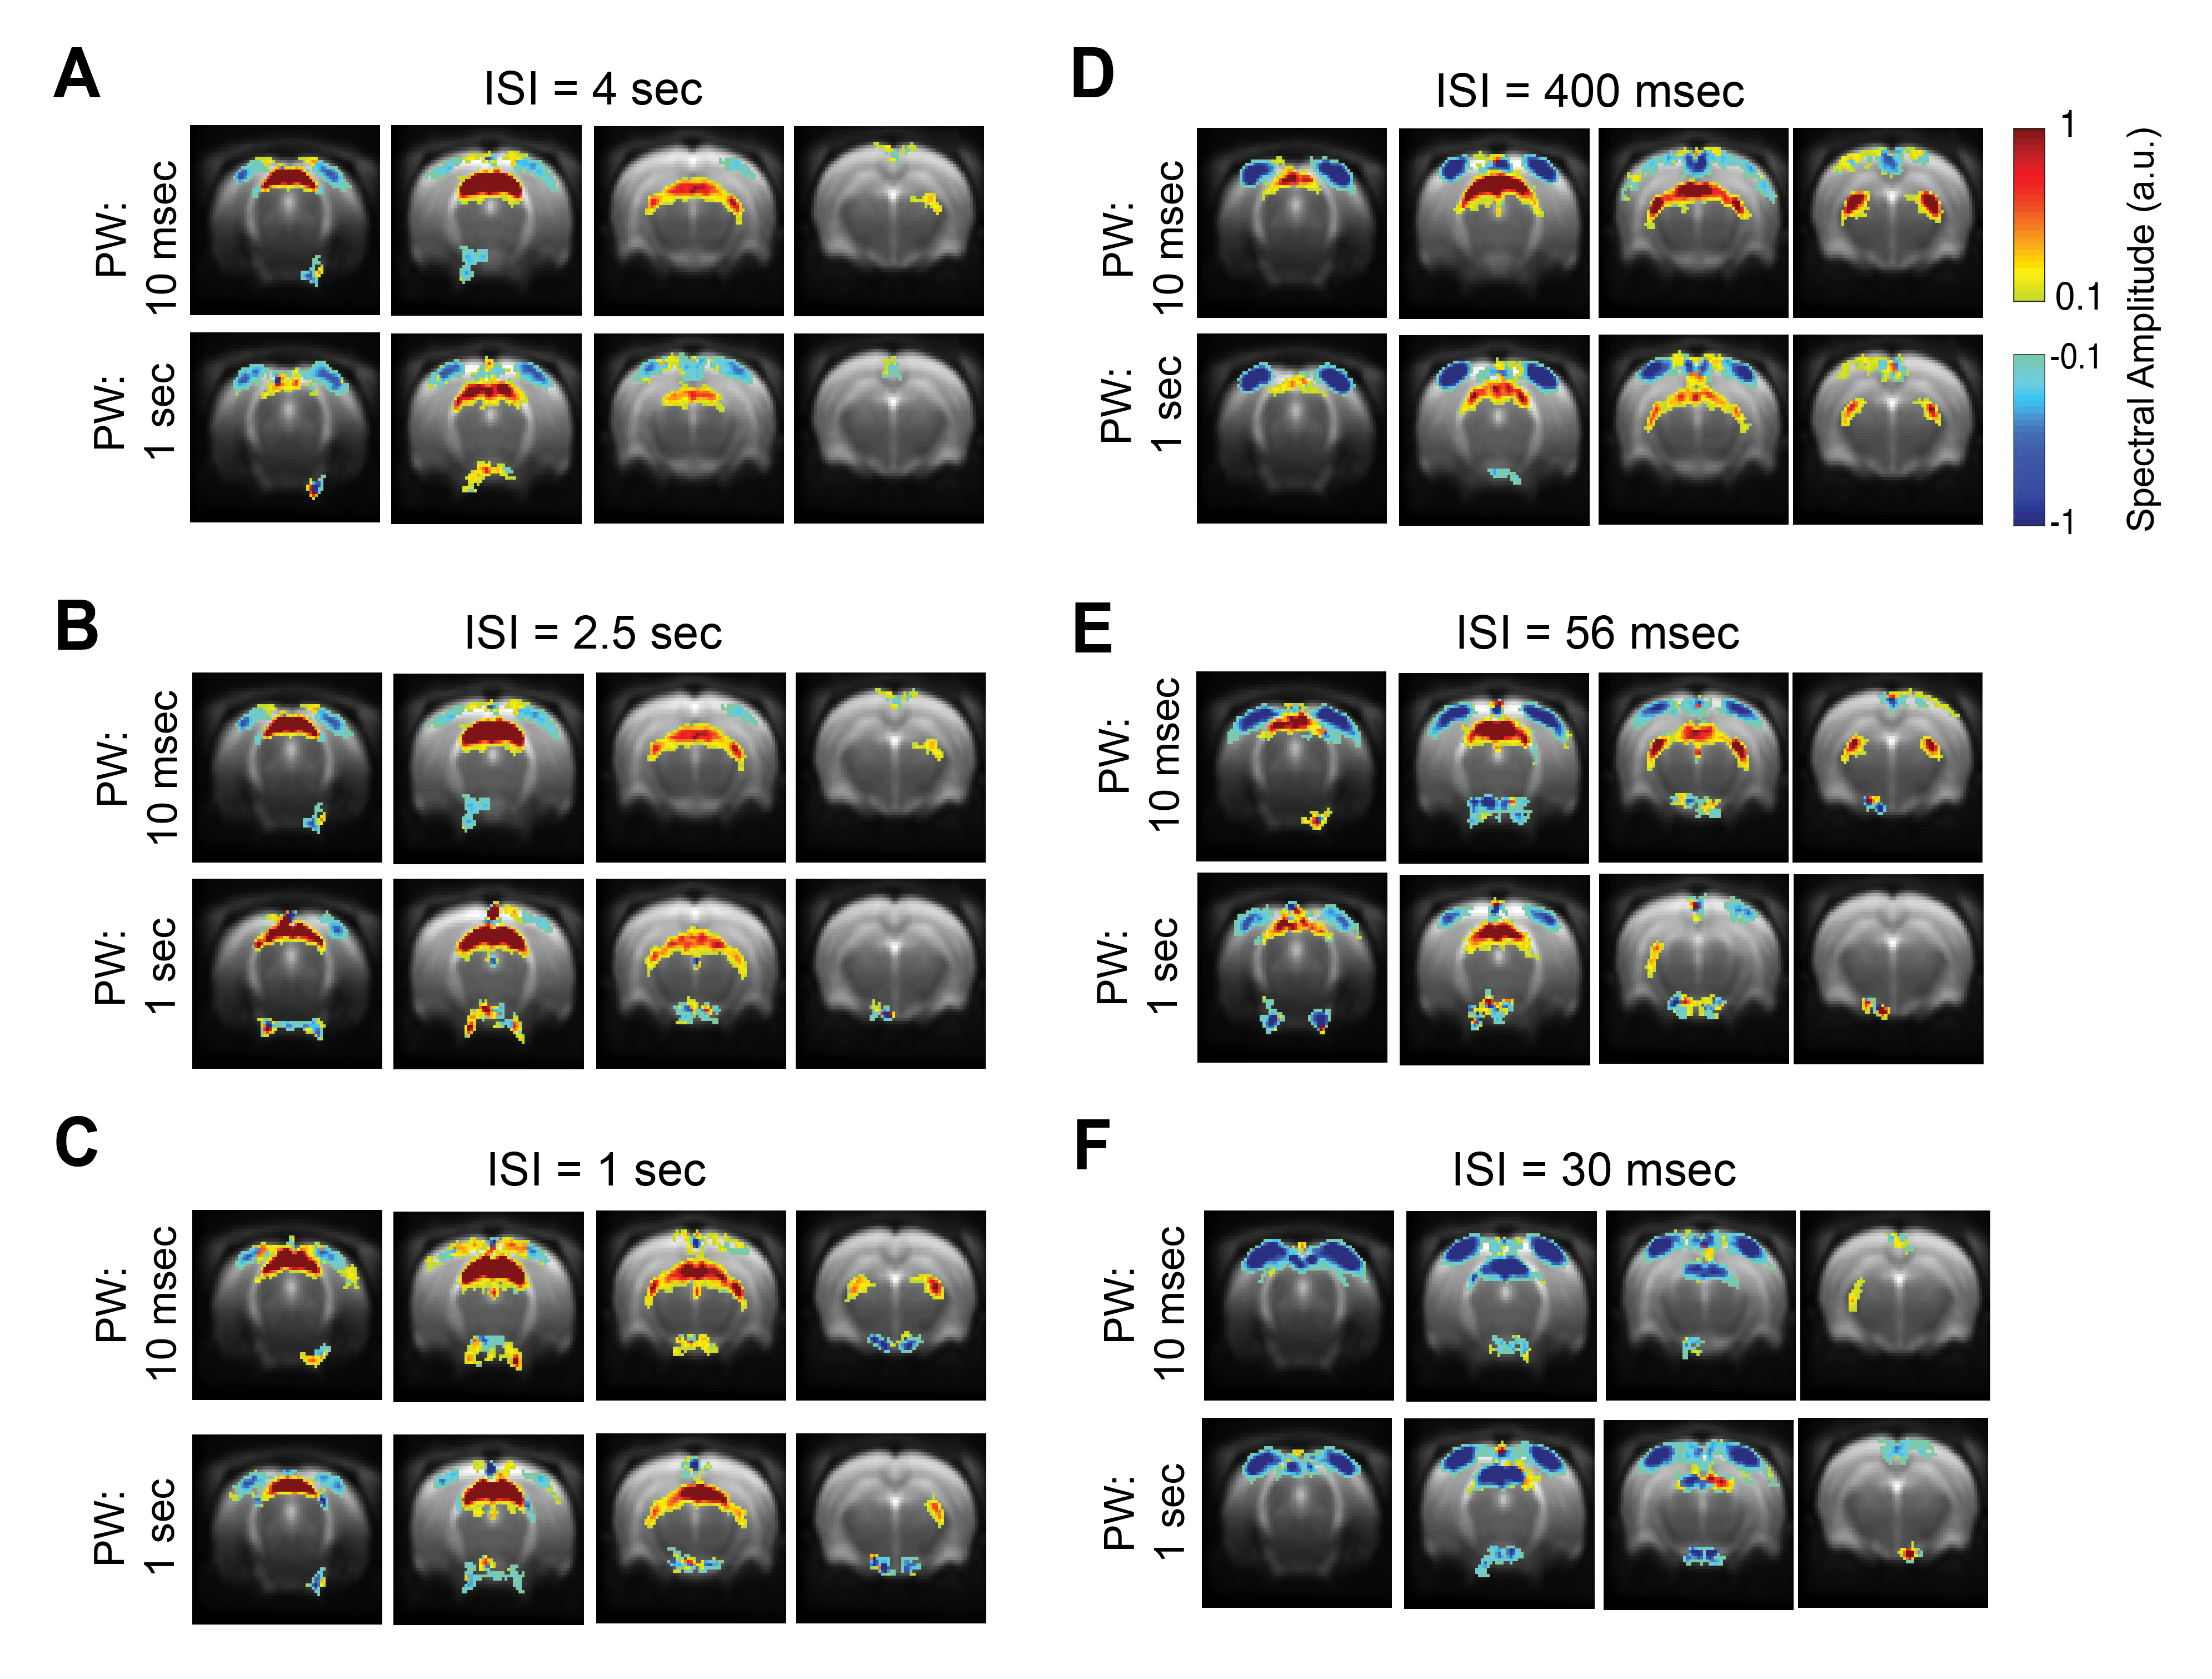
To avoid HRF-related a-priori assumptions, a data-driven approach as in [12] was performed where the power of the paradigm’s fundamental frequency and first harmonic (Fig. 4) were mapped voxelwise.
Results
BOLD t-maps (Fig.2) show stronger NBRs in the VC, with decreasing ISI, centred in the V1B area which receives inputs from both eyes and is thought to be involved in depth perception13. Stronger PBRs were observed in subcortical structures at long ISIs while weaker PBRs were noted at shorter ISIs. Notably, SC evidenced NBRs at the shortest ISI (30msec).To corroborate the patterns shown in Fig.2, time-courses were extracted in relevant ROIs (Fig.3). Decreased PBRs amplitude is noted in subcortical structures for short ISIs accompanied by stronger VC NBRs. An interesting second after-stimulus peak appeared in SC at the two shortest ISIs at the same time as when VC NBRs start becoming positive. PWs did not show impact on the evolution of the ROIs BOLD responses.To ensure that the underlying HRF assumptions were not an error source, we computed activation maps based on a Fourier analysis, which is data-driven and relatively HRF independent12 (Fig.4). Very similar activation patterns to the GLM-driven maps were observed further confirming the PBRs and NBRs observed.
Discussion
VEPs decrease in amplitude was documented at short ISI regime5-7, possibly reflecting increases in net inhibition or at least decreases in excitability. Our findings revealed stronger VC NBRs and weaker subcortical PBRs with decreasing ISIs (reaching NBRs in SC at ISI=30msec). The hypothesis of increased neuronal net inhibition being associated with VEPs amplitude decrease seem to be coupled to stronger cortical NBRs and weaker subcortical PBRs (consistent with previous suggestions1-3).Interestingly, VC NBRs amplitude and subcortical PBRs seem to be inversely correlated. LGN and SC receive VC feedback projections, corticotectal14,15 and corticothalamic16-19 projections respectively, which are thought to act as a gain control, inducing either excitation or inhibition in these areas. One can speculate that, as VC NBRs become stronger, the observed reduction in PBRs amplitude, and the negative response in SC at the shortest ISI, might arise from negative feedback sent to subcortical areas, although it cannot be ruled out that it can also reflect a failure to recover total neuronal excitability20 at such short ISIs. Still, both hypotheses are consistent with neuronal inhibition as the source of NBRs in this scenario, and therefore also point to the potential usefulness of BOLD fMRI to reflect, to some extent, inhibition.
Conclusions
BOLD responses relationship with the ISI (and PW) in the rat visual pathway were investigated. VC NBRs are induced and become stronger for short ISIs while subcortical PBRs amplitude decreases, even becoming negative in SC. In SC, at short ISIs, a second after-stimulus peak appears at the time where VC NBRs amplitude starts decreasing. Along with reported reduced VEPs5-7 amplitude at short ISIs, our results suggest decreased net excitability as source for negative BOLD responses in this scenario.Acknowledgements
This study was supported by funding from the European Research Council (ERC) under the European Union’s Horizon 2020 research and innovation programme (Starting Grant, agreement No. 679058) and Fundação para a Ciência e Tecnologia (Portugal), project PD/BD/128297/2017. The authors acknowledge the vivarium of the Champalimaud Centre for the Unknow, a facility of CONGENTO which is a research infrastructure co- financed by Lisboa Regional Operational Programme (Lisboa 2020), under the PORTUGAL 2020 Partnership Agreement through the European Regional Development Fund (ERDF) and Fundação para a Ciência e Tecnologia (Portugal), project LISBOA-01-0145-FEDER-022170.References
[1] Sten, Sebastian, et al. "Neural inhibition can explain negative BOLD responses: A mechanistic modelling and fMRI study." NeuroImage 158 (2017): 219-231
[2] Northoff, Georg, et al. "GABA concentrations in the human anterior cingulate cortex predict negative BOLD responses in fMRI." Nature neuroscience 10.12 (2007): 1515
[3] Shmuel, Amir, et al. "Negative functional MRI response correlates with decreases in neuronal activity in monkey visual area V1." Nature neuroscience 9.4 (2006): 569
[4] Schridde, Ulrich, et al. "Negative BOLD with large increases in neuronal activity." Cerebral cortex 18.8 (2007): 1814-1827
[5] Padnick, Lissa B., and Robert A. Linsenmeier. "Properties of the flash visual evoked potential recorded in the cat primary visual cortex." Vision research 39.17 (1999): 2833-2840
[6] Todorov, Mihail I., et al. "Retino‐cortical stimulus frequency‐dependent gamma coupling: evidence and functional implications of oscillatory potentials." Physiological reports4.19 (2016): e12986
[7] Dyer, Robert S., and Zoltan Annau. "Flash evoked potentials from rat superior colliculus." Pharmacology Biochemistry and Behavior 6.4 (1977): 453-459
[8] Logothetis, Nikos K., et al. "Neurophysiological investigation of the basis of the fMRI signal." Nature 412.6843 (2001): 150
[9] Niendorf, Thoralf, et al. "Advancing cardiovascular, neurovascular and renal magnetic resonance imaging in small rodents using cryogenic radiofrequency coil technology." Frontiers in pharmacology 6 (2015): 255
[10] Baltes, Christof, et al. "Micro MRI of the mouse brain using a novel 400 MHz cryogenic quadrature RF probe." NMR in Biomedicine: An International Journal Devoted to the Development and Application of Magnetic Resonance In vivo22.8 (2009): 834-842
[11] Paxinos, George, and Charles Watson. The rat brain in stereotaxic coordinates: hard cover edition. Elsevier, 2006
[12] Nunes, Daniel, Andrada Ianus, and Noam Shemesh. "Layer-specific connectivity revealed by diffusion-weighted functional MRI in the rat thalamocortical pathway." NeuroImage 184 (2019): 646-657.
[13] Scholl, Benjamin, Johannes Burge, and Nicholas J. Priebe. "Binocular integration and disparity selectivity in mouse primary visual cortex." Journal of neurophysiology 109.12 (2013): 3013-3024
[14] Liang, Feixue, et al. "Sensory cortical control of a visually induced arrest behavior via corticotectal projections." Neuron86.3 (2015): 755-767
[15] Zhao, Xinyu, Mingna Liu, and Jianhua Cang. "Visual cortex modulates the magnitude but not the selectivity of looming-evoked responses in the superior colliculus of awake mice." Neuron 84.1 (2014): 202-213
[16] Alitto, Henry J., and W. Martin Usrey. "Corticothalamic feedback and sensory processing." Current opinion in neurobiology 13.4 (2003): 440-445
[17] Denman, Daniel J., and Diego Contreras. "Complex effects on in vivo visual responses by specific projections from mouse cortical layer 6 to dorsal lateral geniculate nucleus." Journal of Neuroscience 35.25 (2015): 9265-9280
[18] De Labra, Carmen, et al. "Changes in visual responses in the feline dLGN: selective thalamic suppression induced by transcranial magnetic stimulation of V1." Cerebral Cortex 17.6 (2006): 1376-1385
[19] Harvey, Alan R., and Delys R. Worthington. "The projection from different visual cortical areas to the rat superior colliculus." Journal of Comparative Neurology 298.3 (1990): 281-292
[20] Minamisawa, Genki, et al. "Flashing Lights Induce Prolonged Distortions in Visual Cortical Responses and Visual Perception." eNeuro 4.3 (2017)
Figures