1109
Voxel-wise CMRO2 mapping reveals focally-reduced task-related oxygen consumption in multiple sclerosis1CUBRIC - Cardiff University Brain Research Imaging Centre -Psychology, Cardiff University, Cardiff, United Kingdom, 2Department of Physical Therapy and Human Movement Sciences, Northwestern University, Chicago, IL, United States, 3Institute for Advanced Biomedical Technologies (ITAB), Department of Neurosciences, Imaging and Clinical Sciences, University of Chieti-Pescara “G. d’Annunzio”, Chieti, Italy
Synopsis
Calibrated fMRI can map the rate of cerebral oxygen consumption of the human brain, offering an important indicator of energy dysfunction in neurodegenerative and neuroinflammatory diseases. Previous studies investigated oxygen metabolism at rest or in response to tasks within BOLD signal defined region of interests (ROIs). Here, we investigate on a voxel-by-voxel basis the oxygen metabolic activity in patients with multiple sclerosis during the execution of a task. We show the feasibility of mapping task-induced CMRO2 changes, demonstrating reduced oxygen consumption in the basal ganglia in MS patients that was not otherwise evident from BOLD or CBF signals.
INTRODUCTION
fMRI BOLD signal is the most widely used measure of changes in brain activity due to its high SNR and ease of application. However, this is only an indirect measure of neural activity, as it reflects a combination of changes in cerebral blood volume, cerebral blood flow and oxygen consumption1. Under the assumption of oxidative energy release, the rate of cerebral metabolic oxygen consumption is expected to offer a direct quantitative measure of tissue energy consumption. In neuroinflammatory conditions such as multiple sclerosis (MS), where the coupling between neural activity and the vascular signal may be affected, these measures can offer biologically-relevant information on the actual tissue state. Previous studies have also shown higher reproducibility for calibrated fMRI technique, measuring relative changes in oxygen consumption, compared to BOLD2. Here, using a voxel-wise approach, we aim (I) to investigate changes in CMRO2 on a voxel-by-voxel basis during the execution of a motor task in MS patients and in matched healthy controls (HC) and (II) to map differences in task-related oxygen metabolism between groups. Changes in CMRO2 are our primary measure of tissue activity. Therefore, we do not rely on qualitative BOLD signal changes to identify regions of interest, when comparing HC and MS patients.METHODS
17 relapsing-remitting MS (mean±SD 37.1±1.8 years) patients and 21 matched healthy controls (mean±SD 34.1±1.3) underwent MRI (3T Siemens Prisma) that included a dual-excitation pseudo-continuous arterial spin labelling acquisition (TE1: 10ms, TR1: 3600ms, TE2: 30ms, TR2: 800ms, labelling duration: 1.5s, post-labelling delay: 1.5s, slice thickness: 7mm, and GRAPPA acceleration factor 3)3. We used our multiparametric dual-calibrated fMRI method, employing hypercapnic and hyperoxic calibration to map baseline (absolute) brain oxygen consumption, and provided the calibration parameter (M)4 for estimating relative changes in oxygen consumption. The same acquisition scheme was used during the performance of 8minute serial reaction time task consisting of 10 task blocks of 17s interleaved with 30s rest blocks. A 2-way ANOVA was performed in order to investigate changes in behavioural performance (accuracy (ACC) and reaction times (RT)) during task execution and differences between groups. FEAT (https://fsl.fmrib.ox.ac.uk/) was used to fit a linear model to the voxel-wise data in order to produce maps of significant task-induced BOLD signal change and CBF change. BOLD and CBF maps, as well as M maps from the respiratory challenges, were transformed to MNI space using registrations defined using T1-weighted structural scans of each participant (FSL-FLIRT). In order to estimate relative CMRO2 at voxel-wise level for each subject, the BOLD and CBF signal changes were applied in the Davis equation4,5. CMRO2 mean relative changes to the task blocks (compared to rest) were computed. Permutation tests (FSL-Randomise) were used to localise differences at the group level between HC and MS patients in BOLD response, CBF response and CMRO2 consumption during task execution.RESULTS
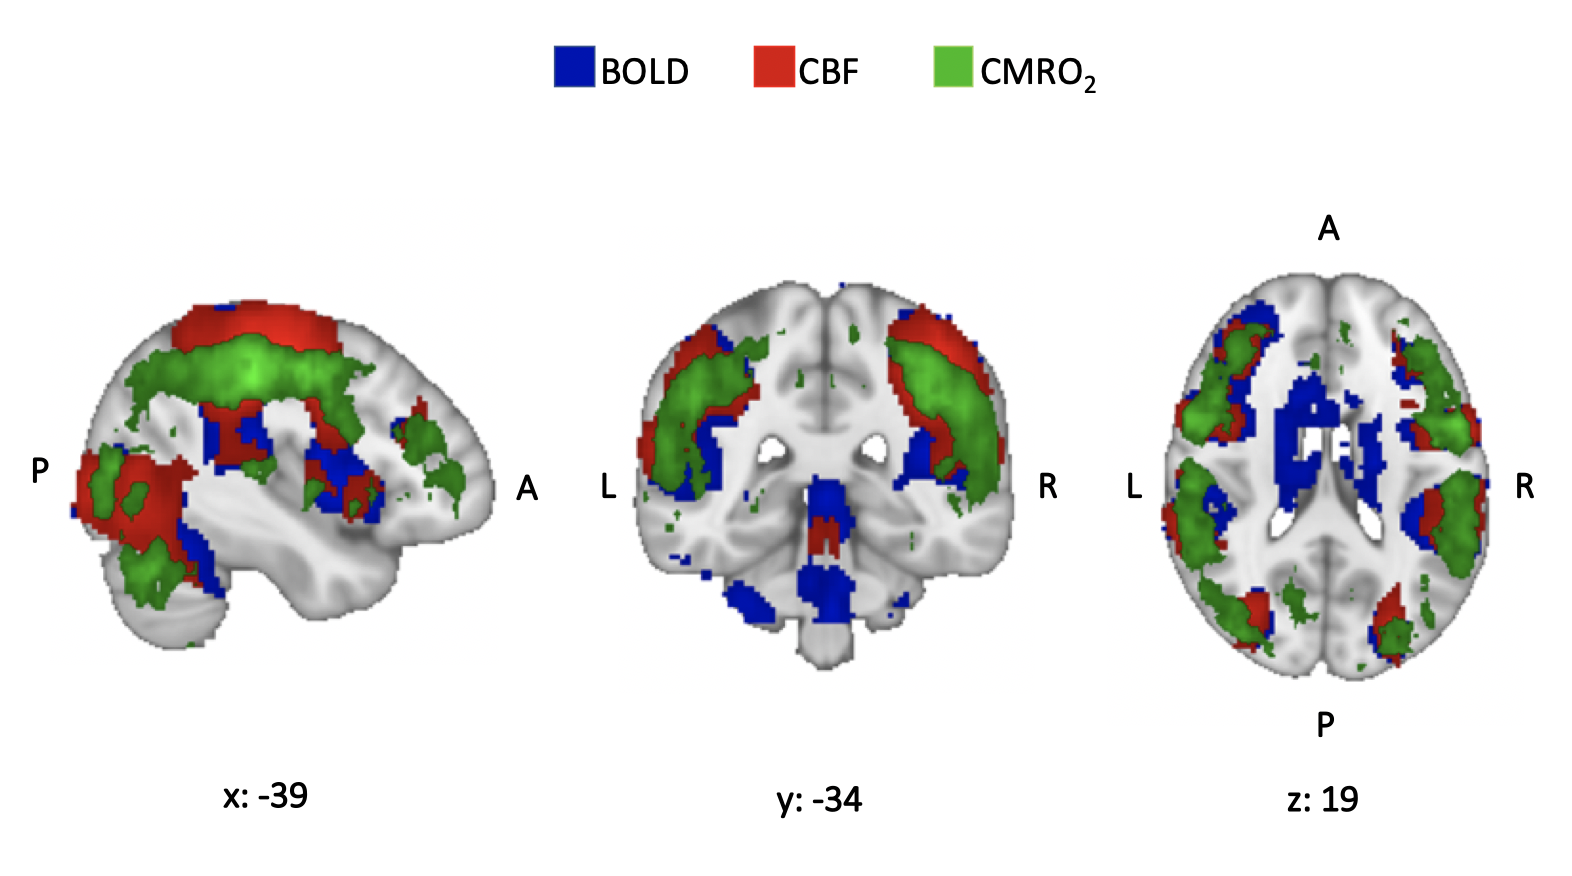
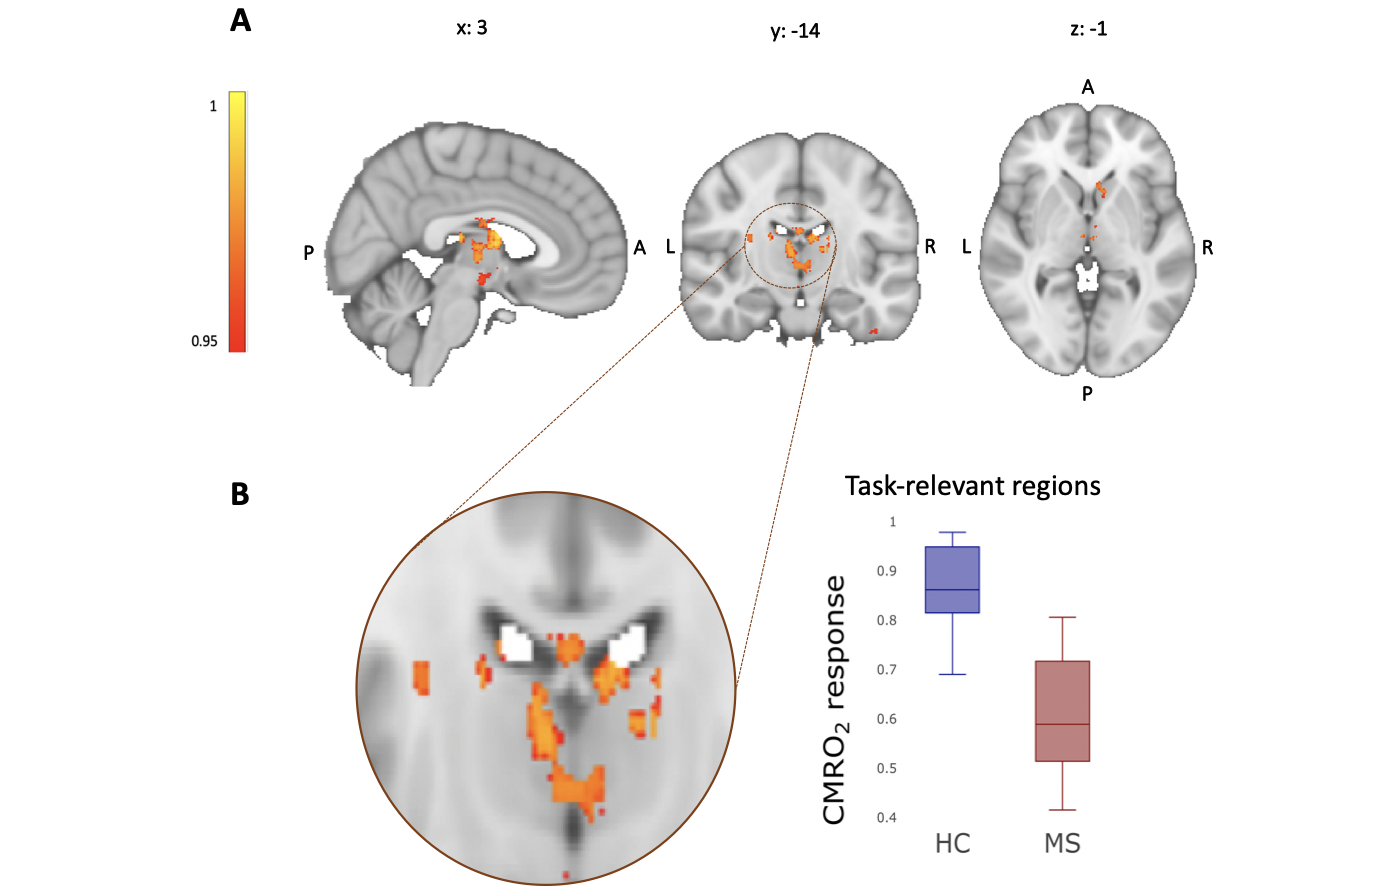
There was no significant group difference in RT (F(1,8)=3.13, p=0.08) or in ACC (F(1,8)=0.67, p=0.41). Both groups improved their performance with time (ACC: F(8,288)=11.67, p<0.001; RT: F(8,288)=10.61, p<0.001), with no difference between groups in the extent of improvement ( ACC: F(8,288)=1.23, p=0.28; RT: F(8,288)=1.27, p=0.25). Both groups showed task-induced increases in CMRO2 consumption with a similar spatial distribution of CMRO2 compared to task-related BOLD signal change and CBF increases (Figure 1). Areas of main activation included the postcentral gyri, superior parietal lobules, cerebellum and basal ganglia bilaterally. MS patients showed significantly lower CMRO2 consumption during task execution compared to HC in the thalami and caudate nuclei (Figure 2), with no between group differences in BOLD and CBF responses to the task.DISCUSSION/CONCLUSION
Using quantitative fMRI we demonstrate the feasibility of mapping task-induced changes in CMRO2 on a voxel-by-voxel basis to investigate tissue energy changes during motor-task execution in MS patients and in controls; as well as the differences between groups. The regional group difference were not defined by regions of altered BOLD signal response, but by CMRO2 maps directly. Overall, our results represent a methodological step forward when seeking to understand the tissue energetics, as they indicate that more commonly applied functional MRI methods are not sufficiently sensitive to changes in tissue energy consumption during task execution. Also, the voxel-wise investigation of energy dysfunction in MS may provide more sensitive and physiologically relevant markers of tissue damage for the evaluation of therapeutic strategies.Acknowledgements
The study was funded by the Wellcome Trust and MS Society UK.References
1. Logothetis, N. K., & Wandell, B. A. (2004). Interpreting the BOLD Signal. Annual Review of Physiology, 66(1), 735–769. https://doi.org/10.1146/annurev.physiol.66.082602.092845
2. Leontiev, O., & Buxton, R. B. (2007). Reproducibility of BOLD, perfusion, and CMRO2 measurements with calibrated-BOLD fMRI. NeuroImage, 35(1), 175–184. https://doi.org/10.1016/j.neuroimage.2006.10.044
3. Germuska, M., Merola, A., Murphy, K., Babic, A., Richmond, L., Khot, S., … Wise, R. G. (2016). A forward modelling approach for the estimation of oxygen extraction fraction by calibrated fMRI. NeuroImage, 139, 313–323. https://doi.org/10.1016/J.NEUROIMAGE.2016.06.004
4. Davis, T. L., Kwong, K. K., Weisskoff, R. M., & Rosen, B. R. (1998). Calibrated functional MRI: Mapping the dynamics of oxidative metabolism. Proceedings of the National Academy of Sciences, 95(4), 1834–1839. https://doi.org/10.1073/pnas.95.4.1834
5. Merola, A., Murphy, K., Stone, A. J., Germuska, M. A., Griffeth, V. E. M., Blockley, N. P., … Wise, R. G. (2016). Measurement of oxygen extraction fraction (OEF): An optimized BOLD signal model for use with hypercapnic and hyperoxic calibration. NeuroImage, 129, 159–174. https://doi.org/10.1016/j.neuroimage.2016.01.021
Figures