1108
Effective oxygen diffusivity mapping with multiparametric quantitative BOLD and pCASL: Comparison between healthy young and elderly subjects1School of Medicine, Department of Neuroradiology, Technical University of Munich, Munich, Germany, 2MRRC, Yale University, New Haven, CT, United States, 3School of Medicine, Department of Radiology, Technical University of Munich, Munich, Germany, 4Institute of Clinical Medicine, Aarhus University, Aarhus, Denmark, 5School of Medicine, Clinic of Neurology, Technical University of Munich, Munich, Germany
Synopsis
The effective oxygen diffusivity (EOD) of the capillary bed has gained increasing interest as a promising biomarker providing additional information on microvascular integrity. To overcome limitations in the applicability of existing and relatively complex EOD mapping techniques, we proposed a novel more easily applicable MR-based approach. We measured EOD in 16 young and 30 elderly healthy subjects. Our measurements of EOD by MRI in young subjects yielded comparably good results in comparison with PET-data as a reference. Furthermore, we found EOD reductions in elderly healthy subjects with concomitant capillary transit-time heterogeneity (CTH) increases, indicating disturbed capillary oxygen extraction ability.
Introduction
Sufficient oxygen supply is fundamental for cerebral function.1 Impaired oxygen delivery to brain tissue has been linked to various neurological diseases.2,3 A promising quantitative parameter to directly assess microvascular integrity is the effective oxygen diffusivity (EOD) of the capillary bed.4-6 While first applications of EOD in stenoocclusive disease were already presented,2,5 normal values in healthy aging are widely unknown. EOD mapping in humans was previously reported with PET-based CMRO2 and cerebral blood flow (CBF).5 A recently proposed MRI-based alternative is dual-calibrated fMRI using gas challenges.6 However, both techniques have limited availability and are rather complicated. We therefore propose a more easily applicable MRI-based EOD mapping method. We combined pseudo-continuous arterial spin labeling (pCASL) for CBF-imaging with multiparametric quantitative BOLD (mqBOLD) for oxygen extraction fraction (OEF). The aim of this study was, therefore, to characterize EOD obtained by our proposed approach. We compared MRI-based EOD values of 16 young healthy subjects (YHS) with PET-based EOD from another study. To assess EOD aging effects, we additionally evaluated data from 30 elderly healthy subjects (EHS). Furthermore, we investigated potential links between EOD and state-of-the-art capillary transit time heterogeneity (CTH),7 as CTH involvement in regulation mechanisms of capillary function has been suggested.6-8Methods
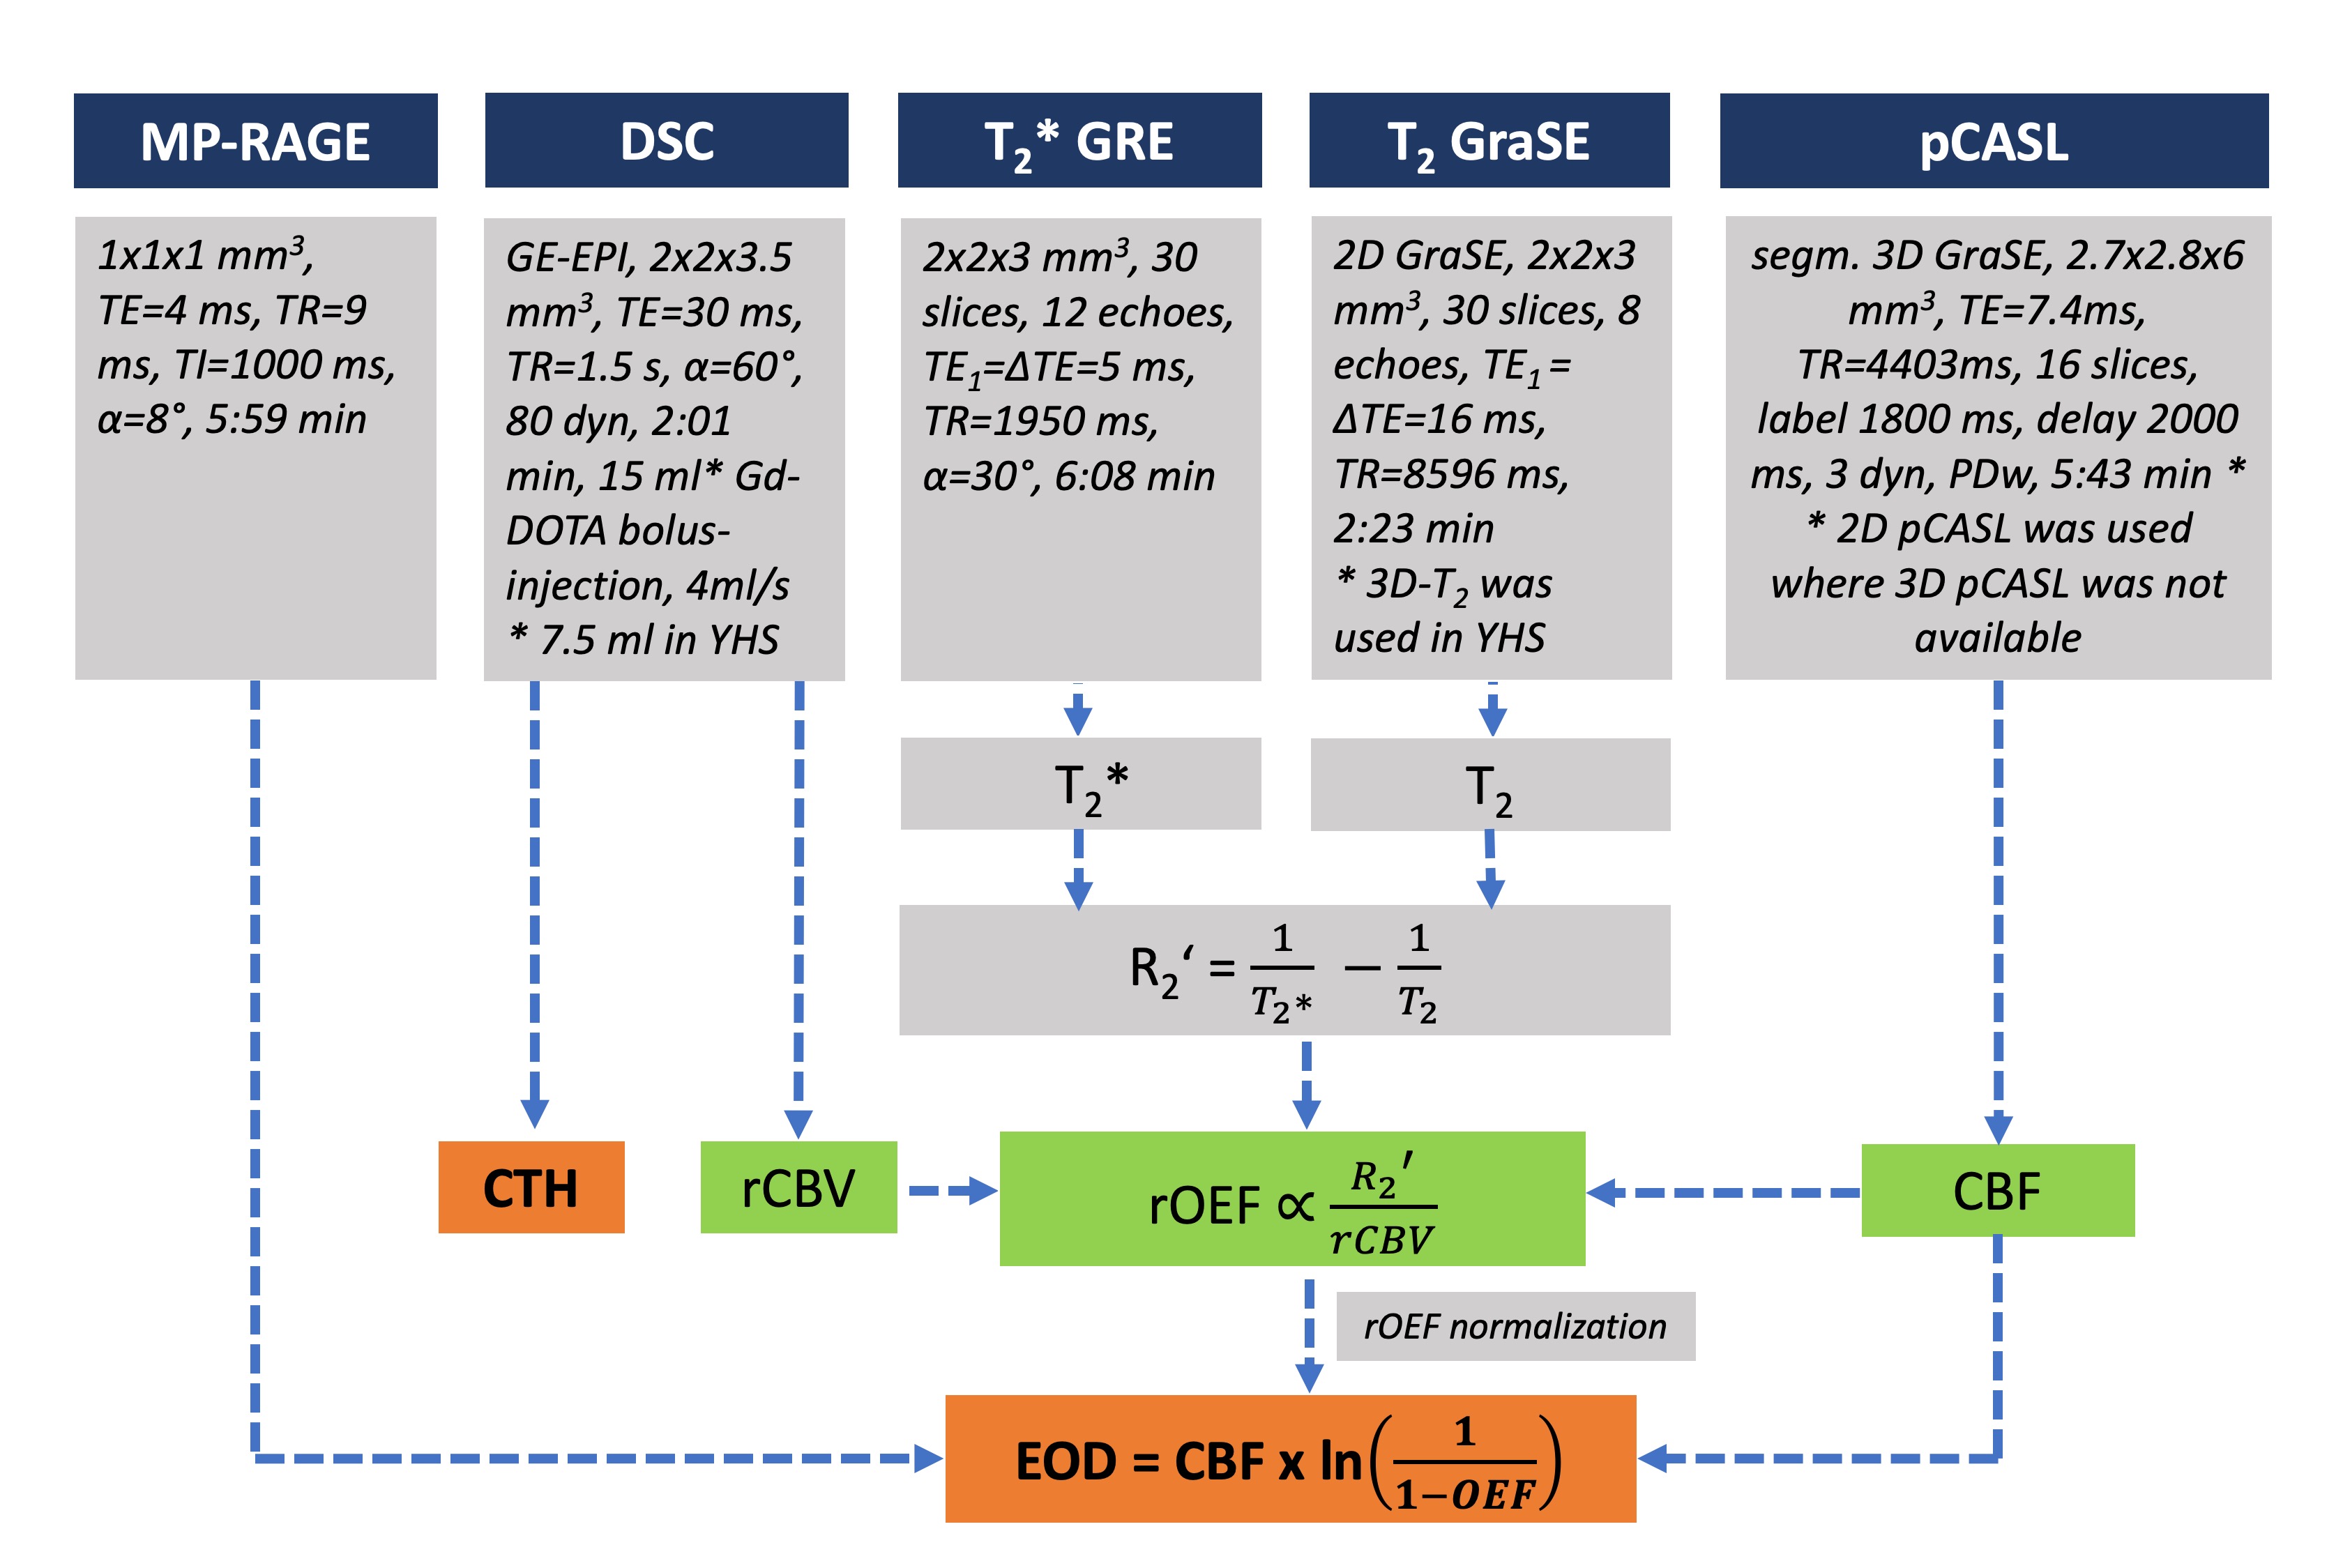
Sixteen young ($$$mean\,age=29.1±6.0\,y$$$) and 30 elderly ($$$mean\,age=70.3±7.3\,y$$$) healthy participants underwent MRI on a Philips 3T Ingenia (Philips,Best,Netherlands). Fig.1 shows details of the imaging protocol. CBF was obtained from pCASL according to consensus recommendations.9 Relative OEF (rOEF) was calculated following the mqBOLD approach,10 based on three separate measurements of T2, T2*, and relative cerebral blood volume (rCBV) from dynamic susceptibility contrast (DSC). rOEF was normalized to median gray matter (GM) OEF of 0.35,11 after excluding susceptibility artefacts ($$$R_{2}'<10\,1/s$$$)12 and remaining values >1. DSC-data were also parametrically modelled yielding CTH.7,13 EOD maps were calculated voxelwise from the resulting OEF and CBF maps according to Hyder’s model:4 $$EOD\,=\,CBF\,\cdot\,ln\left(\frac{1}{1-OEF}\right).$$ All parameter maps were coregistered to MP-RAGE and MNI-normalized. For comparisons, PET-data from another study in a similar young cohort (13 subjects, $$$mean\,age=26.1±3.8\,y$$$) was used.11 In the same way, PET-EOD maps were calculated from CBF and OEF, the latter obtained from CMRO2 and arterial oxygen content using Fick’s equation. Subject-averaged mean MR- and PET-EOD maps were compared in YHS across cortical and deep GM-VOIs from WFU PickAtlas V.3.0.5b.14 Known artefact affected regions were excluded (Brodmann areas 17,18,19).15To compare EOD and CTH, average parameter values were calculated across subjects and VOIs, and correlated in the YHS and EHS group, respectively. Aging-related changes of EOD and CTH were examined by comparing parameters from YHS and EHS across brain regions using paired t-tests, and considered statistically significant for p<0.05.
Results
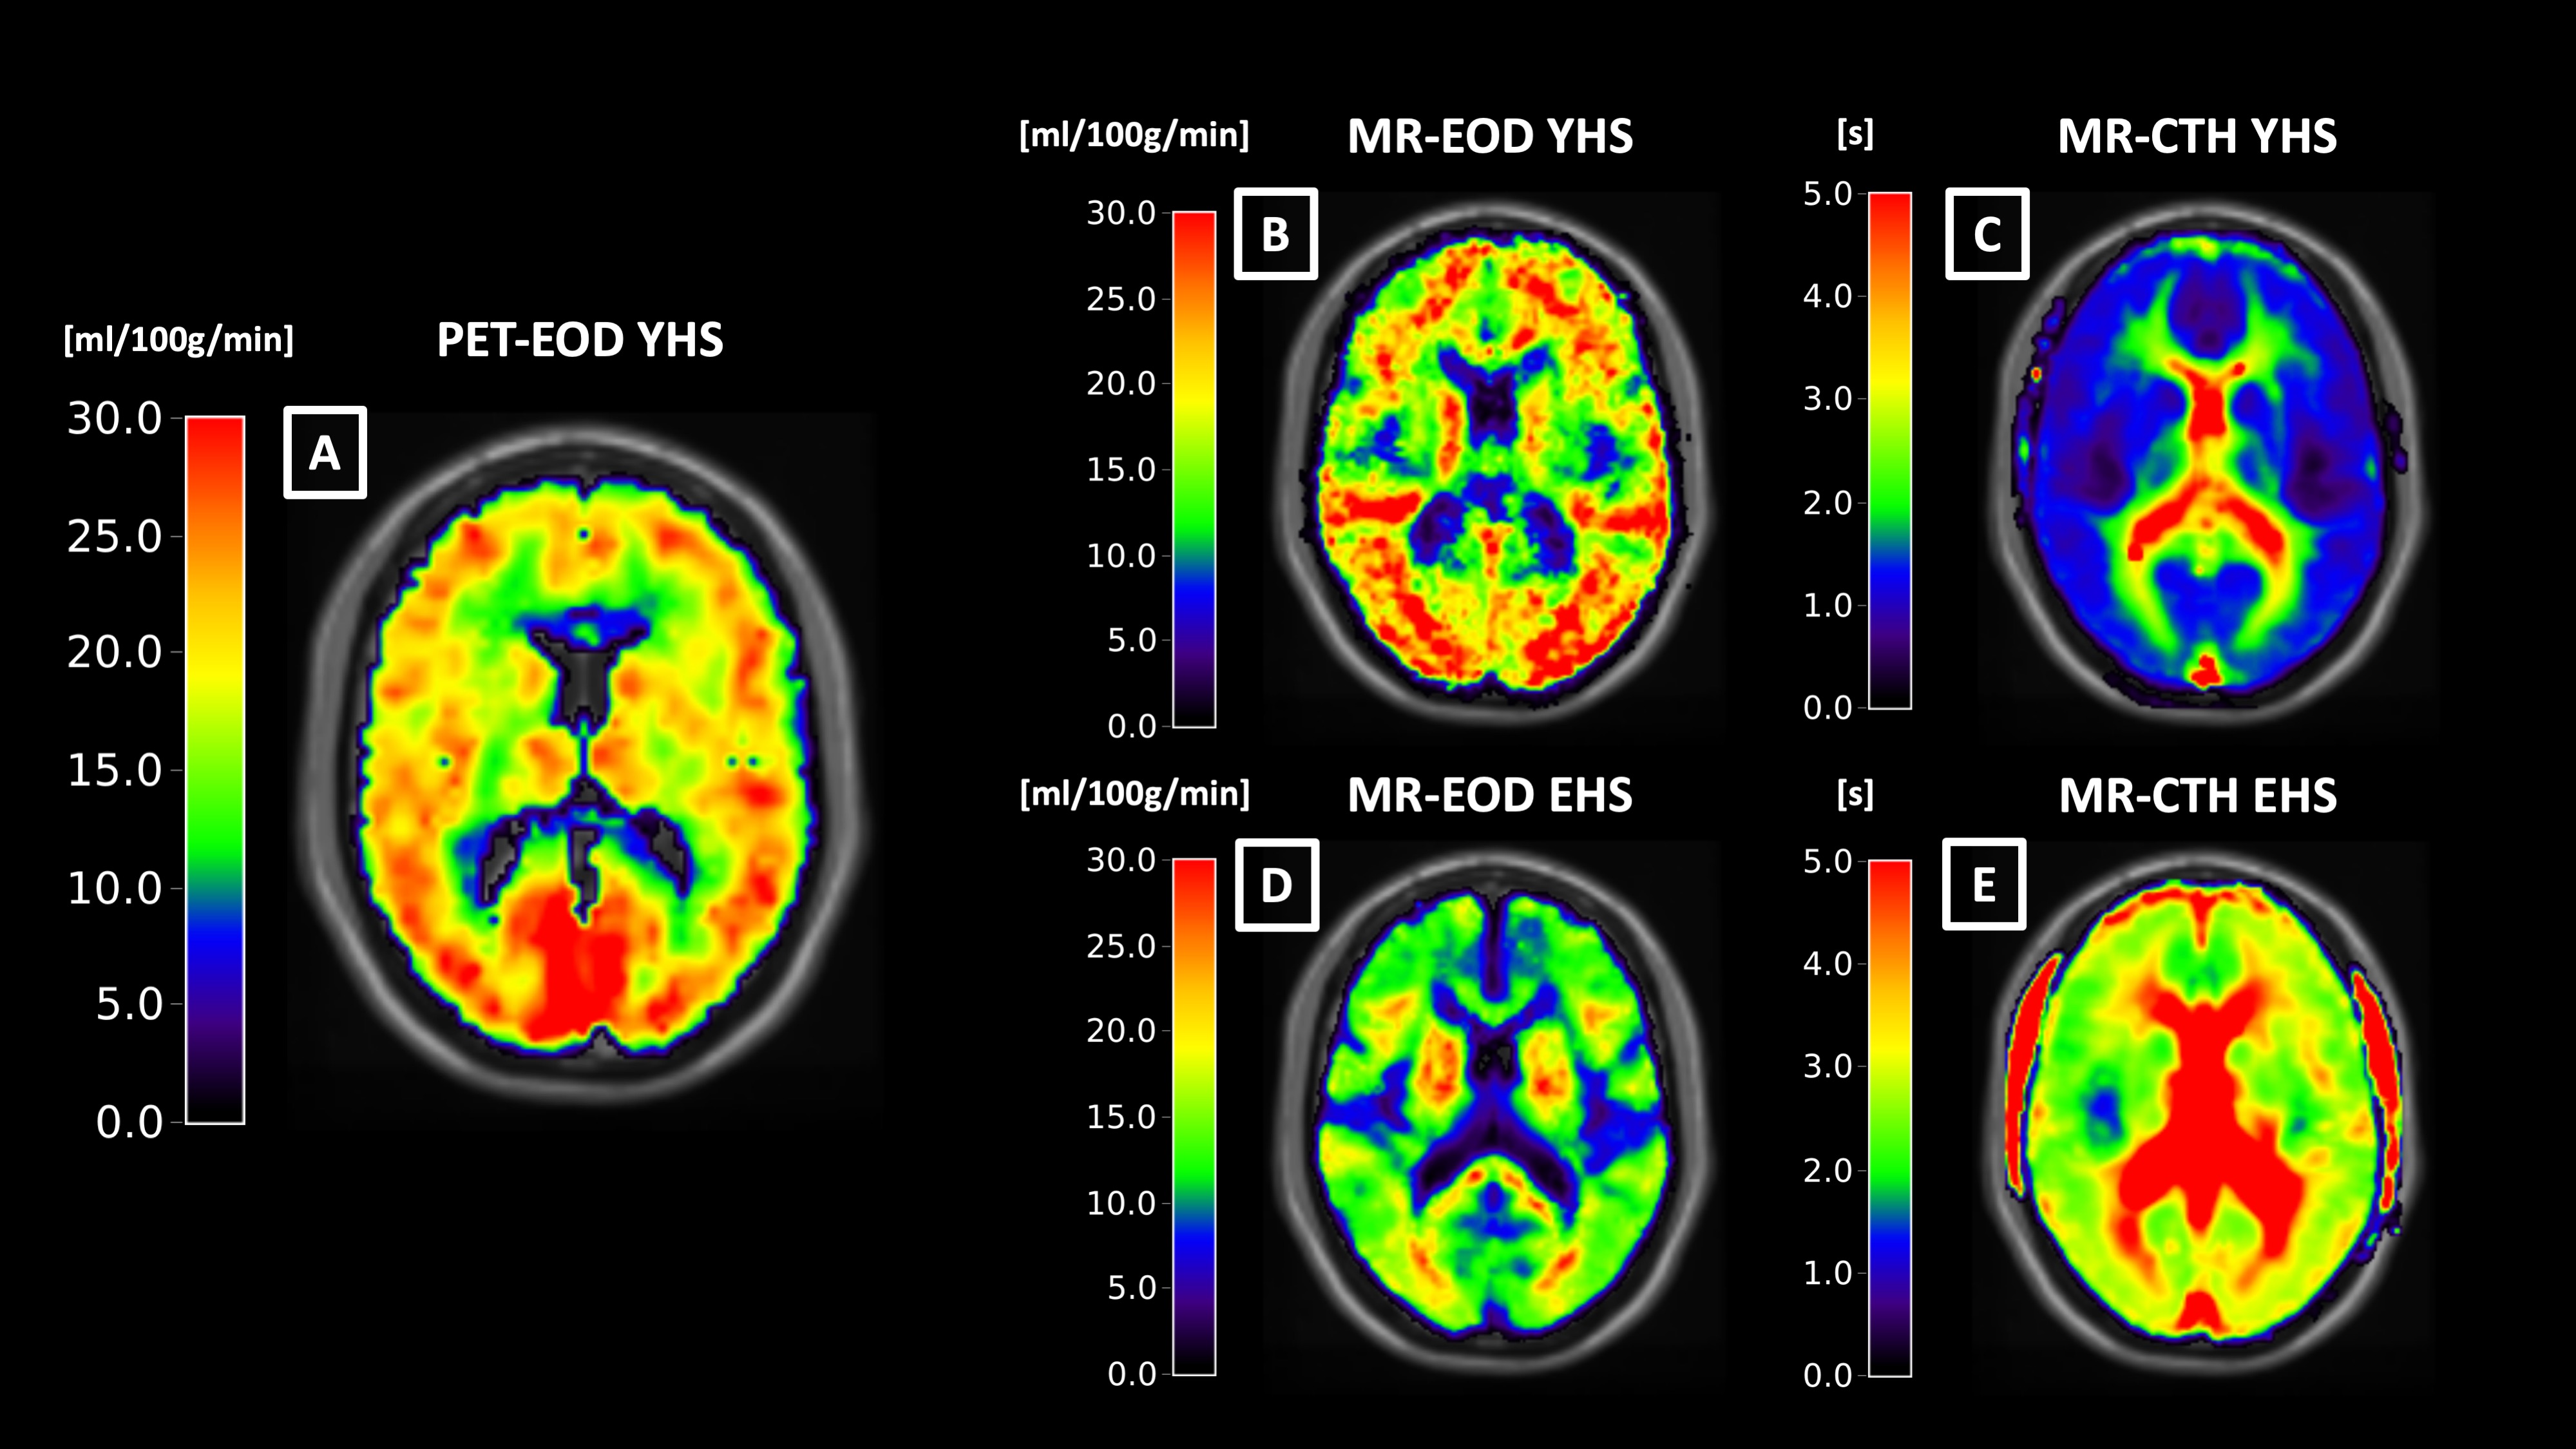
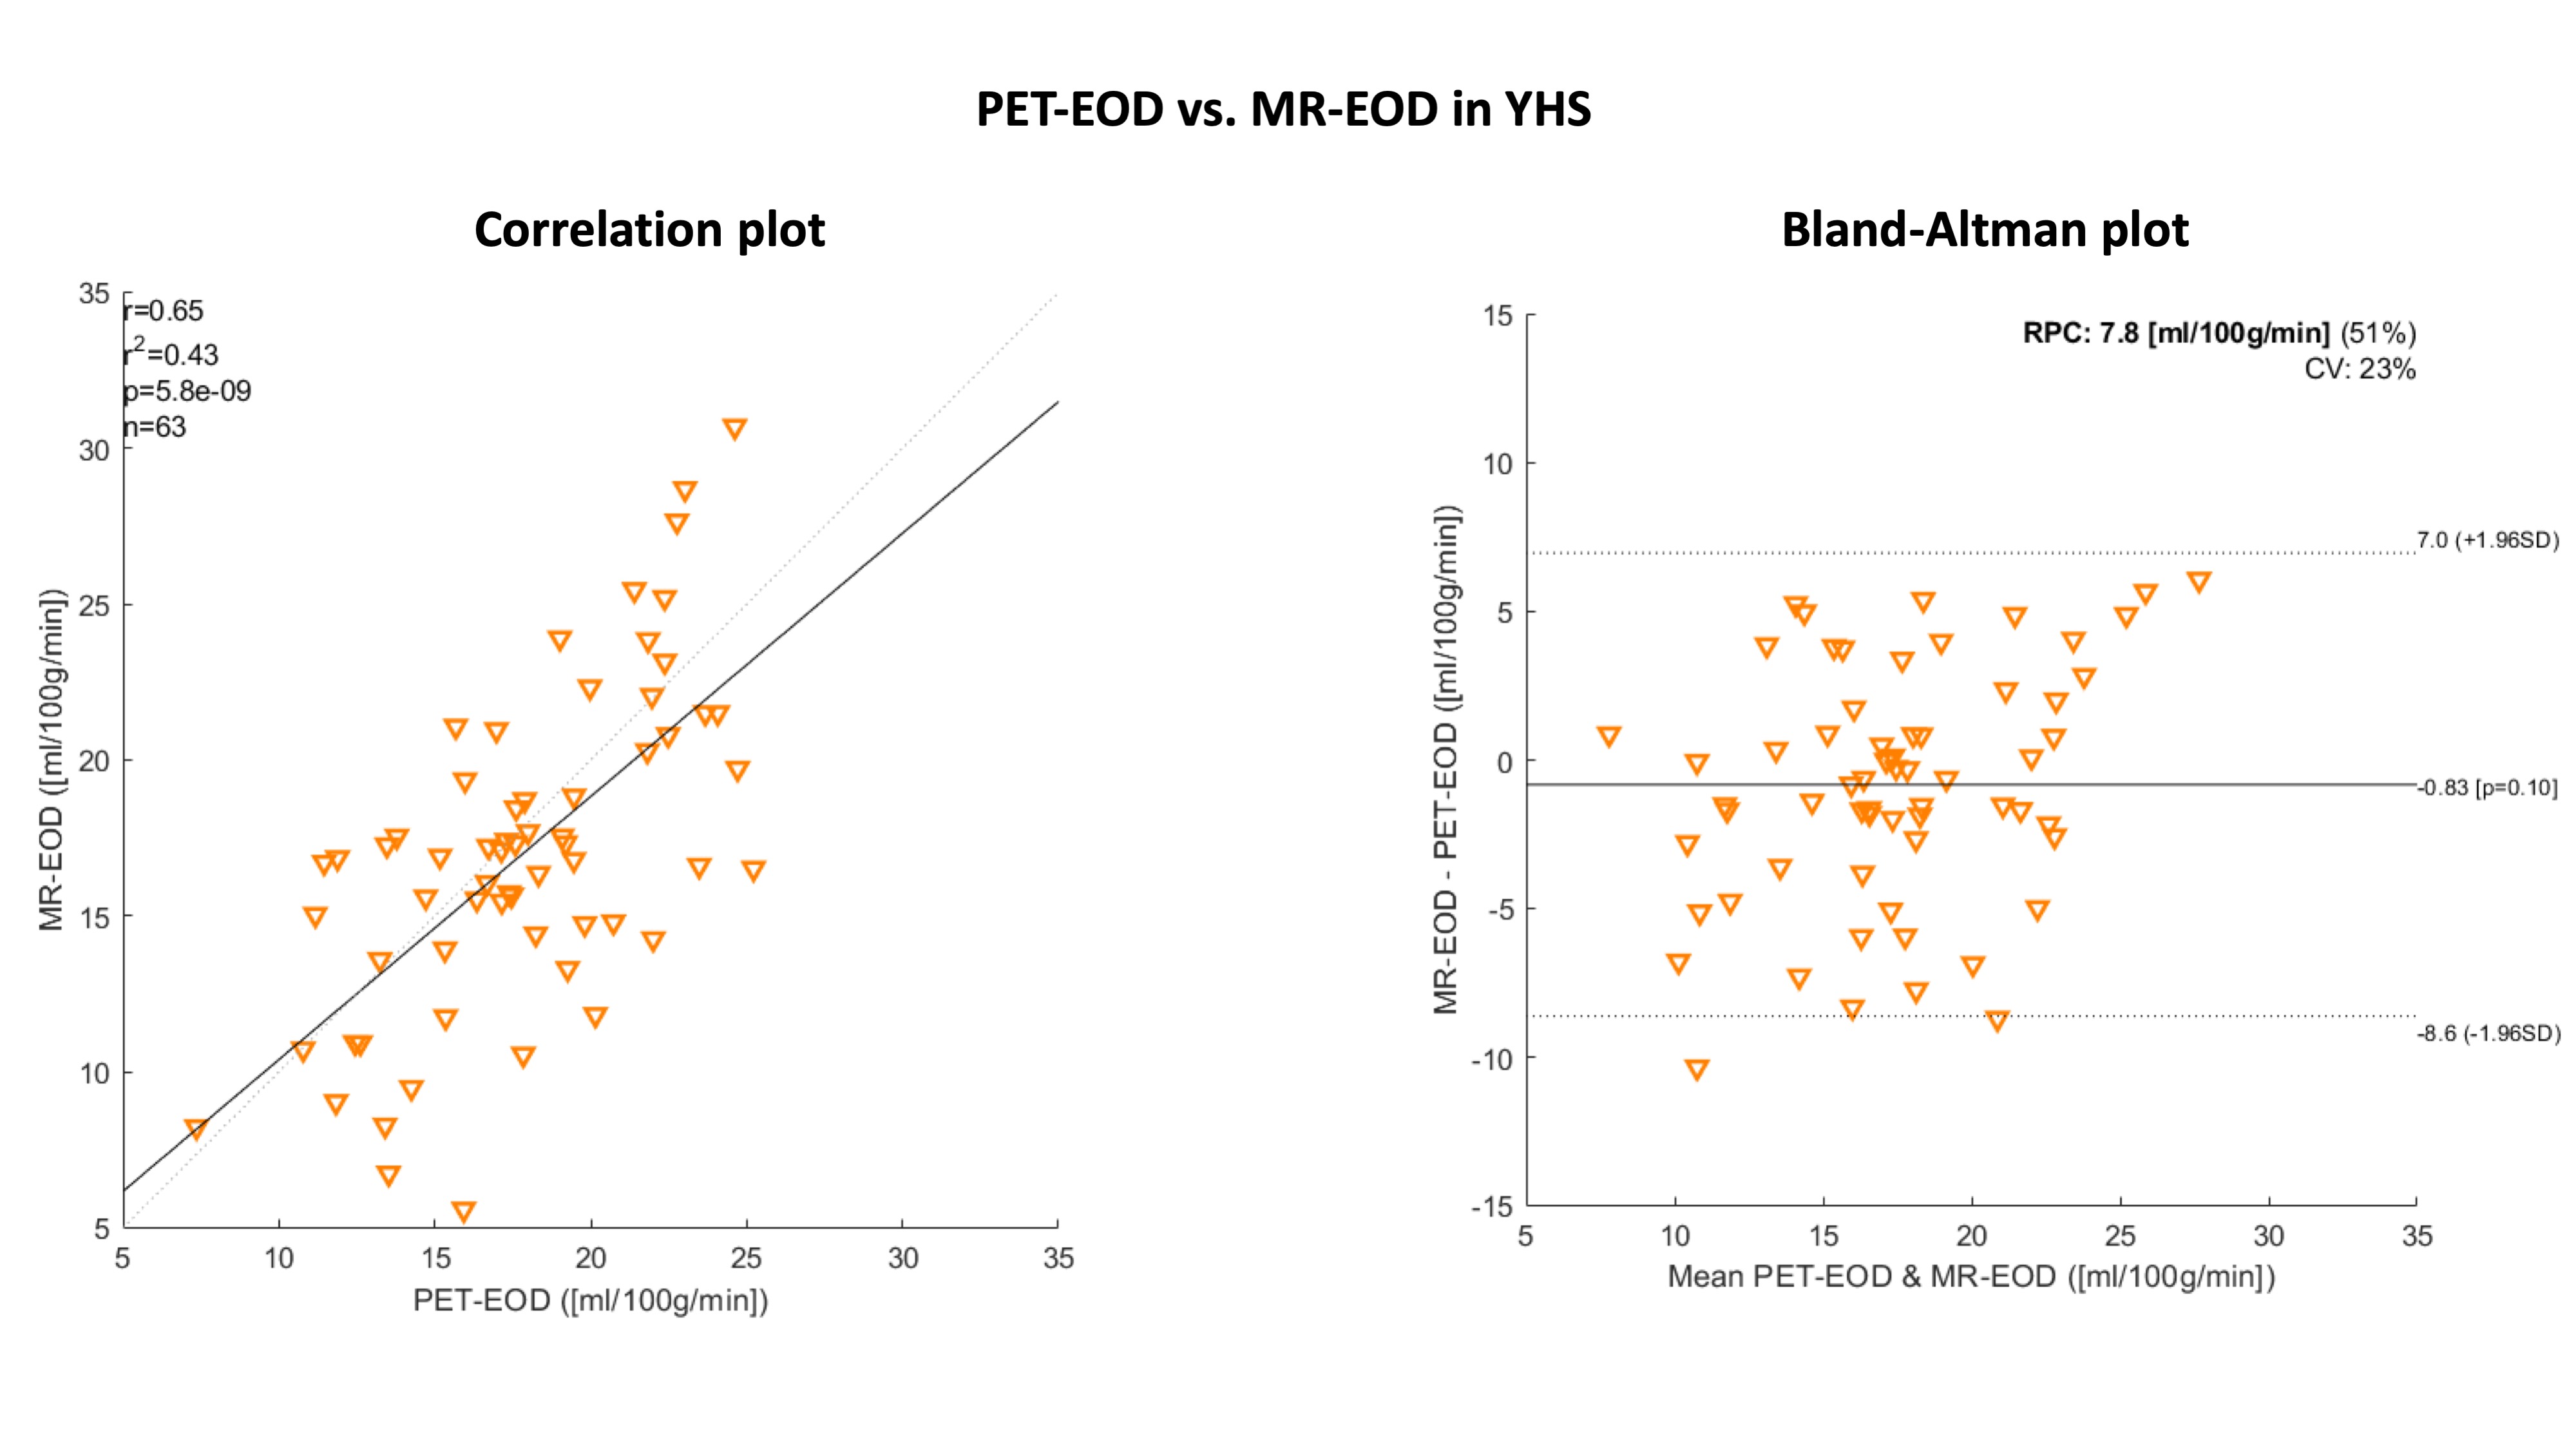
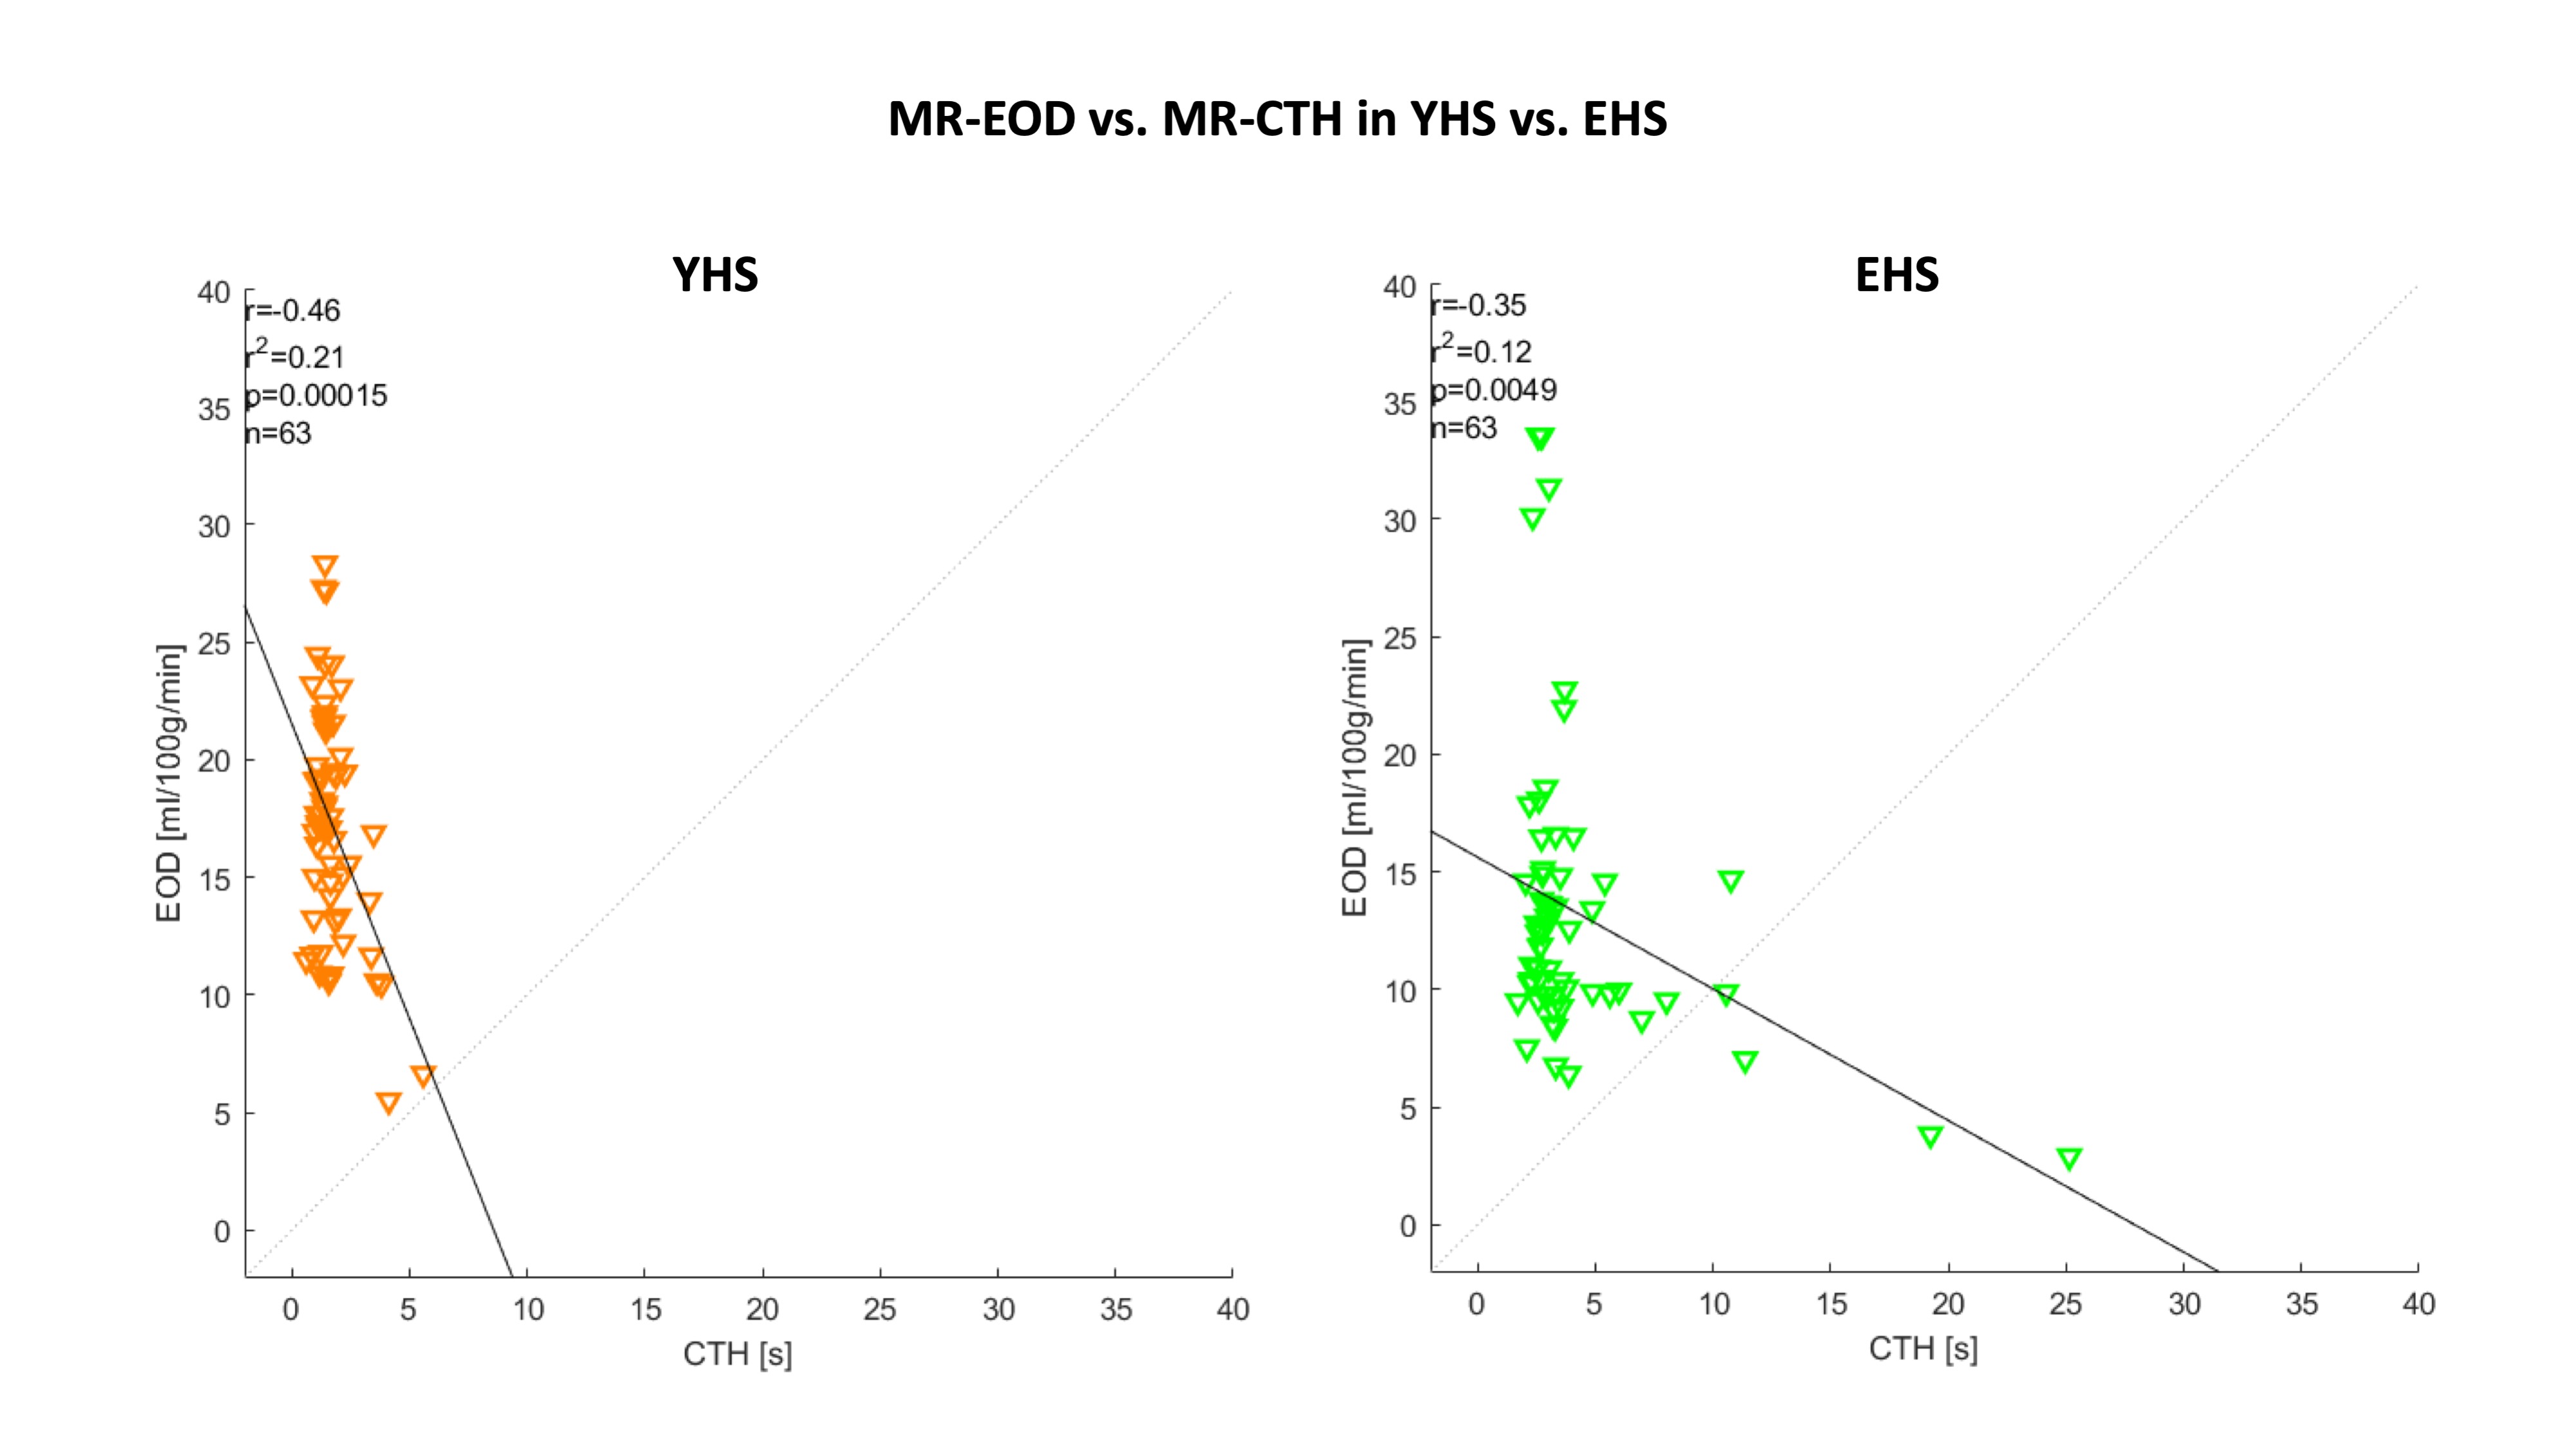
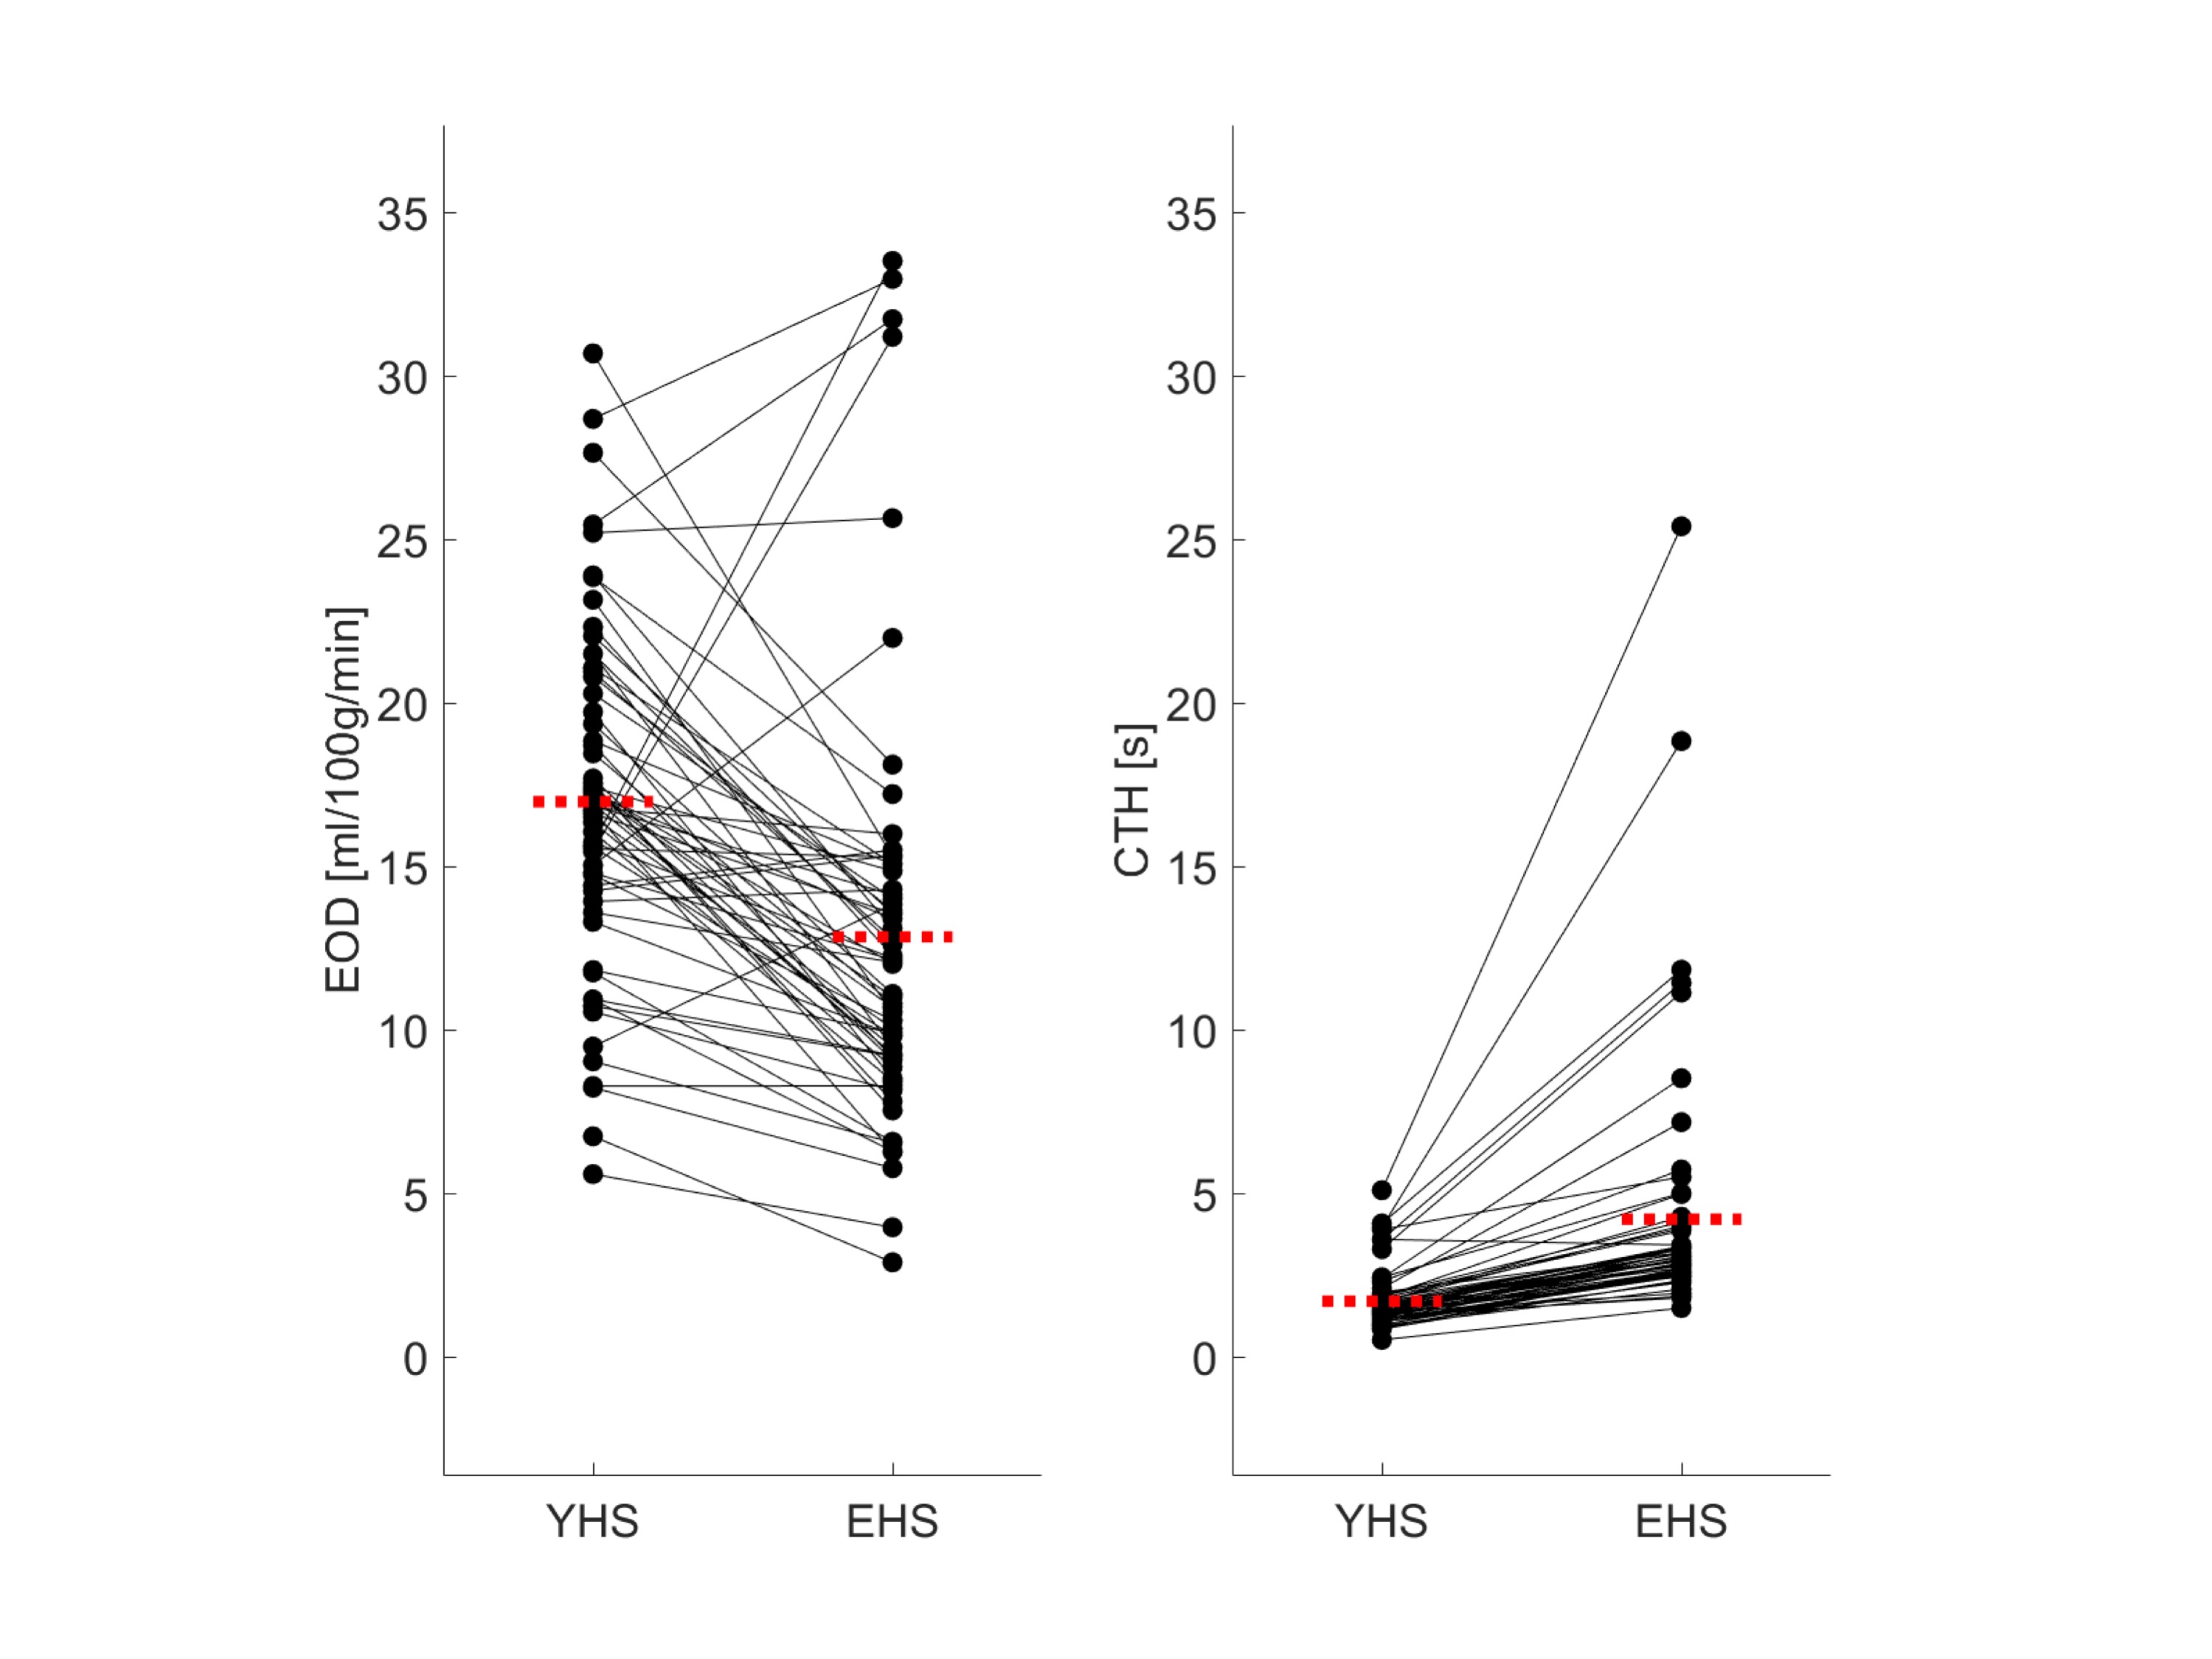
Fig.2 shows an exemplary slice of subject-averaged PET-EOD, MR-EOD, and CTH maps in YHS and EHS. PET-EOD and MR-EOD maps appear very similar. EOD values were reduced in EHS compared to YHS, while inverse changes were observed for CTH. Both PET-EOD and MR-EOD showed variability across GM, whereas CTH maps appear relatively homogeneous. Correlation analysis across VOIs revealed high accordance between PET-EOD and MR-EOD ($$$r=0.65,\,p<0.01$$$) (Fig.3). Comparisons of MR-based EOD and CTH across brain areas revealed statistically significant inverse correlations in both YHS and EHS ($$$r=-0.46$$$ and $$$r=-0.35$$$ respectively, $$$p<0.01$$$) (Fig.4). Spatial homogeneity of CTH in GM was reflected in small spread of data points along the x-axis (Fig.4). Regarding age-related changes, statistically significant decreases in EOD ($$$-23\%,\,p<0.01$$$) and increases in CTH ($$$+33\%,\,p<0.01$$$) were found in EHS compared to YHS, with YHS GM mean values of $$$CTH=1.7\,s$$$ and $$$EOD=17.0\,ml/100g/min$$$.Discussion
We successfully obtained maps of MR-EOD of the capillary bed in healthy young and elderly subjects (Fig.2). Subject-averaged MR-EOD obtained from pCASL and mqBOLD showed comparably good accordance with the PET-EOD data. Average MR-EOD in GM of YHS is in excellent agreement with PET-data reported in the literature.11 A considerable advantage of the MR-based approach presented here is better applicability and availability compared to PET5 or gas challenges6. Comparison of EOD and CTH, both promising markers related to the capillary’s oxygen extraction ability, revealed a moderate, but physiologically plausible and consistent inverse association for EHS. At constant CBF, CTH increases have been suggested to limit oxygen extraction,7 which, at the same time, implies decreased EOD as per Hyder et al.4 However, substantial differences between both parameters were additionally found. While EOD varies considerably across brain regions, CTH in GM of YHS showed low variations. EOD variance could be explained by additional mechanisms allegedly contributing to EOD regulation, amongst them increases in capillary pO2 or capillary blood volume.4 Evaluations of aging effects showed EOD decreases and CTH increases. Even stronger EOD decreases in stenoocclusive disease,2 as well as impairments of CTH in Alzheimer’s disease,3 have previously been reported. Thus, our findings demonstrating impaired microvascular integrity with aging might indicate increased vulnerability and predisposition for neurological diseases.Conclusion
We proposed a readily applicable MRI-based method for mapping effective oxygen diffusivity based on mqBOLD and pCASL. MRI-based EOD was in good agreement with PET-EOD in young healthy subjects. Furthermore, we demonstrated age-related EOD decreases with concomitantly increased CTH. Thus, combined evaluation of EOD and CTH might foster deeper insights into microvascular pathologies with high potential for future clinical applications and improved diagnostic procedures.Acknowledgements
The authors highly appreciate the support of Valentin Riedl (TUM) to measure the young healthy subject's MRI-data. We acknowledge support by the Else-Kröner-Fresenius-Stiftung, Friedrich-Ebert-Stiftung, Dr.-Ing. Leonhard-Lorenz-Stiftung (grant SK 971/19) and the German research Foundation (DFG, grant PR 1039/6-1).References
1. Siesjö, B. K. (1978). Brain energy metabolism. John Wiley & Sons.
2. J. Kufer, J. Goettler, C. Zimmer, F. Hyder, C. Preibisch, S. Kaczmarz (2019). "Effective oxygen diffusivity is ipsilaterally decreased in asymptomatic unilateral internal carotid artery stenosis.” Magn Reson Mater Phy 32(Suppl 1): 235. https://doi.org/10.1007/s10334-019-00755-1
3. Eskildsen, S. F., L. Gyldensted, K. Nagenthiraja, R. B. Nielsen, M. B. Hansen, R. B. Dalby, J. Frandsen, A. Rodell, C. Gyldensted, S. N. Jespersen, T. E. Lund, K. Mouridsen, H. Braendgaard and L. Ostergaard (2017). "Increased cortical capillary transit time heterogeneity in Alzheimer's disease: a DSC-MRI perfusion study." Neurobiol Aging 50: 107-118.
4. Hyder, F., R. G. Shulman and D. L. Rothman (1998). "A model for the regulation of cerebral oxygen delivery." Journal of Applied Physiology 85(2): 554-564.
5. Hayashi, T., H. Watabe, N. Kudomi, K. M. Kim, J.-I. Enmi, K. Hayashida and H. Iida (2003). "A Theoretical Model of Oxygen Delivery and Metabolism for Physiologic Interpretation of Quantitative Cerebral Blood Flow and Metabolic Rate of Oxygen." Journal of Cerebral Blood Flow & Metabolism 23(11): 1314-1323.
6. Germuska, M., H. L. Chandler, R. C. Stickland, C. Foster, F. Fasano, T. W. Okell, J. Steventon, V. Tomassini, K. Murphy and R. G. Wise (2019). "Dual-calibrated fMRI measurement of absolute cerebral metabolic rate of oxygen consumption and effective oxygen diffusivity." Neuroimage 184: 717-728.
7. Jespersen, S. N. and L. Ostergaard (2012). "The roles of cerebral blood flow, capillary transit time heterogeneity, and oxygen tension in brain oxygenation and metabolism." J Cereb Blood Flow Metab 32(2): 264-277.
8. Rasmussen, P. M., S. N. Jespersen and L. Ostergaard (2015). "The effects of transit time heterogeneity on brain oxygenation during rest and functional activation." J Cereb Blood Flow Metab 35(3): 432-442.
9. Alsop, D. C., J. A. Detre, X. Golay, M. Gunther, J. Hendrikse, L. Hernandez-Garcia, H. Lu, B. J. MacIntosh, L. M. Parkes, M. Smits, M. J. van Osch, D. J. Wang, E. C. Wong and G. Zaharchuk (2015). "Recommended implementation of arterial spin-labeled perfusion MRI for clinical applications: A consensus of the ISMRM perfusion study group and the European consortium for ASL in dementia." Magn Reson Med 73(1): 102-116.
10. Hirsch, N. M., V. Toth, A. Forschler, H. Kooijman, C. Zimmer and C. Preibisch (2014). "Technical considerations on the validity of blood oxygenation level-dependent-based MR assessment of vascular deoxygenation." NMR Biomed 27(7): 853-862.
11. Hyder, F., P. Herman, C. J. Bailey, A. Moller, R. Globinsky, R. K. Fulbright, D. L. Rothman and A. Gjedde (2016). "Uniform distributions of glucose oxidation and oxygen extraction in gray matter of normal human brain: No evidence of regional differences of aerobic glycolysis." J Cereb Blood Flow Metab 36(5): 903-916.
12. Kaczmarz, S., J. Gottler, C. Zimmer, F. Hyder and C. Preibisch (2019). "Characterizing white matter fiber orientation effects on multi-parametric quantitative BOLD assessment of oxygen extraction fraction." J Cereb Blood Flow Metab: 271678x19839502.
13. Mouridsen, K., M. B. Hansen, L. Ostergaard and S. N. Jespersen (2014). "Reliable estimation of capillary transit time distributions using DSC-MRI." J Cereb Blood Flow Metab 34(9): 1511-1521.
14. Maldjian, JA, Laurienti, PJ, Burdette, JB, Kraft RA. An Automated Method for Neuroanatomic and Cytoarchitectonic Atlas-based Interrogation of fMRI Data Sets. NeuroImage 2003. 19:1233-1239.
15. Zhang, K., H. Herzog, J. Mauler, C. Filss, T. W. Okell, E. R. Kops, L. Tellmann, T. Fischer, B. Brocke, W. Sturm, H. H. Coenen and N. J. Shah (2014). "Comparison of cerebral blood flow acquired by simultaneous [15O]water positron emission tomography and arterial spin labeling magnetic resonance imaging." J Cereb Blood Flow Metab 34(8): 1373-1380.
16. Bland-Altman and Correlation Plot software, Ran Klein 2010: http://www.mathworks.com/matlabcentral/fileexchange/45049-bland-altman- and-correlation-plot. Assessed Nov 9th, 2015.
Figures