1107
Probing the neuronal and vascular origins of task contrast-dependent hemodynamic response functions1Athinoula A. Martinos Center for Biomedical Imaging, Massachusetts General Hospital, Boston, MA, United States, 2Radiology, Harvard Medical School, Boston, MA, United States, 3Radiology, Stanford University, Stanford, CA, United States, 4Biomedical Engineering, Boston University, Boston, MA, United States
Synopsis
In this study, we employed concurrent EEG/fMRI to investigate the neuronal and vascular mechanisms driving task-contrast modulation of HRF shapes. Our results demonstrated that HRFs vary as a function of task contrast levels. Briefly, HRFs elicited by high-contrast stimuli exhibited delayed time-to-peaks and stronger post-stimulus undershoots that likely arose from neuronal origins, and wider full-width-at-half-maximums that were possibly driven by vascular changes.
Introduction
The canonical hemodynamic response function (HRF), initially characterized following strong sensory stimuli, has been universally applied to infer neural activity from the blood-oxygenation-level-dependent (BOLD) fMRI response for a wide variety of sensory, motor, and cognitive paradigms. Yet, it remains unclear if this widely-assumed timing of the neuro-hemodynamic coupling changes with the intensity of neuronal activity, e.g. as a function of task contrast level. This question is relevant for accurately modeling fMRI dynamics in the resting state or in naturalistic stimuli/tasks (e.g., movie watching) which likely comprises several contrast levels that change with time. In this study, we employed concurrent EEG/fMRI to characterize how the HRF varies as a function of task-contrast level and investigated possible neuronal and vascular mechanisms that may cause contrast-dependent HRF alterations.Methods
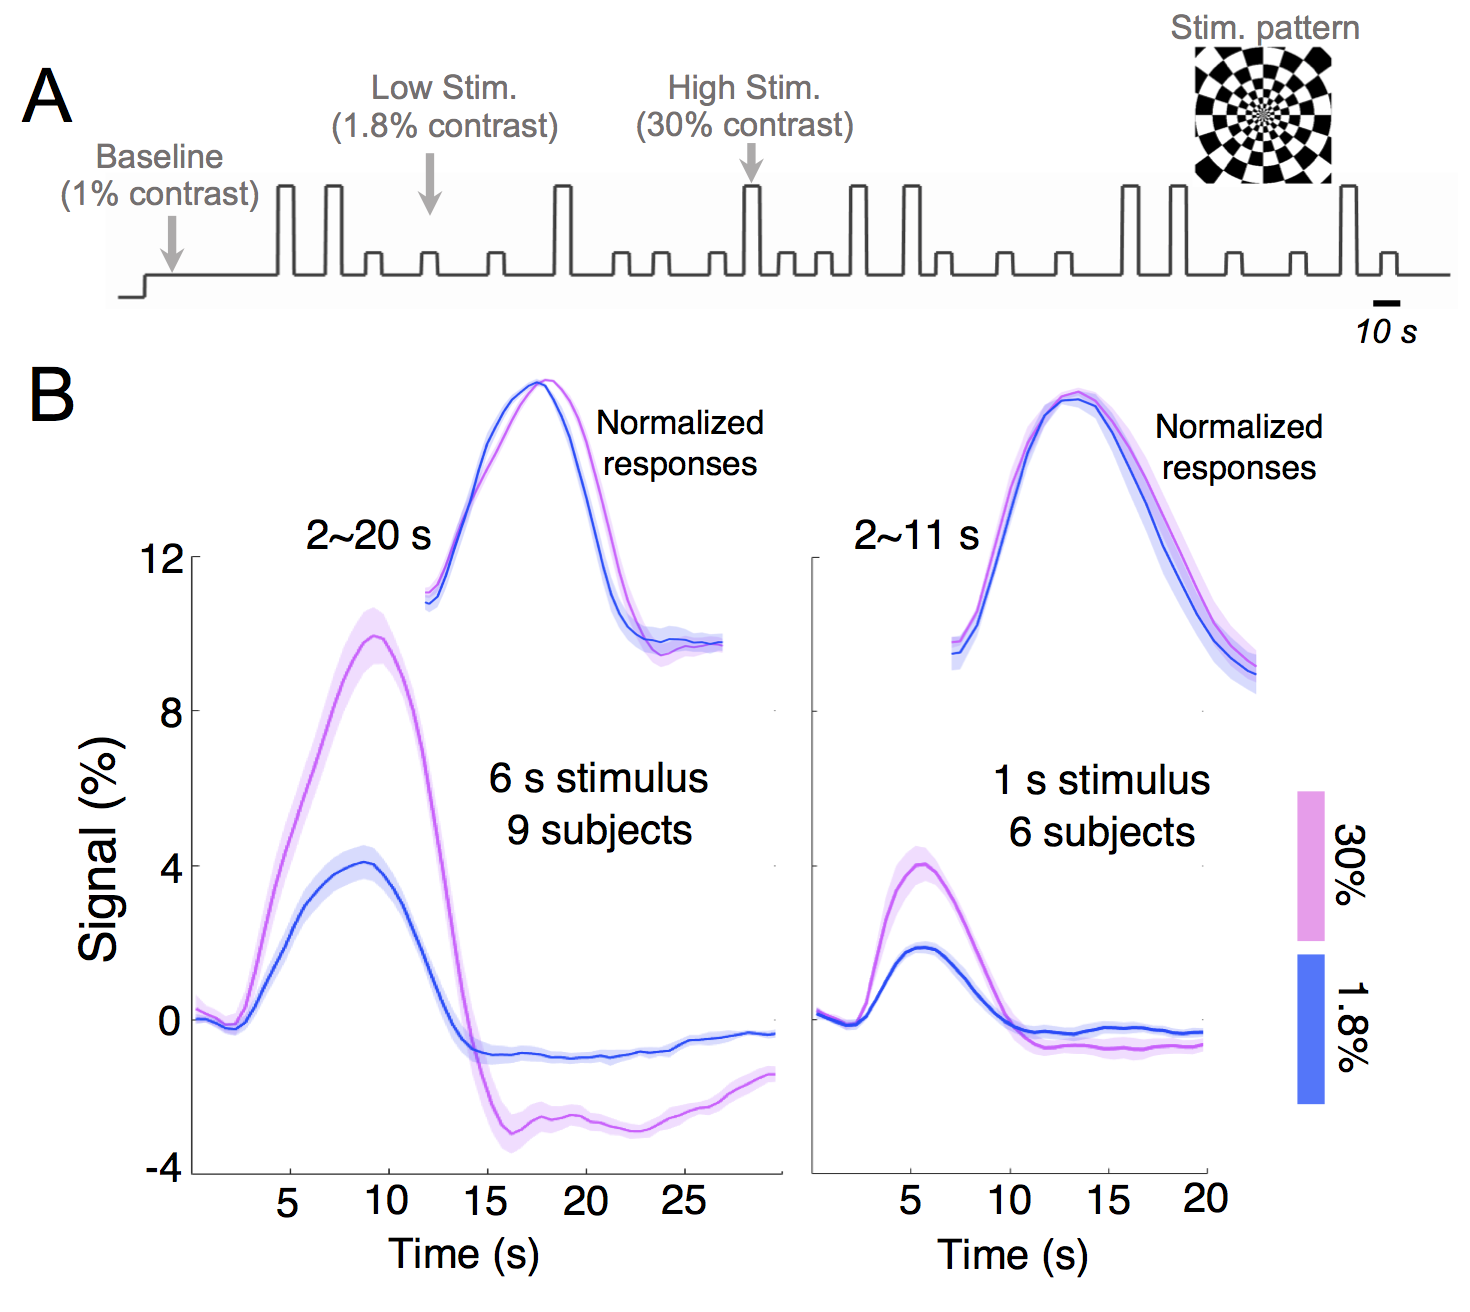
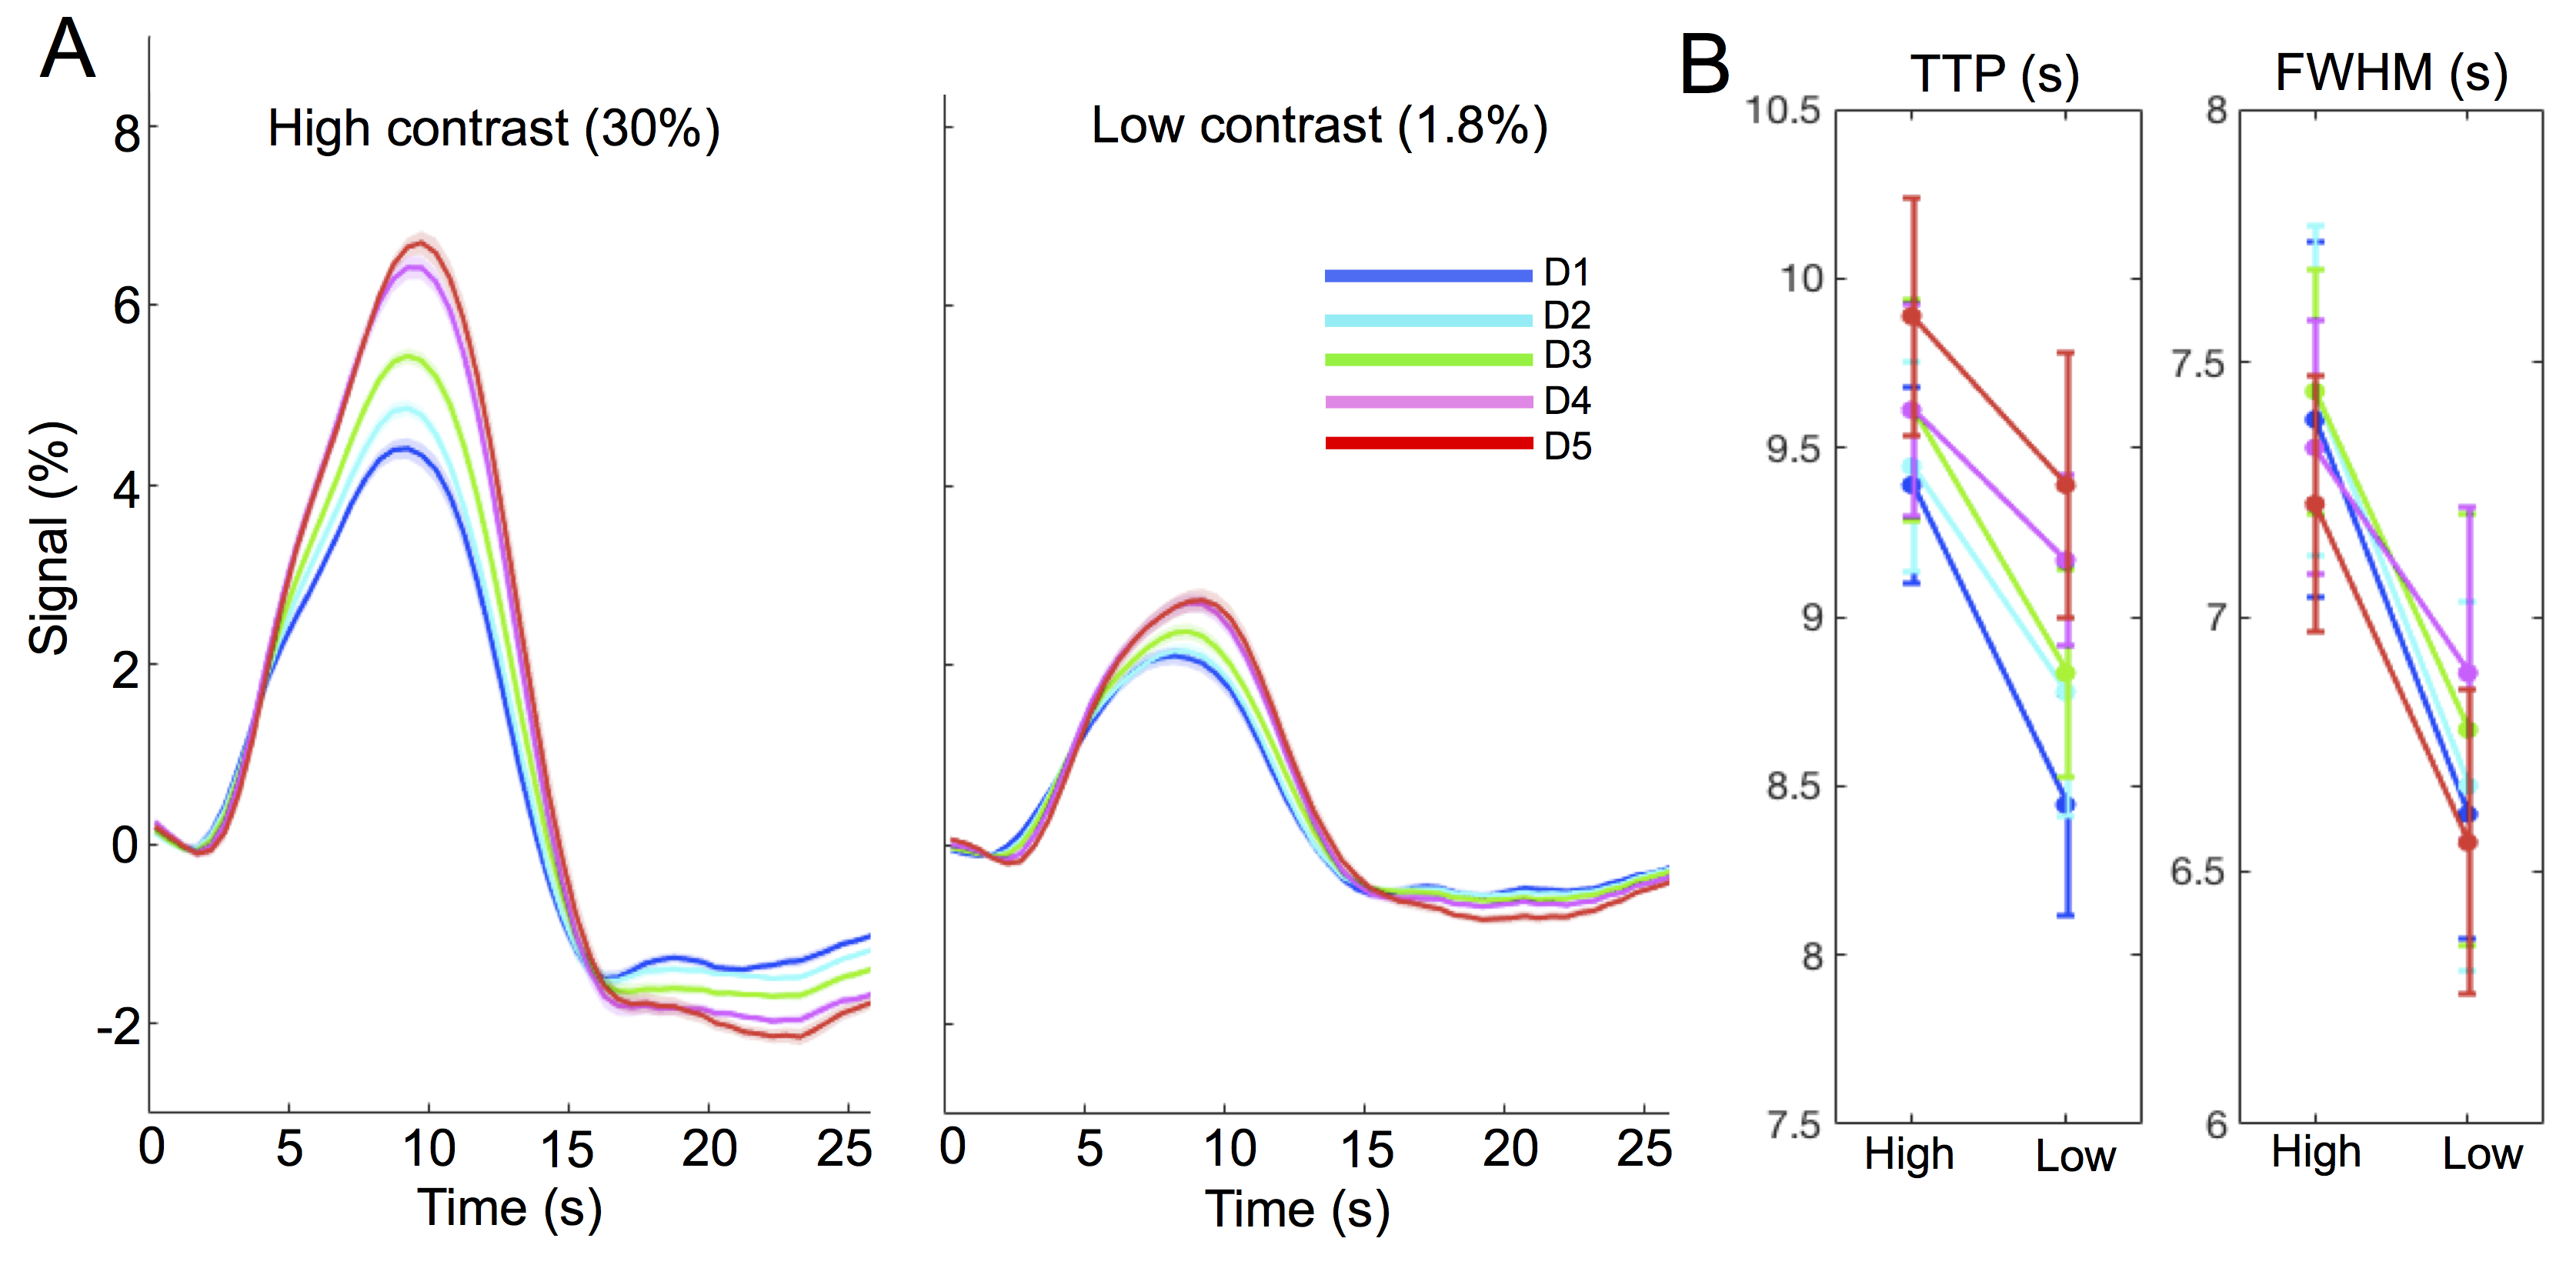
Experiments: Visual stimuli were presented in an event-related paradigm (radial checkerboards flickering at 7.5 Hz, inter-trial-intervals randomly jittered between 5–20 s) to map occipital HRFs associated with high and low contrast levels (Fig. 1A). Because of the known nonlinearity of the HRF1,2, contrast-dependent hemodynamic changes were evaluated at both short (1 s) and long (6 s) trial lengths. Nine subjects each underwent 4–7 6-s-trial scans during the 1st study visit, while a subset of six subjects returned for additional 6–10 1-s-trial scans during a 2nd visit. Acquisition: fMRI data were collected on a 3T Siemens Prisma scanner: TR/TE = 857/34 ms, voxel size = 1.23×1.23×1.5 mm3, 10 slices. HRFs of graded contrast levels: After motion/slice timing correction and across-scan registration, the fMRI time series was resampled to a 0.5 s temporal grid; voxel-wise HRFs for different task contrasts and trial lengths were derived using the finite impulse response deconvolution approach. Contrast-dependent hemodynamic changes as a function of cortical depth: Given the distinct vascular anatomy of the pial surface and parenchyma, we further examined if such contrast modulations of HRF shapes differed across cortical depths. Surface-based cortical depth estimation was performed using a T1-weighted anatomical reference (MPRAGE). Normalized cortical depth (‘0%’:white matter; ‘100%’:pial) of each EPI voxel was computed according to its centroid coordinate3. Task-active voxels (F score > 10) were separated into five groups based on their normalized cortical depths (D1:0–40%, D2:40–80%, D3:80–120%, D4:120–160%, D5:160–200%, where depths >100% denote locations above the cortex); mean responses within each cortical depth were computed for depth-dependent comparisons. Contrast-dependent electrophysiological changes: For long-duration trials, contrast-dependent neuronal differences (e.g., adaptation or attentional modulation4), if they exist, will also manifest in fMRI signal modulations. To gauge potential neural contributions to observed HRF differences, concurrent EEG signals were recorded and analyzed for six subjects participating in the 6-s-trial scans. The power in the canonical alpha bands (8–12 Hz) and steady-state visually-evoked potentials (SSVEPs) were compared across contrast levels.Results & Discussion
1. Contrast-dependent hemodynamic changes (Fig. 1): HRFs of lower contrast levels exhibited narrower dispersions (reduced full-width-at-half-maximum (FWHM)). Long-duration stimuli resulted in more prominent HRF differences across contrasts, and faster time-to-peak (TTP) were only evident for HRFs elicited by 6-s trials.2. Pial vs. parenchyma (Fig. 2): For both contrast levels, HRFs at the pial surface and above lagged those of deeper cortical depths, agreeing with previous reports5,6 (Fig. 2A). We further observed that contrast-dependent HRF alterations (reduced TTPs and FWHMs) were consistent across cortical depths (Fig. 2B), implying that the contrast modulation of HRF shapes ought to be considered for fMRI acquisitions at both high and low spatial resolutions.
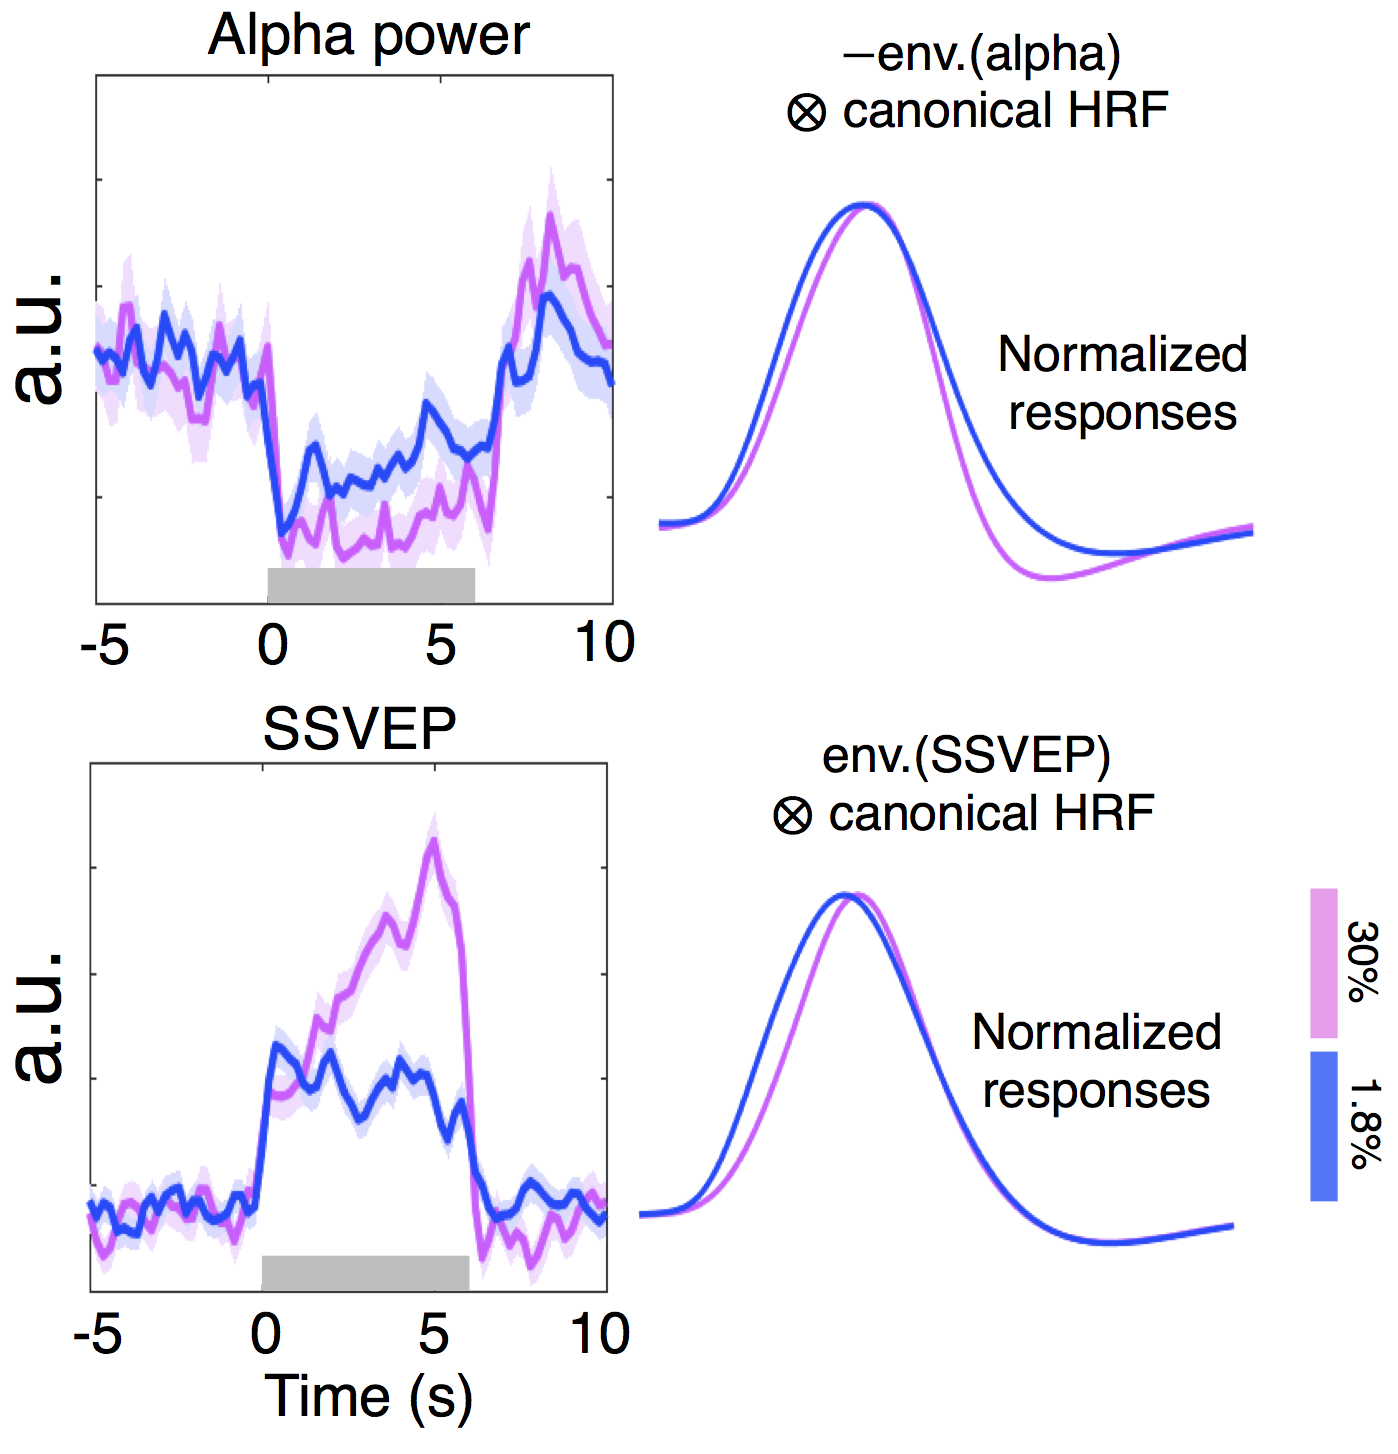
3. Contrast-dependent electrophysiological changes (Fig. 3): Alpha desynchronization during stimulation was concordant between two contrast levels, except for a slightly more pronounced overshoot following high-contrast stimuli; this may reflect the previously reported relevance of alpha power and HRF undershoot7 and explain a diminished HRF undershoot coupling to low-contrast stimuli (Fig. 1B, ‘6 s stimulus’). Unlike the low-contrast case, SSVEPs associated with the high-contrast stimuli increased throughout the stimulation period, which may reflect an increasing attentional load4. While such SSVEP differences may explain the observed faster TTPs of lower-contrast HRFs (Fig. 1B, ‘6 s stimulus’), these EEG differences predicted an opposite effect on FWHMs of HRFs than we observed in our fMRI measurements, suggesting the presence of contrast-dependent vascular changes driving changes in the dispersion of HRFs.
Conclusion
Collectively, we have demonstrated that HRFs vary as a function of task contrast levels; the modulation is more pronounced for long-duration stimuli, and is consistent across cortical depths. Stimuli with higher contrasts could lead to stronger post-stimulus overshoot of alpha power and elevated SSVEPs, suggesting that differences in neural activity may underlie the more prominent post-stimulus undershoot and delayed TTPs in high-contrast stimuli. Additionally, contrast-dependent changes in FWHMs likely stem from vascular origins, agreeing with previous simulations8, suggesting hemodynamic effects lead to narrower HRFs in response to low-contrast stimuli.Acknowledgements
This work was supported in part by the NIH NIBIB (grants P41-EB015896 and R01-EB019437), by the NIH NIMH (grants R01-MH111438, R01-MH111419 and R00-MH111748), and by the MGH/HST Athinoula A. Martinos Center for Biomedical Imaging; and was made possible by the resources provided by NIH Shared Instrumentation Grants S10-RR023043 and S10-RR019371.References
[1] Boynton, G. M., Engel, S. A., Glover, G. H., & Heeger, D. J. (1996). Linear systems analysis of functional magnetic resonance imaging in human V1. Journal of Neuroscience, 16(13), 4207-4221.
[2] Vazquez, A. L., & Noll, D. C. (1998). Nonlinear aspects of the BOLD response in functional MRI. Neuroimage, 7(2), 108-118.
[3] Polimeni, J. R., Renvall, V., Zaretskaya, N., & Fischl, B. (2018). Analysis strategies for high-resolution UHF-fMRI data. Neuroimage, 168, 296-320.
[4] Kim, Y. J., Grabowecky, M., Paller, K. A., Muthu, K., & Suzuki, S. (2007). Attention induces synchronization-based response gain in steady-state visual evoked potentials. Nature neuroscience, 10(1), 117.
[5] Tian, P. et al. (2010). Cortical depth-specific microvascular dilation underlies laminar differences in blood oxygenation level-dependent functional MRI signal. Proceedings of the National Academy of Sciences, 107(34), 15246-15251.
[6] Siero, J. C., Petridou, N., Hoogduin, H., Luijten, P. R., & Ramsey, N. F. (2011). Cortical depth-dependent temporal dynamics of the BOLD response in the human brain. Journal of Cerebral Blood Flow & Metabolism, 31(10), 1999-2008.
[7] Mullinger, K. J., Cherukara, M. T., Buxton, R. B., Francis, S. T., & Mayhew, S. D. (2017). Post-stimulus fMRI and EEG responses: Evidence for a neuronal origin hypothesised to be inhibitory. NeuroImage, 157, 388-399.
[8] Chen, J. E., & Glover, G. H. (2015). BOLD fractional contribution to resting-state functional connectivity above 0.1 Hz. Neuroimage, 107, 207-218.
Figures