1106
Correcting hemodynamic crosstalk effects in fluorescent fiber-photometry signals for quantitative neurovascular coupling studies1Center for Animal MRI, The University of North Carolina at Chapel Hill, Chapel Hill, NC, United States, 2Biomedical Research Imaging Center, The University of North Carolina at Chapel Hill, Chapel Hill, NC, United States, 3Department of Neurology, The University of North Carolina at Chapel Hill, Chapel Hill, NC, United States, 4Department of Statistics, The University of North Carolina at Chapel Hill, Chapel Hill, NC, United States, 5Neurobiology Branch, NIEHS/NIH, RTP, NC, United States
Synopsis
The number of fiber-photometry studies incorporating fMRI are rapidly increasing, as these compatible modalities have the ability to reveal neuronal ground-truths. We recently noticed that photometry recording suffers from hemodynamic contamination, leading to false negative results. In this study, we 1) demonstrate how changes in cerebrohemodynamics can yield false negative GCaMP data, 2) propose a method to derive HbO and HbR from spectrally resolved fiber-photometry, 3) validate the derive hemodynamic parameters against concurrently measured CBV and BOLD using photometry and fMRI, 4) implement the proposed correction in vivo, and 5) apply corrected photometric results to rapidly derive hemodynamic response functions.
Introduction
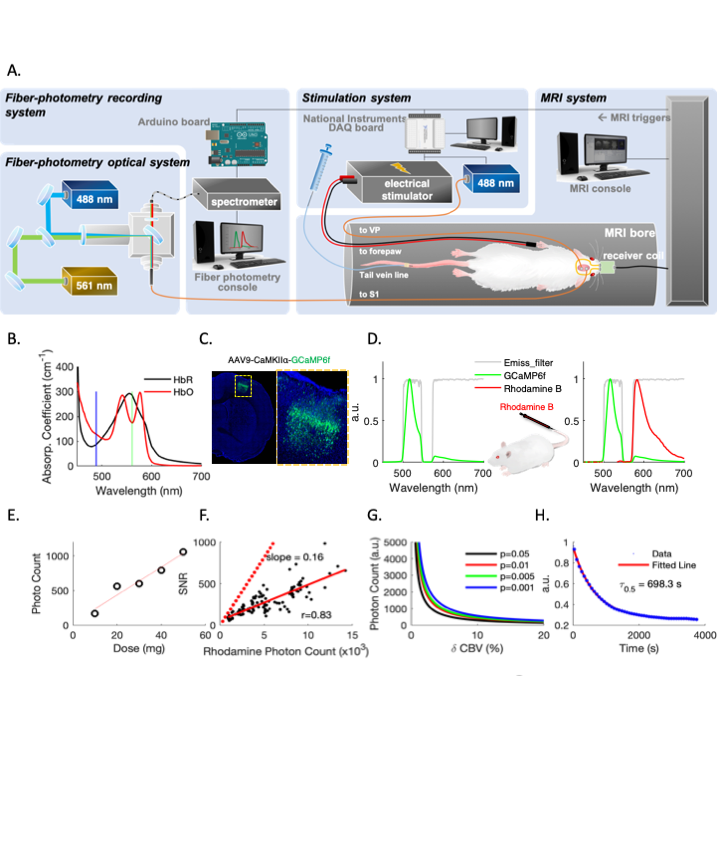
Fiber-photometry employs chronically implanted optical fibers to detect signals from genetically encoded fluorescent sensors, such as GCaMP, in targeted brain areas with high sensitivity and specificity. Given its rapidly increasing use in neuroscience1,2and fMRI due to its impeccable MR-compatibility3–10, understanding the confounding factors is paramount. One possible cause of fluorescent signal distortion is the hemodynamic contamination, whereby the excitation and emission photons are absorbed by hemoglobins. Local hemoglobin concentrations change over time, and oxygenated-hemoglobin (HbO) and deoxygenated-hemoglobin (HbR) absorbance differ significantly at different wavelengths of light (Fig. 1B) 11, meaning this contamination cannot be corrected by simply regressing out a single factor like CBV. In this study, we 1) demonstrate how changes in cerebrohemodynamics can yield false negative GCaMP data, 2) propose a method to derive HbO and HbR from spectrally resolved fiber-photometry, 3) validate the derived hemodynamic parameters against concurrently measured CBV and BOLD using photometry and MRI, 4) implement the proposed correction in vivo, and 5) demonstrate its application by rapidly deriving a hemodynamic response function (HRF) that could add knowledge to neurovascular coupling and aid fMRI data interpretation.Methods
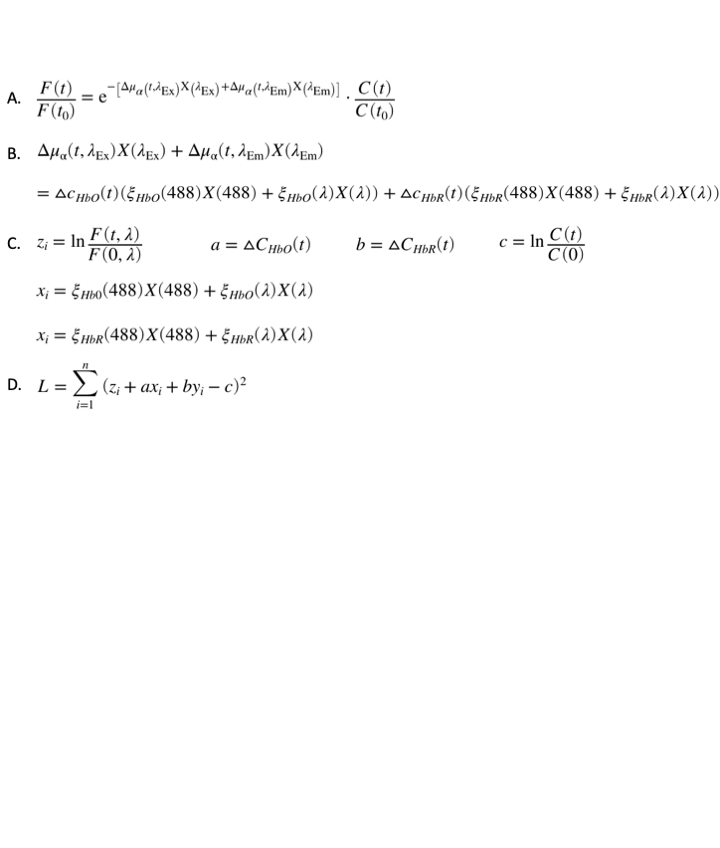
Spectrally resolved fiber-photometry platform (Fig. 1A) is similar to what we previously used 1,12. Briefly, 488nm and 561nm lasers are used for excitation. The emission fluorescent photons are counted by the high-resolution spectrometer. Dual-band emission filter that allows 500-545nm and 575-705nm light to pass was used to measure GCaMP6f and CBV changes (Fig. 1D). For photometry-based CBV measurements, Rhodamine-B was injected intravenously (40mg/kg). Animals: Eight Sprague-Dawley rats received either AAV9-CaMKIIα-EYFP or AAV9-CaMKIIα-GCaMP6f in primary somatosensory cortex (Fig.1C). EYFP group rats were recorded with fiber-photometry only. GCaMP group rats underwent simultaneous fiber-photometry and fMRI recordings. In both groups, forepaw electrical stimulations and hypercapnia challenges were given during data recording. MRI: All MRI data were collected in a Bruker BioSpec 9.4T animal MRI system with a custom-built surface coil. Rats were ventilated with 0.5% isoflurane and medical air. Intraperitoneal infusion of dexmedetomidine and pancuronium bromide were given for the duration of scan. A single-shot GE-EPI sequence (TR/TE= 1000/14ms, matrix=80x80) was used for BOLD fMRI. Hemodynamic contamination correction: All equations used for correction were given in Fig.4. The changes of HbO and HbR concentrations (DHbO and DHbR) at each time point were first derived from multispectral data, then applied back to calculate the corrected EYFP and GCaMP6f.Results
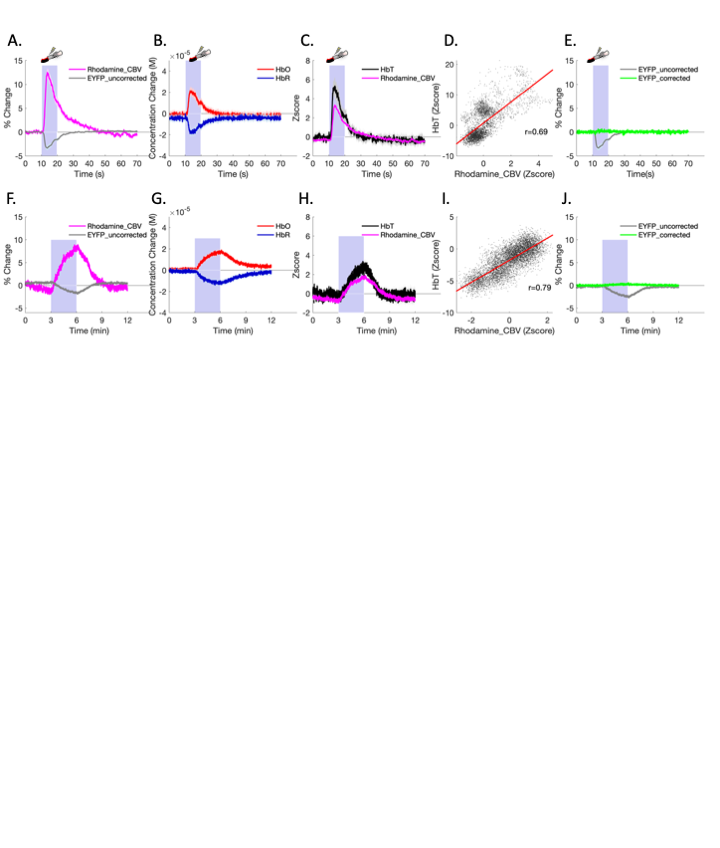
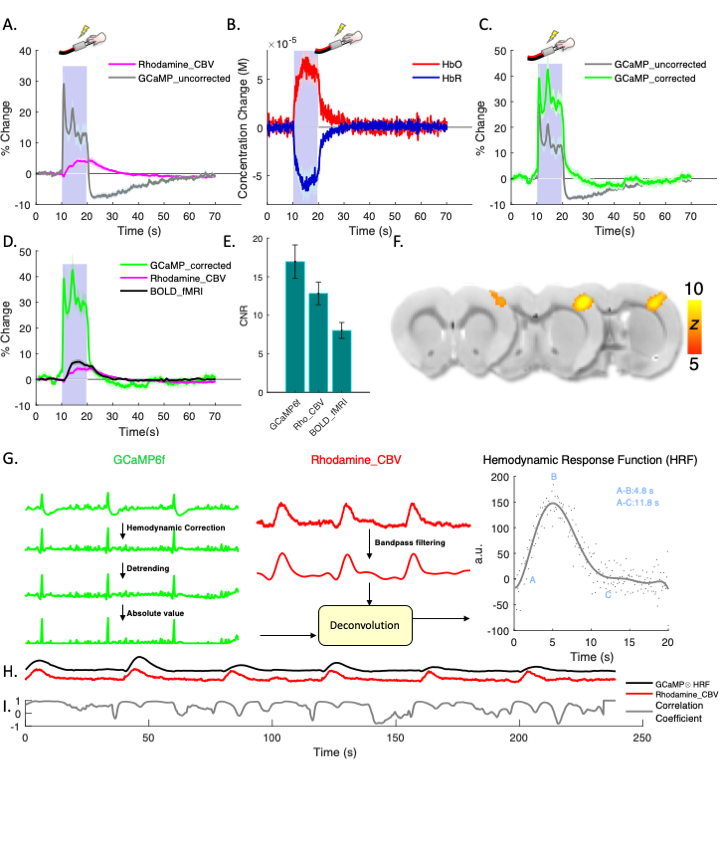
Fig.2 shows fiber-photometry results from subjects expressing EYFP, a commonly used control fluorophore that does not encode neuronal activity or hemodynamic responses. Upon forepaw stimulation (Fig.2A) or 5% CO2hypercapnic challenge (Fig.2F), EYFP signal decreased significantly and the pattern of its absolute changes highly resembled the rhodamine CBV signal, indicative of hemodynamic contamination in EYFP data. Approximately every 5.4% CBV increase would induce a 1% EYFP signal decrease if hemodynamic correction was not implemented. Using the equations we proposed in Fig.4, we fit the spectral signal and derived DHbO and DHbR (Fig. 2B and 2G). These concentrations are comparable to those reported in the literature14. Fig. 2C, D, H and I compare the derived CBV (HbT) and experimentally measured rhodamine CBV, which show high correlations. Fig. 2E and J shows the EYFP traces after the proposed correction, demonstrating the mathematical validity of our correction algorithm. Next, we demonstrated uncorrected and corrected GCaMP traces in vivo (Fig. 3A-C). Note the false-negative post-stimulus undershoot and enhanced GCaMP % changes in Fig. 3C. The BOLD data collected concurrently from the same group of subjects are shown in Fig. 3D-Fandcompared with both GCaMP and rhodamine CBV data. We then used the corrected GCaMP and rhodamine CBV to compute an HRF from a group of training data (Fig. 3G) and apply the derived HRF from the training dataset on to a naïve testing dataset to predict hemodynamic signals only using the GCaMP data and the derived HRF (Fig. 3H). The results successfully predicted the experimentally recorded CBV and exhibited high correlation (Fig. 3I).Discussion & Conclusion
Cerebrohemodynamic changes create artifacts in fiber-photometry recordings, which significantly affect GCaMP signals and distort neuronal activity data. As the number of combined fMRI and fiber-photometry studies are rapidly increasing due to its ability to provide neuronal ground-truth information3–10, this artifact could yield widespread measurement inaccuracies and/or false negative GCaMP results, leading to incorrect interpretations of neurovascular coupling and/or brain network studies. Our finding is important because we demonstrated for the first time that through the process of proposed correction, DHbO and DHbR can be derived from fluorescent spectra from fiber-photometry GCaMP recording nearly “for free” (i.e., without injecting fluorescent contrast agent). This work also enables high fidelity neurovascular coupling measurements (i.e., the HRF) and can be easily implemented on awake and behaving animals. This technique is compatible with fMRI and can seamlessly add concurrent cellular/physiology data in spatial and temporal scales markedly different from fMRI. With the addition of the proposed correction method, we expect our established platform to be an attractive means to identify the contributions of selected circuits and cellular populations to hemodynamic responses, and serve as a useful steppingstone towards a more profound understanding of neurovascular coupling and brain networks.Acknowledgements
We thank UNC CAMRI members for their helpful discussions and critiques. We appreciate Dr. Lindsay Walton’s help in editing the text and making it more concise. This work is supported in part by NIH grants RF1MH117053, R01MH111429, R01NS091236, P60AA011605, and U54HD079124.References
1. Cui, G. et al.Concurrent Activation of Striatal Direct and Indirect Pathways During Action Initiation. Nature494, 238–242 (2013).
2. Kim, C. K. et al.Simultaneous fast measurement of circuit dynamics at multiple sites across the mammalian brain. Nat. Methods13, 325–328 (2016).
3. Schmid, F. et al.Assessing sensory versus optogenetic network activation by combining (o)fMRI with optical Ca2+ recordings. J Cereb Blood Flow Metab36, 1885–1900 (2016).
4. Schwalm, M. et al.Cortex-wide BOLD fMRI activity reflects locally-recorded slow oscillation-associated calcium waves. Elife6, (2017).
5. Liang, Z., Ma, Y., Watson, G. D. R. & Zhang, N. Simultaneous GCaMP6-based fiber photometry and fMRI in rats. J Neurosci Methods289, 31–38 (2017).
6. Albers, F., Wachsmuth, L., van Alst, T. M. & Faber, C. Multimodal Functional Neuroimaging by Simultaneous BOLD fMRI and Fiber-Optic Calcium Recordings and Optogenetic Control. Mol. Imaging Biol.(2017) doi:10.1007/s11307-017-1130-6.
7. Schlegel, F. et al.Fiber-optic implant for simultaneous fluorescence-based calcium recordings and BOLD fMRI in mice. Nat Protoc13, 840–855 (2018).
8. Schulz, K. et al.Simultaneous BOLD fMRI and fiber-optic calcium recording in rat neocortex. Nat Methods9, 597–602 (2012).
9. He, Y. et al.Ultra-Slow Single-Vessel BOLD and CBV-Based fMRI Spatiotemporal Dynamics and Their Correlation with Neuronal Intracellular Calcium Signals. Neuron97, 925-939.e5 (2018).
10. Wang, M., He, Y., Sejnowski, T. J. & Yu, X. Brain-state dependent astrocytic Ca(2+) signals are coupled to both positive and negative BOLD-fMRI signals. Proc. Natl. Acad. Sci. U. S. A.115, E1647–E1656 (2018).
11. Ma, Y. et al.Wide-field optical mapping of neural activity and brain haemodynamics: considerations and novel approaches. Philos. Trans. R. Soc. Lond. B. Biol. Sci.371, (2016).
12. Meng, C. et al.Spectrally Resolved Fiber Photometry for Multi-component Analysis of Brain Circuits. Neuron98, 707-717 e4 (2018).
13. Prahl, S. Optical Absorption of Hemoglobin. http://omlc.org/specra/hemoglobin.
Figures