1105
Geometrically accurate imaging of the pial arterial vasculature of the human brain in vivo with high-resolution time-of-flight angiography at 7T1Athinoula A. Martinos Center for Biomedical Imaging, Massachusetts General Hospital, Charlestown, MA, United States, 2Department of Radiology, Harvard Medical School, Charlestown, MA, United States, 3Centre for Advanced Imaging, The University of Queensland, Brisbane, Australia, 4High Field MR Centre, Department of Biomedical Imaging and Image-guided Therapy, Medical University of Vienna, Vienna, Austria, 5Department of Neurology, Medical University of Graz, Graz, Austria, 6Division of Health Sciences and Technology, Massachusetts Institute of Technology, Cambridge, MA, United States
Synopsis
Non-invasive imaging of the pial arterial vasculature using the inflow-based contrast provided by moving blood water spins requires sufficiently small voxel sizes (160 μm) to maintain high contrast in small pial arteries (200 μm diameter). Additional acquisition of quantitative susceptibility values allows the differentiation of veins and arteries, turning magnetic resonance angiography into true arteriography. Importantly, flow compensation in all phase encoding directions is necessary to assure geometric accuracy, even for small vessels.
Introduction
Time-of-flight magnetic resonance angiography (TOF-MRA) utilizes the high signal intensity of blood water spins flowing into the imaging volume to generate an endogenous contrast between vessels and background tissue1,2. While the static tissue experiences all radio-frequency (RF) pulses, and has thus a very low net magnetization, the inflowing blood water spins originating outside of the imaging volume experience a smaller number of RF pulses (depending on the transit time), and have thus a much higher net signal. This effect can be enhanced by using a smaller flip angle (FA), which leads to a slower saturation of the blood water spins, and a longer repetition time (TR), which allows the more frequent replacement of blood water spins in the vessels3.Here, we set out to investigate how this contrast mechanism can be optimized for imaging of the pial arterial vasculature at 7T, which is often undetected when using conventional angiographic imaging methods. Accurate measures of the pial vasculature would assist with the interpretation of various functional magnetic resonance imaging (fMRI) contrasts for studies investigating activation within the cerebral cortex. Accurate imaging of the pial vasculature is made challenging because at the cortical surface, the arterial network overlays the venous network, and the pial arteries have a smaller diameter (200 μm) than pial veins (350 μm)4,5; further, the large cerebral arteries are located within the sulci, whereas the collecting venous trunks remain on the surface.
In the following, we investigate the feasibility of imaging the small pial arteries using TOF-MRA at 7 Tesla, and report on the key parameters to do so.
Methods
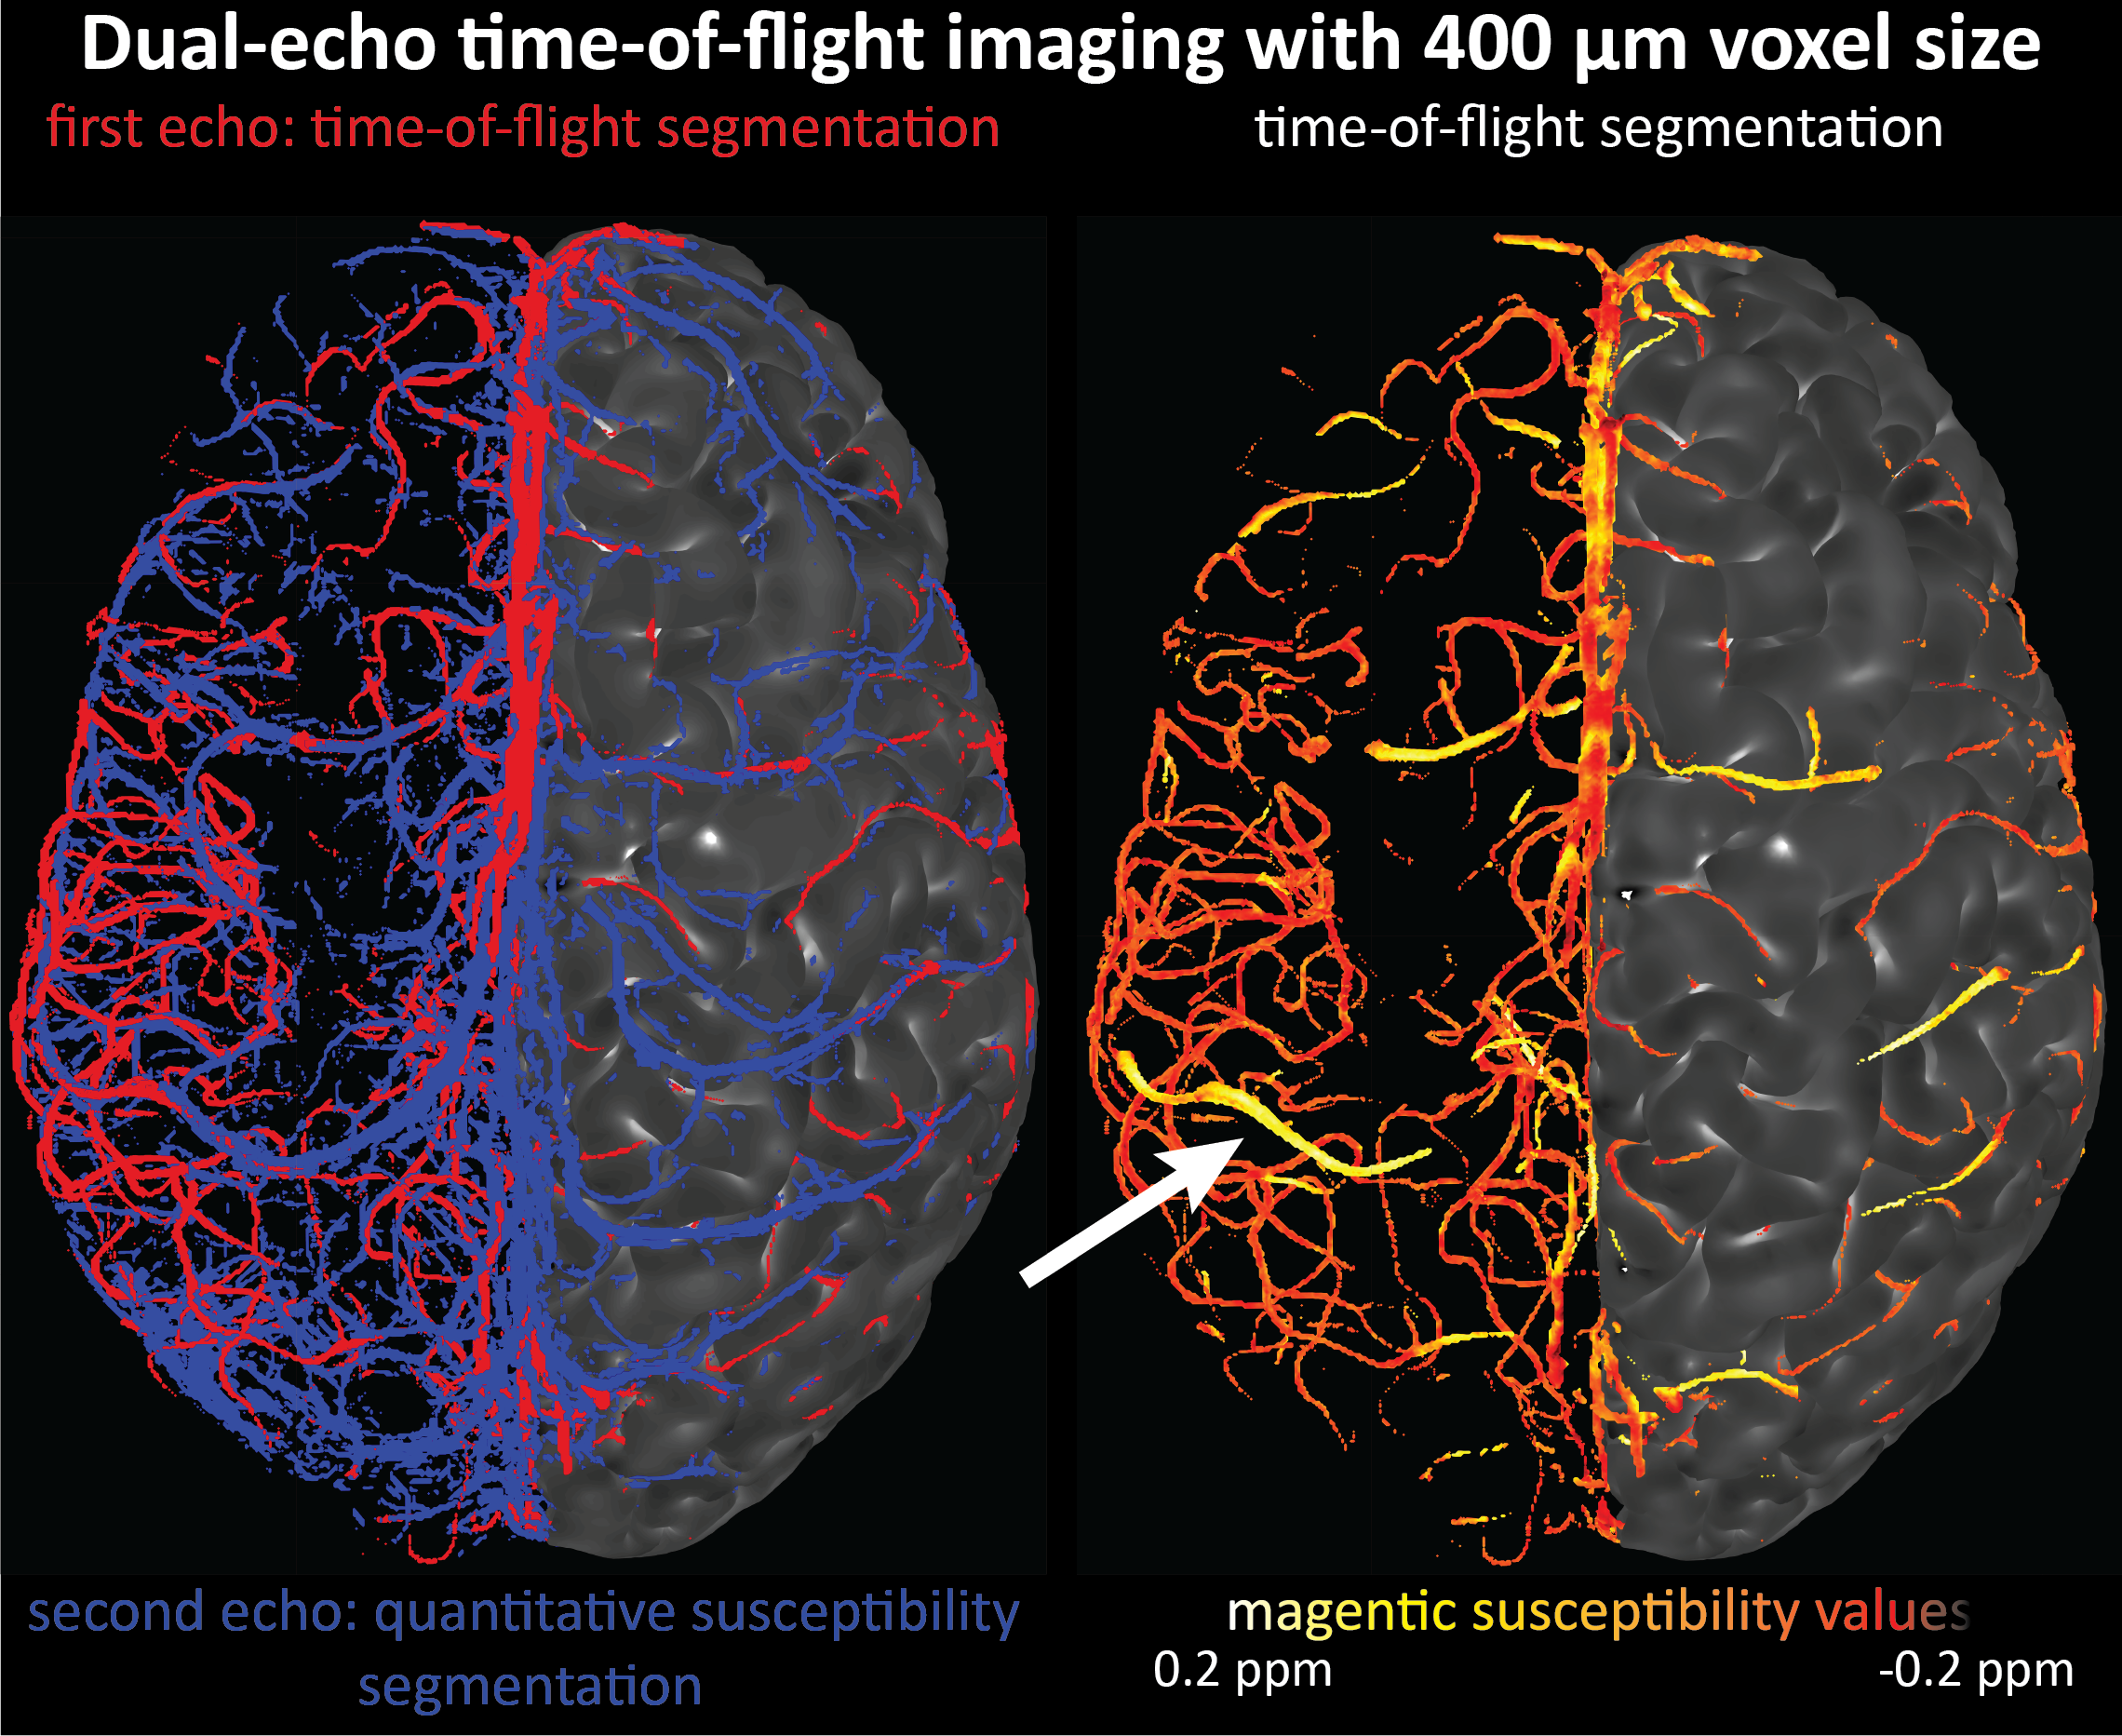
Imaging data from two healthy volunteers, after providing written informed consent, were acquired on a 7T MAGENTOM whole body MRI scanner (Siemens Healthineers, Erlangen, Germany) with a custom-built 31-channel head coil. After optimizing TR (20 ms) and FA (18°) values based on previous literature3,6,7, we investigated the effect of voxel size on the contrast-to-noise ratio (CNR) of vessel and background tissue through simulations and in vivo experiments. A 3D gradient-recalled echo (GRE) sequence with varying voxel sizes (300–800 μm isotropic) was used (TE = 4.73 ms with asymmetric echo, slab thickness=22 mm, GRAPPA=3, 3D centric reordering of the phase encoding steps8,9, read and slab-select flow compensation). Further, we systematically varied the slab thickness (13–29 mm) of the TOF data (voxel size=400 μm isotropic, TE=4.5 ms, otherwise identical parameters) to investigate its effect on the CNR of small and large vessels.Ultimately, we acquired TOF data with 160 μm voxel size (TE = 6.56 ms, GRAPPA = 2, bandwidth = 100 Hz/px, slab thickness = 8.32 mm, 6 slabs) to image the small pial arteries. Additionally, we acquired dual-echo TOF data10,11 (voxel size = 400 μm, TE = 7.5 ms and 14 ms, GRAPPA = 4, ASPIRE coil combination12, first echo with full gradient-moment based flow compensation in read and phase encoding directions9) to obtain quantitative susceptibility (QSM)13 values from the second echo to differentiate veins from arteries in the TOF images14.
Results
Small voxel size, i.e. reduced partial volume effects, is the key imaging parameter to resolve the small vessels on the pial surface (Fig. 1 & 3). Increased slab thickness has a less detrimental effect than perhaps expected (Fig. 2). Note that larger arteries with fast flow feed smaller arteries, and, thus, an increase in slab thickness does not necessarily cause a substantial increase in transit time.Most importantly, it is indeed possible to resolve many of the small branching arteries using only the inherent inflow contrast given a sufficiently small voxel size (Fig. 3). Further, the high inflow contrast in larger veins make the additionally acquired QSM values a valuable resource to differentiate veins from arteries14. The varied but ubiquitous vessel displacements observed in the second echo, which is due to the motion of blood water spins during the time between the phase encoding and the readout9, highlight that flow compensation in all phase encoding directions is necessary to obtain geometrically accurate TOF data also for smaller vessels (Fig. 5).
Discussion
The results show that imaging of the pial arterial vasculature using a 3D GRE sequence and only endogenous inflow-based contrast is, in principle, possible. However, the observed number of small arteries branching off is lower than expected4, suggesting false negative detections in our data, which is potentially due to remaining partial volume effects at voxel boundaries. Thus, a further reduction in voxel size to around 50 μm would be desirable. However, this would require a substantial lengthening of the acquisition time (to preserve coverage and compensate for SNR losses), which in turn would presumably necessitate some form of motion correction15–17. Additionally, peripheral nerve stimulation (PNS) limits18 of our gradient coil currently prohibit the use of gradient-moment based flow compensation for the high-resolution TOF acquisitions. Thus, alternative flow compensation mechanisms or a reduction in PNS need to be integrated. Ultimately, the techniques presented here show that non-invasive, detailed arteriography is possible, offering a complementary building block for interpreting fMRI data.Acknowledgements
This work was supported in part by the NIH NIBIB (grants P41-EB015896, R01-EB019437 and R21-NS106706), by the BRAIN Initiative (NIH NIMH grant R01-MH111419), and by the MGH/HST Athinoula A. Martinos Center for Biomedical Imaging; and was made possible by the resources provided by NIH Shared Instrumentation Grants S10-RR023043 and S10-RR019371.
We would like to thank Drs. Daniel Park and Thomas Witzel for help with the sequence adjustments, Dr. Kawin Setsompop for advice about flow compensation, and Mr. Kyle Droppa and Ms. Nina Fultz for help with subject recruitment and data acquisition.
References
1. Keller, P.J., Drayer, B.P., Fram, E.K., Williams, K.D., Dumoulin, C.L., Souza, S.P., 1989. MR angiography with two-dimensional acquisition and three-dimensional display. Work in progress. Radiology 173, 527–532. https://doi.org/10.1148/radiology.173.2.2798885
2. Parker, D.L., Yuan, C., Blatter, D.D., 1991. MR angiography by multiple thin slab 3D acquisition. Magn. Reson. Med. 17, 434–451. https://doi.org/10.1002/mrm.1910170215
3. Brown, R.W., Cheng, Y.-C.N., Haacke, E.M., Thompson, M.R., Venkatesan, R., 2014. Chapter 24 - MR Angiography and Flow Quantification, in: Magnetic Resonance Imaging. John Wiley & Sons, Ltd, pp. 701–737. https://doi.org/10.1002/9781118633953.ch24
4. Duvernoy, H.M., Delon, S., Vannson, J.L., 1981. Cortical blood vessels of the human brain. Brain Res. Bull. 7, 519–579. https://doi.org/10.1016/0361-9230(81)90007-1
5. Conn, P.M., Conn, P.M., 2003. Neuroscience in Medicine. Humana Press, Totowa, N.J.; Great Britain.
6.
Carr, J.C., Carroll, T.J., 2012. Magnetic
resonance angiography: principles and applications. Springer, New York.
7. Bianciardi, M., Toschi, N., Polimeni, J.R., Evans, K.C., Bhat, H., Keil, B., Rosen, B.R., Boas, D.A., Wald, L.L., 2016. The pulsatility volume index: an indicator of cerebrovascular compliance based on fast magnetic resonance imaging of cardiac and respiratory pulsatility. Philos. Trans. R. Soc. Math. Phys. Eng. Sci. 374, 20150184. https://doi.org/10.1098/rsta.2015.0184
8. Korin, H.W., Riederer, S.J., Bampton, A.E.H., Ehman, R.L., 1992. Altered phase-encoding order for reduced sensitivity to motion in three-dimensional MR imaging. J. Magn. Reson. Imaging 2, 687–693. https://doi.org/10.1002/jmri.1880020613
9. Parker, D.L., Goodrich, K.C., Roberts, J.A., Chapman, B.E., Jeong, E.-K., Kim, S.-E., Tsuruda, J.S., Katzman, G.L., 2003. The need for phase-encoding flow compensation in high-resolution intracranial magnetic resonance angiography. J. Magn. Reson. Imaging 18, 121–127. https://doi.org/10.1002/jmri.10322
10. Du, Y.P., Jin, Z., Hu, Y., Tanabe, J., 2009. Multi-echo acquisition of MR angiography and venography of the brain at 3 Tesla. J. Magn. Reson. Imaging 30, 449–454. https://doi.org/10.1002/jmri.21833
11. Deistung, A., Dittrich, E., Sedlacik, J., Rauscher, A., Reichenbach, J.R., 2009. ToF-SWI: Simultaneous time of flight and fully flow compensated susceptibility weighted imaging. J. Magn. Reson. Imaging 29, 1478–1484. https://doi.org/10.1002/jmri.21673
12. Eckstein, K., Dymerska, B., Bachrata, B., Bogner, W., Poljanc, K., Trattnig, S., Robinson, S.D., 2018. Computationally Efficient Combination of Multi-channel Phase Data From Multi-echo Acquisitions (ASPIRE). Magn. Reson. Med. 79, 2996–3006. https://doi.org/10.1002/mrm.26963
13. Langkammer, C., Bredies, K., Poser, B.A., Barth, M., Reishofer, G., Fan, A.P., Bilgic, B., Fazekas, F., Mainero, C., Ropele, S., 2015. Fast quantitative susceptibility mapping using 3D EPI and total generalized variation. NeuroImage 111, 622–630. https://doi.org/10.1016/j.neuroimage.2015.02.041
14. Haacke, E.M., Tang, J., Neelavalli, J., Cheng, Y.C.N., 2010. Susceptibility mapping as a means to visualize veins and quantify oxygen saturation. J. Magn. Reson. Imaging 32, 663–676. https://doi.org/10.1002/jmri.22276
15. Aranovitch, A., Haeberlin, M., Gross, S., Dietrich, B.E., Wilm, B.J., Brunner, D.O., Schmid, T., Luechinger, R., Pruessmann, K.P., 2018. Prospective motion correction with NMR markers using only native sequence elements: Prospective Motion Correction With NMR Markers Using Only Native Sequence Elements. Magn. Reson. Med. 79, 2046–2056. https://doi.org/10.1002/mrm.2687
16. Mattern, H., Sciarra, A., Lüsebrink, F., Acosta‐Cabronero, J., Speck, O., 2019. Prospective motion correction improves high‐resolution quantitative susceptibility mapping at 7T. Magn. Reson. Med. 81, 1605–1619. https://doi.org/10.1002/mrm.27509
17. Sarlls, J.E., Lalonde, F., Rettmann, D., Shankaranarayanan, A., Roopchansingh, V., Talagala, S.L., 2018. Effectiveness of navigator-based prospective motion correction in MPRAGE data acquired at 3T. PLOS ONE 13, e0199372. https://doi.org/10.1371/journal.pone.0199372
18. Mansfield, P., Harvey, P.R., 1993. Limits to neural stimulation in echo-planar imaging. Magn. Reson. Med. 29, 746–758. https://doi.org/10.1002/mrm.1910290606
19. Bernier, M., Cunnane, S.C., Whittingstall, K., 2018. The morphology of the human cerebrovascular system. Hum. Brain Mapp. 39, 4962–4975. https://doi.org/10.1002/hbm.24337
Figures