1104
Individual differences in haemoglobin concentration influence BOLD fMRI functional connectivity and its correlations with behaviour1Monash Biomedical Imaging, Monash University, Melbourne, Australia, 2Australian Research Council Centre of Excellence for Integrative Brain Function, Melbourne, Australia, 3Turner Institute for Brain and Mental Health, Monash University, Melbourne, Australia
Synopsis
The BOLD signal detects changes in relative concentrations of oxy/deoxy-haemoglobin. Thus, individual blood haemoglobin levels may influence the BOLD signal-to-noise ratio in a manner independent of neural activity. In this study, we emulate group-differences in haemoglobin by performing a median split on 524 healthy elderly individuals based on individual measurements of haemoglobin. When compared, the two haemoglobin subgroups showed no differences in cognitive measures, however, significant differences in linear relationships between cognitive performance and functional connectivity were observed in four cognitive tests. Our findings confirm that haemoglobin levels are an important confounding variable in BOLD-fMRI-based studies in the elderly.
Introduction
Haemoglobin concentration is an important mediator of BOLD signal variability in brain1 and cardiac2 MRI. It has also been shown to vary with many factors, including sex,3 age,4 race,5 hydration level,2 stress levels,6–8 body temperature,9 sleep apnoea,10 cardiovascular health,11 and hormone levels.12 Therefore, haemoglobin variation has the potential to confound BOLD fMRI studies where these factors, or others, cause group differences in haemoglobin levels. In this work, we explore this effect by examining average fMRI connectivity between groups defined by different haemoglobin levels. We examine the anatomical pattern of the connectivity differences for evidence as to its origin. Finally, we compare linear relationships of connectivity and cognitive performance between the two groups to explore the potential for haemoglobin to confound studies of fMRI and cognition.Methods
The population was recruited for the ASPREE-NEURO study,13 a sub-study of a broader clinical trial of aspirin in neurotypical adults aged 70 years and over.14 We performed a median split on 524 healthy elderly individuals (age=73.8±3.5, 275 males) based on blood measurements of haemoglobin to produce two subgroups for each sex. Fasting blood was collected sent to a pathology laboratory for testing. Individuals were screened from study entry if their haemoglobin was below 11g/dL for females or 12g/dL for males.Cognitive performance was measuring using five cognitive tests: (i) single-letter controlled oral word association test (COWAT),15 (ii) colour trails test,16 (iii) predicted score derived from the modified mini-mental state examination (3MS), (iv) symbol digit modalities test (SDMT),17 and (v) the Victoria Stroop test.18 No differences in cognitive measures were observed between haemoglobin subgroups (all p>0.3, t-test).
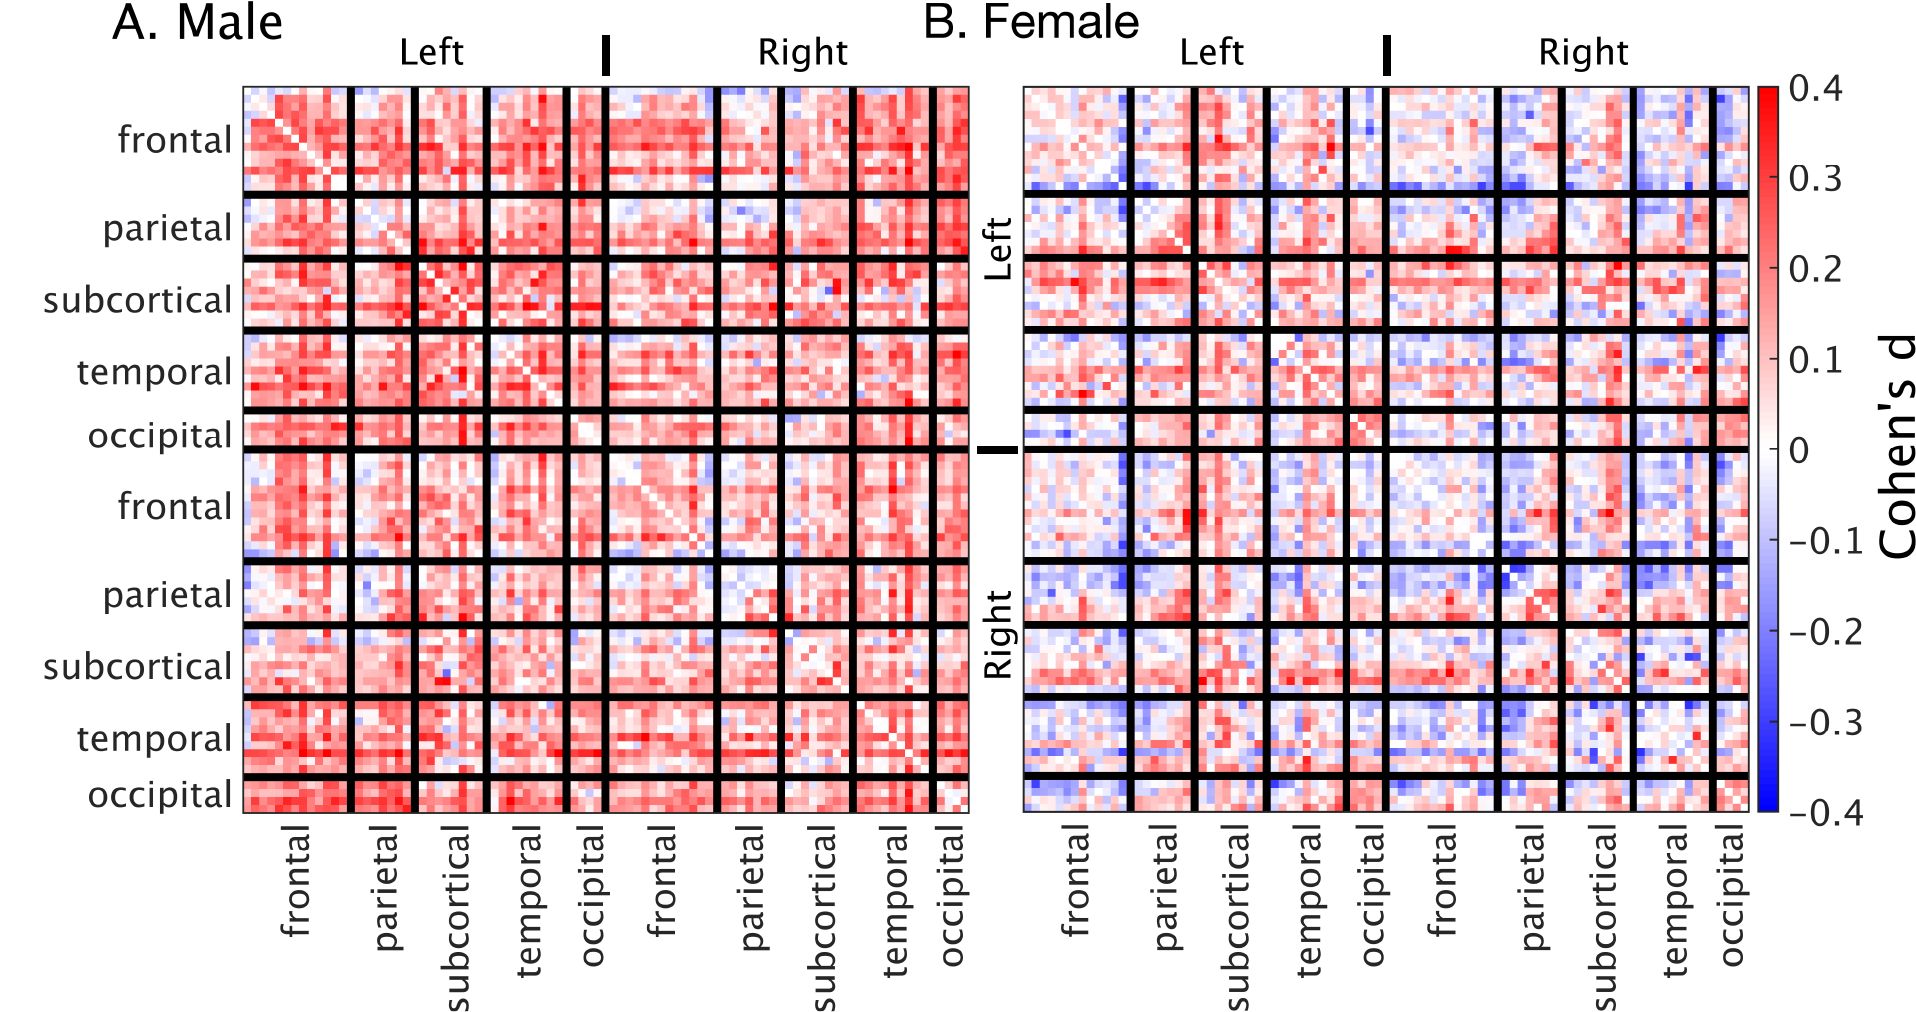
Data was acquired prior to the administration of study medication using a 3T Skyra MRI (Siemens, Erlangen, Germany). The fMRI protocol was a 5.16-minute eyes-open resting-state multi-band EPI sequence (multiband factor=3, TE=21ms, TR=754ms, voxel=3.0mm isotropic, matrix 64×64, slices=42). A T1-Weighted MPRAGE scan was also acquired (TE=2.13ms, TR=2300ms, TI=900ms, voxel=1.0mm isotropic, matrix=240x256x192, flip angle=9o). fMRI pre-processing included geometry distortion correction (FUGUE), brain extraction (BET),19 intra-scan movement correction (3dvolreg), low-pass filtering (0.01 Hz), and detrending (3dTproject, AFNI).20 Filtered images were then cleaned using MELODIC21 and FSL-FIX,22 with manual training on 25 random subjects. Temporal trends from noise-labelled ICA components were removed. The cleaned fMRI images were normalised to the 2mm MNI template via the T1 image using ANTs.23 Finally, the normalized and cleaned file was smoothed with a 5mm FWHM Gaussian kernel. The brain was parcellated into 82 regions (Desikan-Killiany atlas).24,25 Per-subject correlation matrices were calculated using temporal correlations (Pearson) between each pair of regions. The effect size of the haemoglobin median split was calculated using Cohen’s d at each point in the matrix.
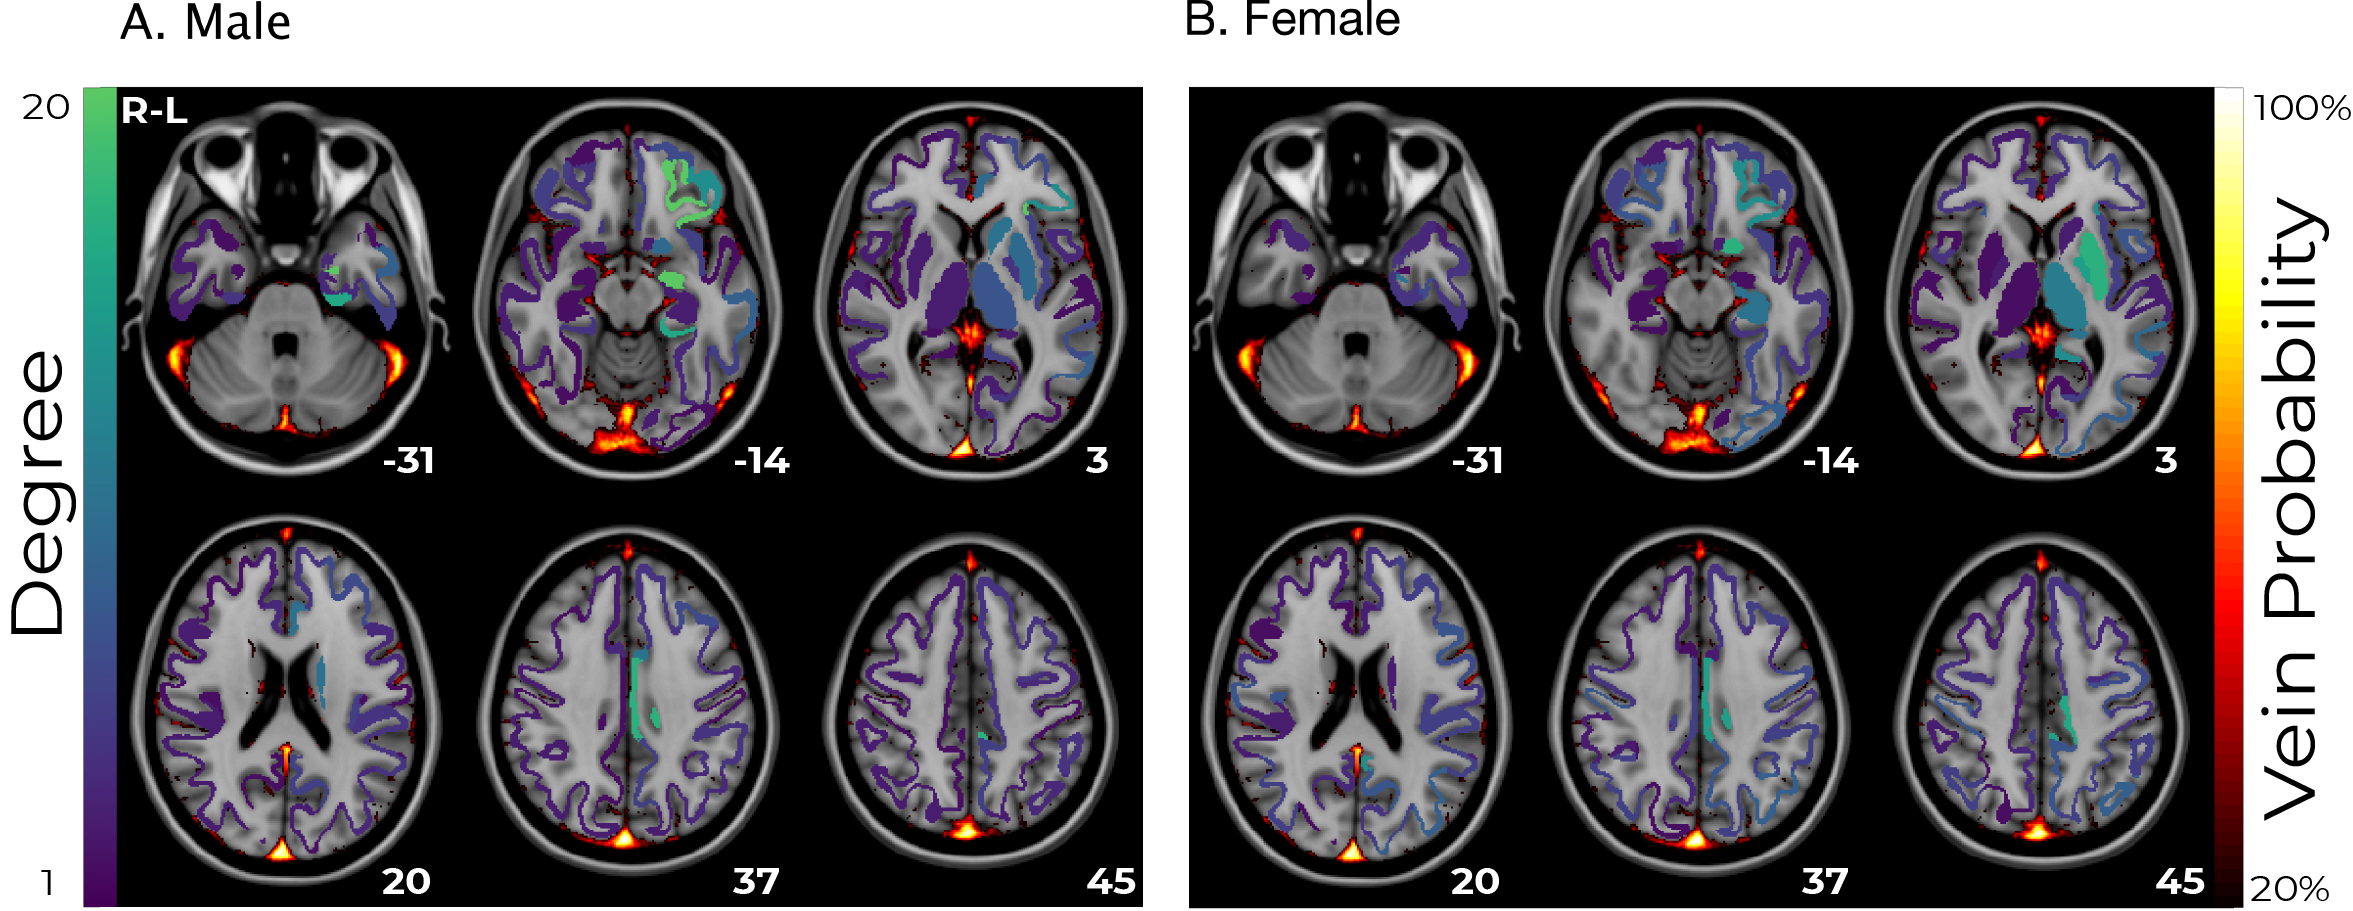
A linear correlation was estimated for each subgroup between haemoglobin concentration and functional connectivity for each pair of regions. A threshold of the 90th percentile was applied to binarize the matrix, and the number of connections from each regions was calculated as a measure of degree. This was overlaid on a vein atlas26 to compare the anatomical origin of the strongest haemoglobin effects with the vasculature.
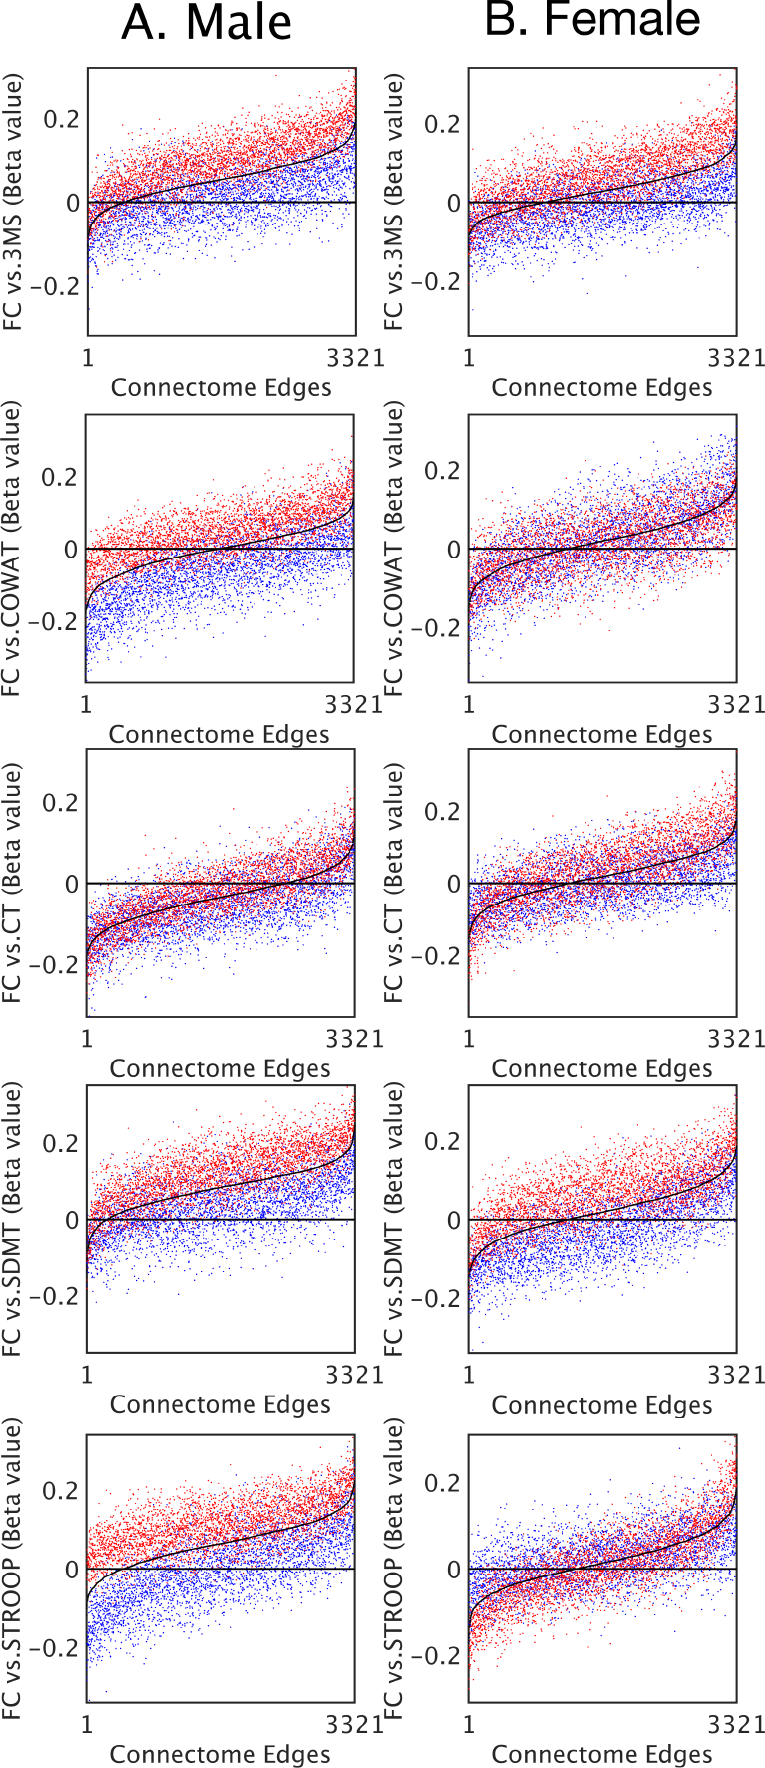
Finally, a linear correlation was estimated between cognitive performance and functional connectivity for each pair of regions. The two subgroups were compared to the whole population to simulate the effect of haemoglobin group differences in brain-behaviour studies.
All analysis were performed separately for men and women as they have known haemoglobin differences.3 Haemoglobin, functional connectivity, and cognitive test scores were all normalized (z-scored) prior to fitting linear models or calculating statistics.
Results
Functional connectivity was significantly different between the low-haemoglobin and high-haemoglobin subgroups for both males and females (t-test p<10-10). The size of this effect at a global level was small (Cohen’s d males=0.17 females=0.03). The effect in males was consistent and broad, whereas the effect in females was anatomically varied (Figure 1).Linear correlations between haemoglobin and functional connectivity were highest in sub-cortical regions and biased towards the left-hemisphere (Figure 2). They were consistent for both males and females and showed minimal spatial overlap with venous vasculature.
Linear coefficients between functional connectivity and cognitive performance were consistently lower in the low-haemoglobin subgroup compared to the high (Figure 3). The effect was present in both males and females. Connections that showed no significant correlation between cognitive performance and functional connectivity (where the black line approached the zero line) still demonstrated a haemoglobin-related bias.
Discussion
The results of this study demonstrate that the confounding effect of variability in haemoglobin values is widespread across brain regions, differs substantially between the sexes, and strongly influences functional connectivity-cognition relationships. These results demonstrate that BOLD functional connectivity analyses may be confounded by haemoglobin differences, especially in studies aiming to compare groups of individuals, compare between sexes, or examine connectivity-cognition relationships.Conclusion
Our results provide evidence that individual differences in haemoglobin are an important confounding variable in functional connectivity and connectivity-cognition analyses. These findings highlight the value of performing a physiological assessment in fMRI studies. Future functional connectivity studies should control for haemoglobin as a confounding variable, especially in studies aiming to compare groups of individuals, compare sexes, or examine connectivity-cognition relationships.Acknowledgements
We thank the ASPREE group for data access. ASPREE was supported by the National Institutes of Health (grant number U01AG029824); the National Health and Medical Research Council of Australia (grant numbers 334047, 1127060, 1086188); Monash University (Australia) and the Victorian Cancer Agency (Australia). The Principal ASPREE study is registered with the International Standardized Randomized Controlled Trials Register, ASPirin in Reducing Events in the Elderly, Number: ISRCTN83772183 and clinicaltrials.gov number NCT01038583. ASPREE-Neuro trial is registered with Australian New Zealand Clinical Trials Registry ACTRN12613001313729.References
1. Xu F, Li W, Liu P, et al. Accounting for the role of hematocrit in between-subject variations of MRI-derived baseline cerebral hemodynamic parameters and functional BOLD responses. Hum Brain Mapp. 2018;39(1):344-353. doi:10.1002/hbm.23846
2. Guensch DP, Nadeshalingam G, Fischer K, Stalder AF, Friedrich MG. The impact of hematocrit on oxygenation-sensitive cardiovascular magnetic resonance. J Cardiovasc Magn Reson. 2016;18(1):42. doi:10.1186/s12968-016-0262-1
3. Rushton DH, Barth JH. What is the evidence for gender differences in ferritin and haemoglobin? Crit Rev Oncol Hematol. 2010;73(1):1-9. doi:10.1016/j.critrevonc.2009.03.010
4. Zauber NP, Zauber AG. Hematologic Data of Healthy Very Old People. JAMA. 1987;257(16):2181-2184. doi:10.1001/jama.1987.03390160067028
5. Dutton DB. Hematocrit Levels and Race: An Argument Against the Adoption of Separate Standards in Screening for Anemia. J Natl Med Assoc. 1979;71(10):945-954.
6. Jern C, Wadenvik H, Mark H, Hallgren J, Jern S. Haematological changes during acute mental stress. Br J Haematol. 1989;71(1):153-156. doi:10.1111/j.1365-2141.1989.tb06290.x
7. Muldoon MF, Herbert TB, Patterson SM, Kameneva M, Raible R, Manuck SB. Effects of Acute Psychological Stress on Serum Lipid Levels, Hemoconcentration, and Blood Viscosity. Arch Intern Med. 1995;155(6):615-620. doi:10.1001/archinte.1995.00430060077009
8. Patterson SM, Matthews KA, Allen MT, Owens JF. Stress-induced hemoconcentration of blood cells and lipids in healthy women during acute psychological stress. Health Psychol. 1995;14(4):319-324. doi:10.1037/0278-6133.14.4.319
9. Thirup P. Haematocrit. Sports Med. 2003;33(3):231-243. doi:10.2165/00007256-200333030-00005
10. Choi JB, Loredo JS, Norman D, et al. Does obstructive sleep apnea increase hematocrit? Sleep Breath. 2006;10(3):155-160. doi:10.1007/s11325-006-0064-z
11. Jin Y-Z, Zheng D-H, Duan Z-Y, et al. Relationship Between Hematocrit Level and Cardiovascular Risk Factors in a Community-Based Population. J Clin Lab Anal. 2015;29(4):289-293. doi:10.1002/jcla.21767
12. Drinka P. Hematocrit Elevation Associated With Testosterone Administration. J Am Med Dir Assoc. 2013;14(11):848. doi:10.1016/j.jamda.2013.08.006
13. Ward SA, Raniga P, Ferris NJ, et al. ASPREE-NEURO study protocol: A randomized controlled trial to determine the effect of low-dose aspirin on cerebral microbleeds, white matter hyperintensities, cognition, and stroke in the healthy elderly. Int J Stroke. 2017;12(1):108-113. doi:10.1177/1747493016669848
14. McNeil JJ, Woods RL, Nelson MR, et al. Baseline Characteristics of Participants in the ASPREE (ASPirin in Reducing Events in the Elderly) Study. J Gerontol Ser A. 2017;72(11):1586-1593. doi:10.1093/gerona/glw342
15. Ruff RM, Light RH, Parker SB, Levin HS. Benton controlled oral word association test: Reliability and updated norms. Arch Clin Neuropsychol. 1996;11(4):329-338. doi:10.1093/arclin/11.4.329
16. D’Elia L. Color Trails Test Professional Manual. Lutz, Florida. USA: PAR Psychological Assessmant Resources; 1996.
17. Smith A. Symbol Digit Modalities Test. Los Angeles, CA: Western Psychological Services; 1982.
18. Troyer AK, Leach L, Strauss E. Aging and Response Inhibition: Normative Data for the Victoria Stroop Test. Aging Neuropsychol Cogn. 2006;13(1):20-35. doi:10.1080/138255890968187
19. Smith SM. Fast robust automated brain extraction. Hum Brain Mapp. 2002;17(3):143-155. doi:10.1002/hbm.10062
20. Cox RW. AFNI: Software for Analysis and Visualization of Functional Magnetic Resonance Neuroimages. Comput Biomed Res. 1996;29(3):162-173. doi:10.1006/cbmr.1996.0014
21. Beckmann CF, DeLuca M, Devlin JT, Smith SM. Investigations into resting-state connectivity using independent component analysis. Philos Trans R Soc B Biol Sci. 2005;360(1457):1001-1013. doi:10.1098/rstb.2005.1634
22. Salimi-Khorshidi G, Douaud G, Beckmann CF, Glasser MF, Griffanti L, Smith SM. Automatic denoising of functional MRI data: Combining independent component analysis and hierarchical fusion of classifiers. NeuroImage. 2014;90:449-468. doi:10.1016/j.neuroimage.2013.11.046
23. Avants BB, Epstein CL, Grossman M, Gee JC. Symmetric diffeomorphic image registration with cross-correlation: evaluating automated labeling of elderly and neurodegenerative brain. Med Image Anal. 2008;12(1):26-41. doi:10.1016/j.media.2007.06.004
24. Desikan RS, Ségonne F, Fischl B, et al. An automated labeling system for subdividing the human cerebral cortex on MRI scans into gyral based regions of interest. NeuroImage. 2006;31(3):968-980. doi:10.1016/j.neuroimage.2006.01.021
25. Fischl B, Salat DH, Busa E, et al. Whole Brain Segmentation: Automated Labeling of Neuroanatomical Structures in the Human Brain. Neuron. 2002;33(3):341-355. doi:10.1016/S0896-6273(02)00569-X
26. Ward PGD, Ferris NJ, Raniga P, et al. Combining images and anatomical knowledge to improve automated vein segmentation in MRI. NeuroImage. 2018;165:294-305. doi:10.1016/j.neuroimage.2017.10.049
Figures