1102
On the relation between positive and negative functional changes of cerebral blood flow and T2* in the human visual cortex.1Max Planck Institute for Human Cognitive and Brain Sciences, Leipzig, Germany
Synopsis
Measurement of functional CBF is challenging due to inherently low SNR and signal amplitudes, especially in regions of negative BOLD response. Here, multi-echo center-out EPI is introduced which allows for simultaneous measurement of functional changes in CBF and T2* with improved sensitivity. Using a visual stimulus inducing positive and negative BOLD responses, a linear relationship between absolute changes in CBF and T2* along both positive and negative directions was found with similar coupling ratios. Negative absolute functional CBF changes were found to be almost independent of the baseline CBF, in agreement with previous work on the positive BOLD response.
Introduction
The nature of the negative BOLD response (NBR) is a topic of growing interest due to its importance for understanding the coupling between cerebral blood flow (CBF) and metabolism1-3. The accurate and simultaneous determination of BOLD and CBF changes would achieve quantification of this relationship. However, measuring CBF in NBR regions is challenging due to an inherently low signal-to-noise ratio, a reduced signal amplitude (typically <50% of the positive BOLD response, PBR) and considerable inter-subject variability.Recently, center-out EPI was shown to improve the sensitivity in quantifying functional changes of CBF and reduce confounding physiological noise contributions4,5. Here, this technique was extended to a multi-echo variant, thus allowing for the simultaneous measurement of functional changes in CBF and T2* with increased sensitivity. Data were analyzed with a focus on the coupling of ΔT2* and ΔCBF, the relationship between positive and negative signal amplitudes, and the influence from baseline CBF.
Methods
Six healthy subjects (3 female, 33.3±8 years) underwent a simultaneous BOLD and CBF acquisition using the multi-echo version of Double Shot Echo Planar Imaging with Center-out Trajectories and INtrinsic naviGation5 (ME-DEPICTING) at 3T on a Siemens MAGNETOM Prismafit. Pseudo-continuous arterial spin labeling6,7 data of 12 slices centered along the calcarine sulcus were acquired with a TR=3.55 s, labeling duration 1.5 s, and post-labeling delay 1.2 s (matrix 64×64, voxel size 3×3×4 mm, 0.8mm gap, bandwidth 2230 Hz/Px). Three echoes with TE1=1.7 ms and ΔTE=9 ms were collected using PAT factor 2. The functional paradigm consisted of a small 10Hz flickering radial checkerboard inducing an NBR in V13 (presented during 4 ASL control/labeling pairs) followed by a gray blank screen (6 ASL control/labeling pairs). Functional runs lasted 10 cycles (approx. 12 minutes).Imaging volumes were realigned using SPM12, normalized to MNI space, temporally high-pass filtered at (40TR)−1 and 3D Gaussian filtered (FWHM=2 mm). Time series of T2* and S0 were derived by linear regression. Statistical analyses were performed using an ASL-specific general linear model8 applied to the S0 time series followed by CBF quantification based on a two-compartment model9,10 and to the T2* time series.
Results
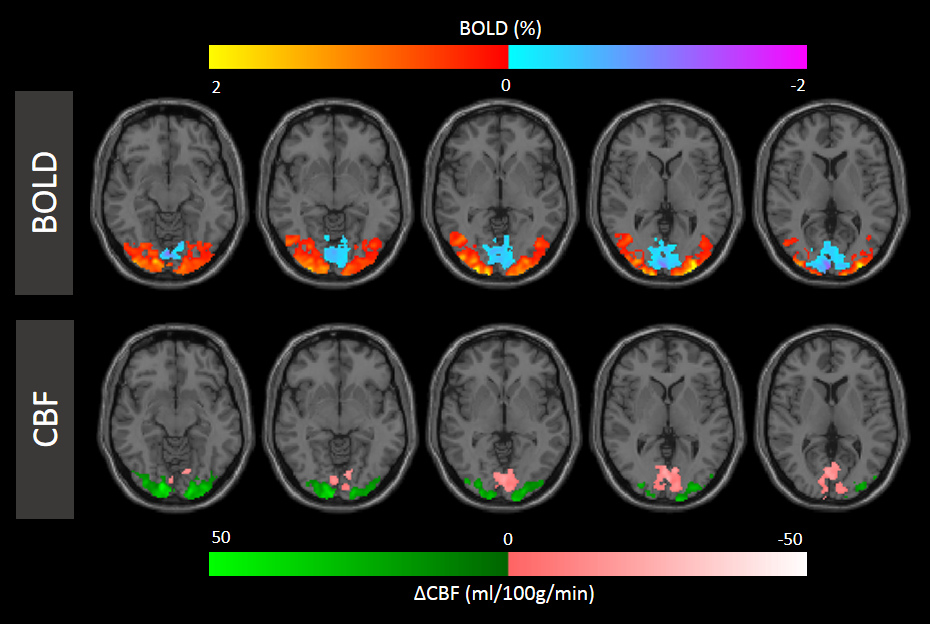
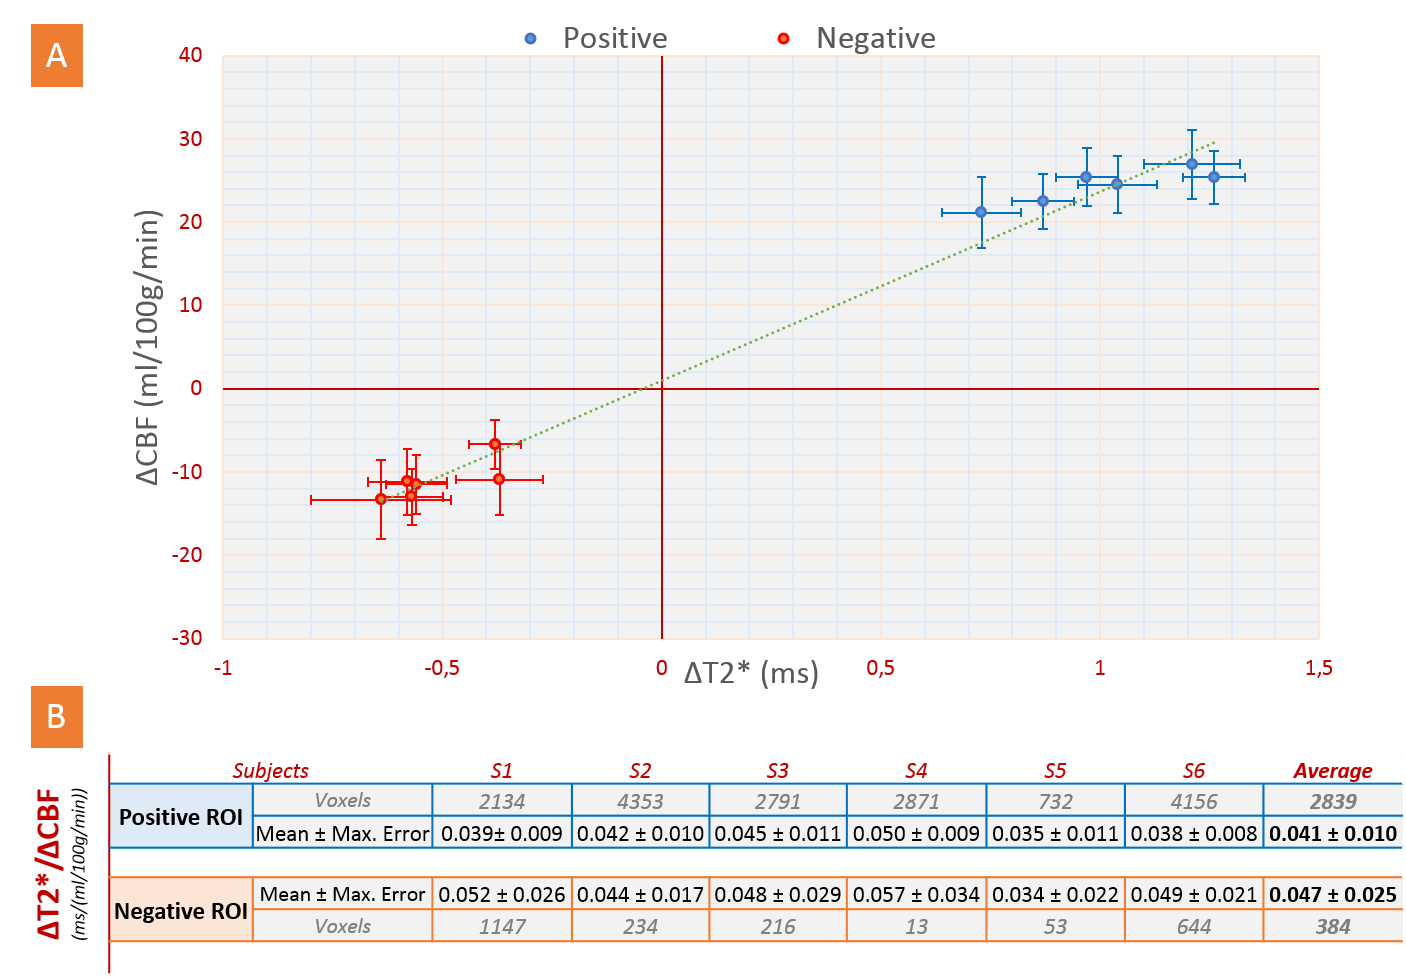
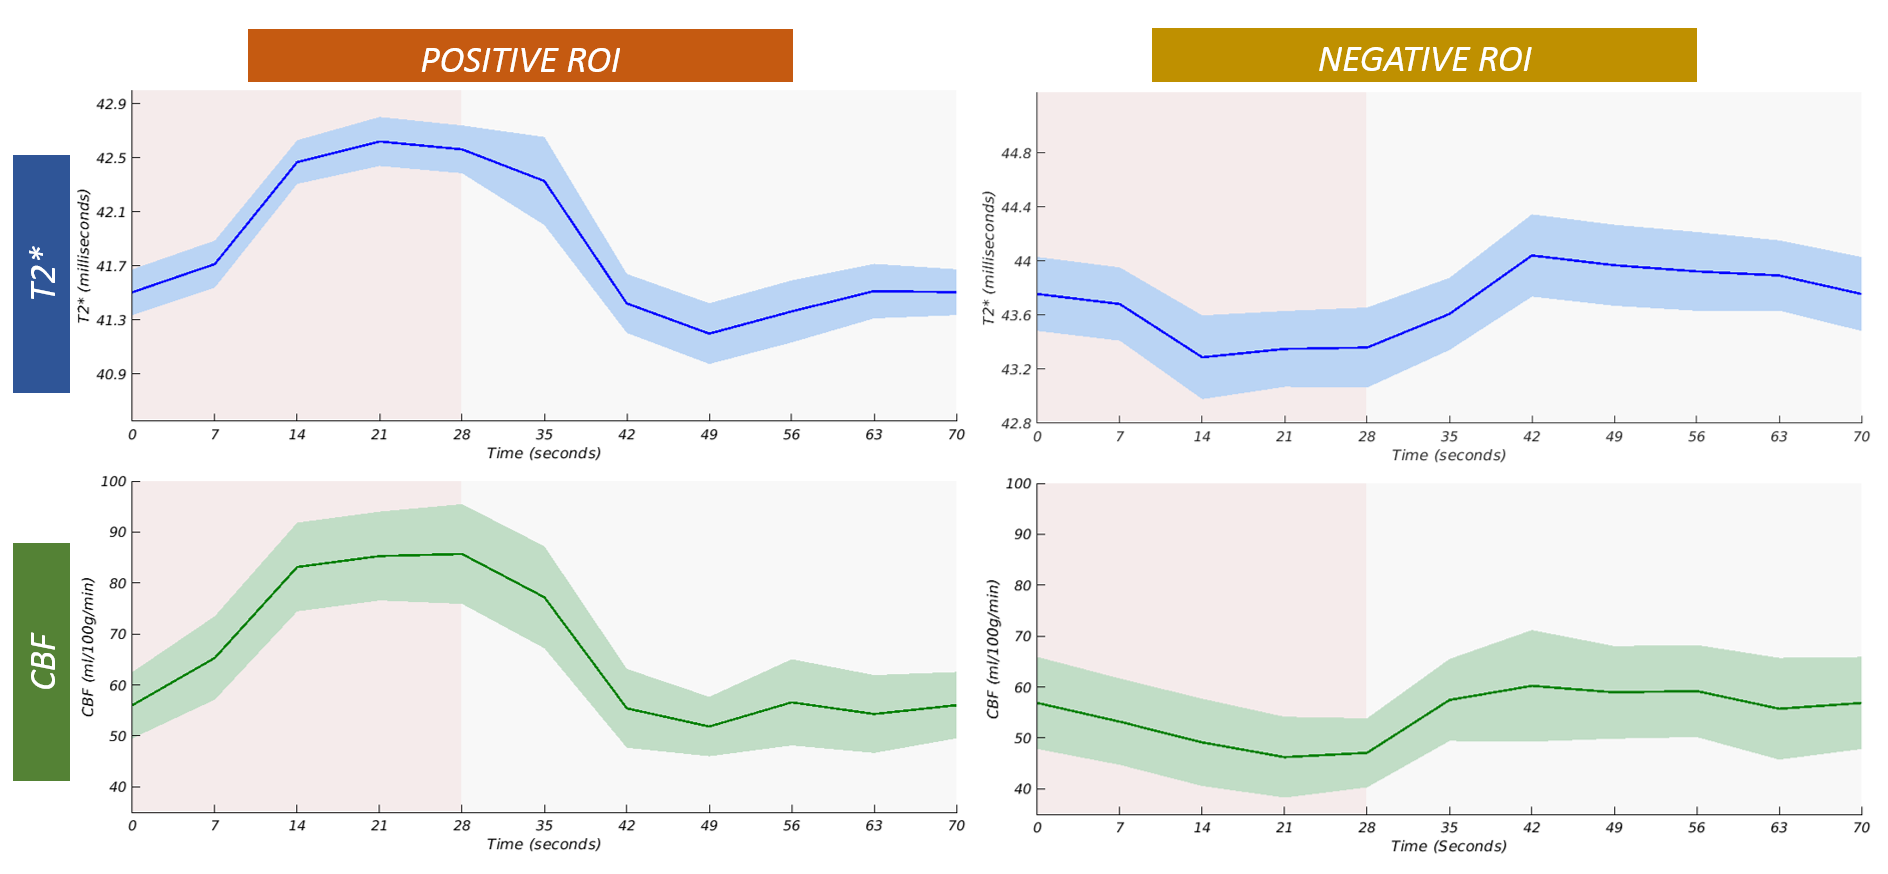
Figure 1 shows simultaneously recorded BOLD and CBF maps. A reduced CBF in NBR areas was found in all subjects with approx. 50% spatial overlap. While the locations of the NBR ROIs were well within V1 for all subjects, greater inter-subject differences in their spatial locations compared to the PBR were noted. These regions further exhibited higher baseline values of T2* and CBF.Quantification of absolute changes of T2* and CBF was performed separately for PBR and NBR regions in the commonly activated ROI of both quantities. The subject-wise interdependence of their absolute changes is plotted in Figure 2. Notably, a linear relationship can be deduced between absolute changes in CBF and T2* along both positive and negative directions (Fig. 2A). The corresponding ΔT2*/ΔCBF ratios are presented in Figure 2B. Error estimation based on propagation of the mean absolute error over the ROI yielded no significant differences among subjects for both PBR and NBR ROIs. Furthermore, no significant difference was obtained between the ΔT2*/ΔCBF ratio in the PBR and NBR ROIs. The corresponding group-averaged time courses of both quantities shown in Figure 3 exhibited very similar shapes.
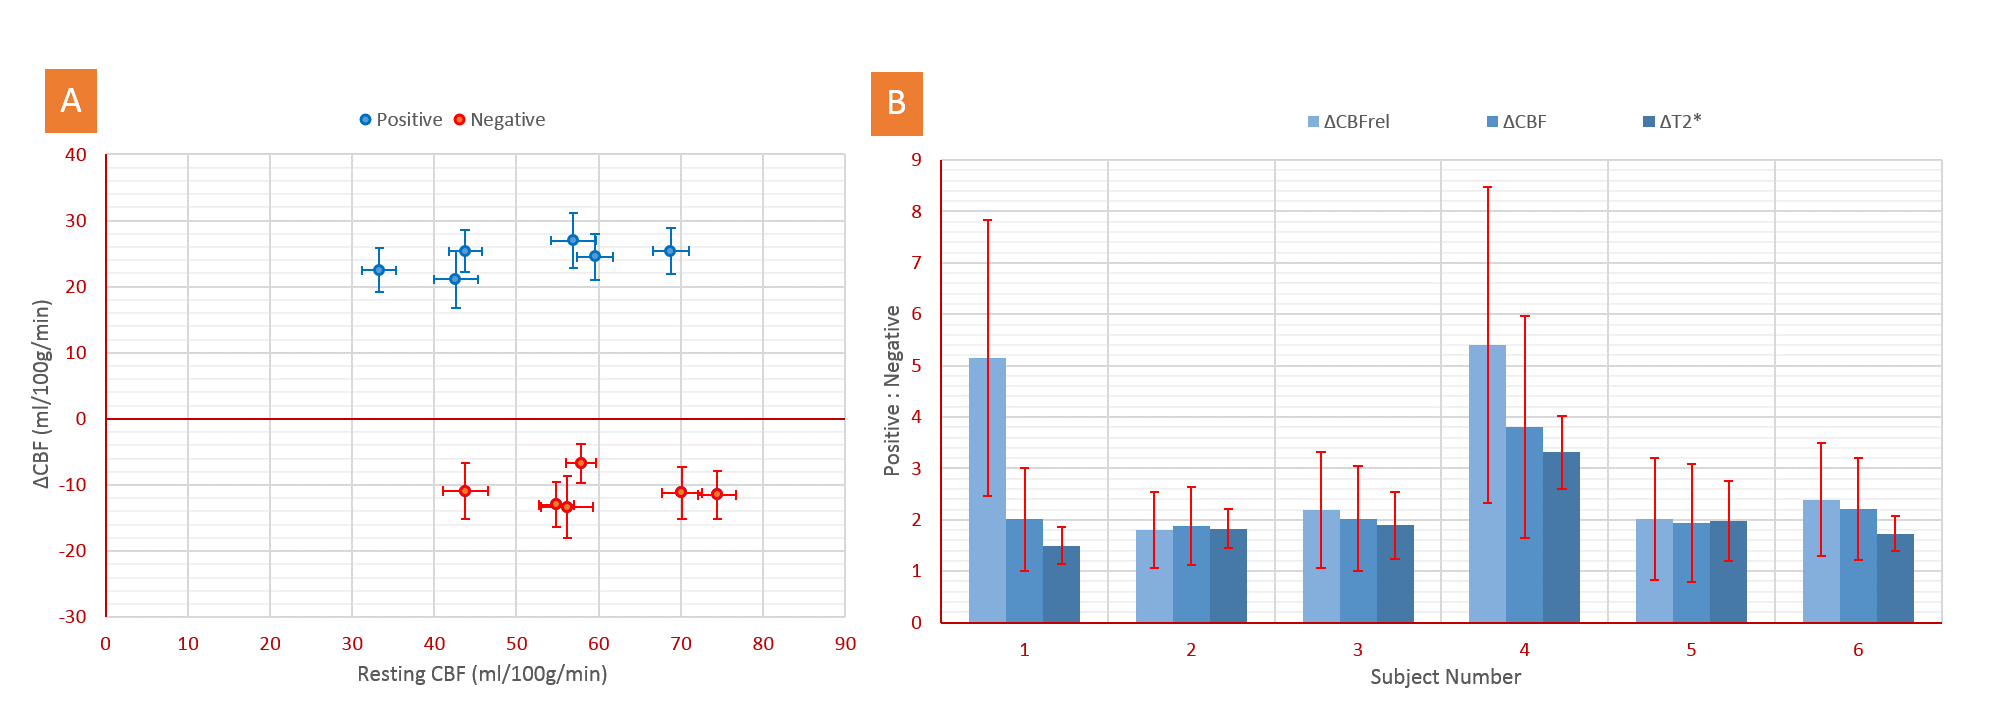
Absolute CBF changes in all subjects were almost identical and independent of the baseline CBF level for both PBR and NBR ROIs (Fig. 4A). The varying baseline CBF was found to be an additional source of inconsistency in inter-subject comparisons of signal ratios. This is illustrated in Figure 4B showing the amplitude ratios of the positive to negative signal changes of T2*, CBF, and CBFrel (relative to baseline). The former two absolute measures yielded values of about 2:1 for all subjects except in S4 having the smallest NBR ROI. By contrast, significantly higher inter-subject variation was observed for ΔCBFrel. Similarly, the ratio ΔT2rel*/ΔCBFrel (not shown) yielded higher inter-subject variability than ΔT2*/ΔCBF.
Discussion
Compared to conventional ME-EPI, both TE1 and ΔTE are significantly reduced with ME-DEPICTING achieving more accurate measurements of S0 along with corresponding T2* functional time courses. Thereby, CBF decreases in NBR regions were detected consistently across all subjects. A linear relationship between ΔT2* and ΔCBF was found for both PBR and NBR ROIs, hinting at a similar physiological origin1,2. The corresponding ΔT2*/ΔCBF ratios did not differ significantly, although the values in the NBR ROIs tended to be higher; however, with increased absolute errors.The use of absolute measures of signal changes, such as ΔT2* and ΔCBF, was found to reduce inter-subject variability due to improved independence from their respective baseline levels. In agreement with previous PBR studies using visual stimuli11,12 or gas-modulated baseline CBF13,14, ΔCBF showed a rather low dependence on baseline CBF. Our study provides an extension of this finding to negative ΔCBF in deactivated areas.
Acknowledgements
We thank Laurentius Huber for helpful comments on visual stimulation paradigms suitable for studying the negative BOLD effect.References
1. Shmuel A, Yacoub E, Pfeuffer J, et al. Sustained negative BOLD, blood flow and oxygen consumption response and its coupling to the positive response in the human brain. Neuron, 2002; 36(6): 1195–1210.
2. Pasley BN, Inglis BA & Freeman RD. Analysis of oxygen metabolism implies a neural origin for the negative BOLD response in human visual cortex. Neuroimage, 2007; 36(2): 269–276.
3. Huber L, Goense J, Kennerley AJ, et al. Investigation of the neurovascular coupling in positive and negative BOLD responses in human brain at 7T. Neuroimage, 2014; 97: 349–362.
4. Devi R, Mildner T, Lorenz K, et al. Improved sensitivity for detecting functional CBF changes by center-out EPI with very short echo time. 27th Int. Soc. Magn. Reson. Med. Annu. Meet., 2019; 27: 3712.
5. Hetzer S, Mildner T & Möller HE. A Modified EPI sequence for high-resolution imaging at ultra-short echo time. Magn. Reson. Med., 2011; 65(1): 165–175.
6. Alsop DC, Detre JA, Golay X, et al. Recommended implementation of arterial spin-labeled Perfusion MRI for clinical applications: A consensus of the ISMRM Perfusion Study group and the European consortium for ASL in dementia. Magn. Reson. Med., 2015; 73(1): 102–116.
7. Lorenz K, Mildner T, Schlumm T & Möller HE. Characterization of pseudo-continuous arterial spin labeling: Simulations and experimental validation. Magn. Reson. Med., 2018; 79(3): 1638–1649.
8. Hernandez-Garcia L, Jahanian H & Rowe DB. Quantitative analysis of arterial spin labeling FMRI data using a general linear model. Magn. Reson. Imaging, 2010; 28(7): 919–927.
9. Wang J, Alsop DC, Li L, et al. Comparison of quantitative perfusion imaging using arterial spin labeling at 1.5 and 4.0 Tesla. Magn Reson Med, 2002; 48(2): 242-54.
10. Mildner T, Müller K, Hetzer S, et al. Mapping of arterial transit time by intravascular signal selection. NMR Biomed, 2014; 27(5): 594-609.
11. Kastrup A, Li TQ, Krüger G, et al. Relationship between cerebral blood flow changes during visual stimulation and baseline flow levels investigated with functional MRI. Neuroreport, 1999; 10(8): 1751–1756.
12. Lu H, Zhao C, Ge Y & Lewis-Amezcua K. Baseline blood oxygenation modulates response amplitude: physiologic basis for inter-subject variations in fMRI signals. Magn. Reson. Med., 2008; 60(2): 364–372.
13. Li TQ, Kastrup A, Moseley ME & Glover GH. Changes in baseline cerebral blood flow in humans do not influence regional cerebral blood flow response to photic stimulation. J. Magn. Reson. Imaging, 2000; 12(5): 757–762.
14. Whittaker JR, Driver ID, Bright MG & Murphy K. The absolute CBF response to activation is preserved during elevated perfusion: Implications for neurovascular coupling measures. Neuroimage 2016; 125: 198–207.
Figures