1101
The role of rapid capillary resistance decreases in the BOLD response assessed through simulations in a realistic vascular network1Imaging, Athinoula A. Martinos Center for Biomedical Imaging, Massachusetts General Hospital, Boston, MA, United States, 2Physics, Engineering Physics and Optics, Laval University, Quebec, QC, Canada
Synopsis
The brain’s physiology may fundamentally limit the achievable spatial and temporal specificity of gradient-echo fMRI. Even if the physiology does not pose such a limitation a better understanding would allow for data analysis techniques that improve the spatial specificity. Microscopy allows for highly detailed investigations of local physiological mechanism and provides a growing knowledge from which fMRI may benefit profoundly. A current challenge is the transition from focal mechanisms to their consequence on the mesoscopic scale of BOLD examinations. In this abstract we present our recent work on this transition using simulations of the BOLD effect.
Introduction
Recent investigations of rats showed that the earliest BOLD response has a particularly high specificity to capillaries1 and therefore to the site of active neurons. The active dilation in diving arteries and arterioles during functional activity have been investigated experimentally in the somatosensory cortex of rats2 and mice3. Recent two-photon microscopy studies of the mouse somatosensory cortex showed that the first blood flow increases following neuronal activity are situated in the capillaries and precede the active arterial dilation4. We hypothesize that this local increase in capillary blood flow is due to a local decrease in capillary blood flow resistance. This seems unavoidable since the capillaries contribute the largest portion to the cortical blood flow resistance5. Here we use BOLD simulations based on realistic reconstructions of vascular networks6 to investigate the effect of capillary resistance decreases on the BOLD response. To do this, we implemented different scenarios of capillary resistance changes following neuronal activity as well as active and passive vessel dilation and demonstrate their influence on the BOLD response.Methods
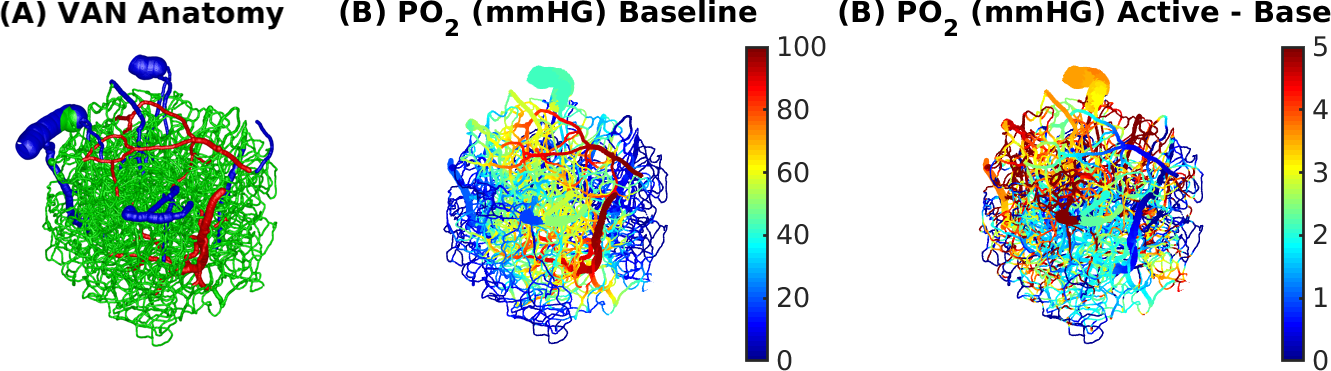
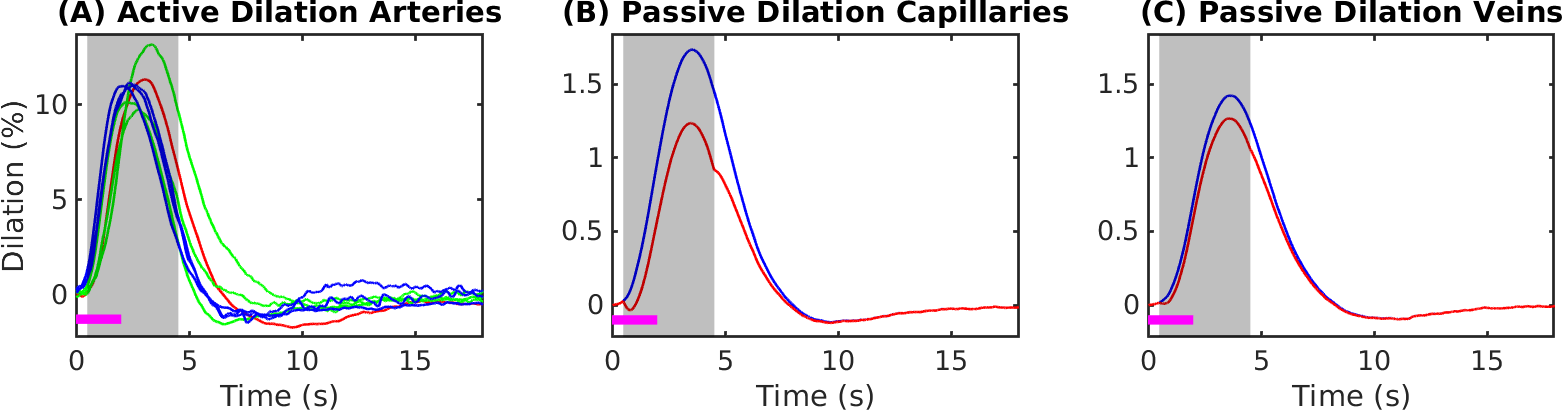
Simulations were based on a vascular anatomical network (VAN) reconstructed from the mouse somatosensory cortex measured in vivo7. The VAN has a size of 600×600×600 µm3 and extends down from the pial surface (Fig. 1A). The input of our simulations was the active arterial dilation following neuronal activity (2-s somatosensory stimulation) specified as a function of vessel branching order2 (Fig. 2A). We further incorporated passive diameter changes of capillaries and veins determined by vascular compliance9 (Fig. 2B & C) and computed the resulting blood flow and oxygenation distribution in the vessels8 (Fig. 1A & B). To test the effects of active resistance chances in the capillaries we simulated vascular dynamics for 15 additional scenarios including various dynamic decreases in the capillaries, active dilation, or changes in compliance. The imposed time course of the capillary resistance decreases was varied in magnitude (maximum 17 %) and implemented as abrupt, discontinuous changes (step functions) or more smooth, continuous changes (gaussian functions) of varying widths/onsets. The resulting oxygenation distributions were then used to compute magnetic field offsets for VANs oriented either parallel or perpendicular to B0 to account for orientation effects10. We then finally computed the gradient-echo BOLD signal as a function of cortical depth in non-overlapping slabs (thickness 150 µm) parallel to the pial surface using Monte-Carlo simulations of water diffusion through the B0 field surrounding the vessels6. The acquisition parameters assumed for the BOLD data were B0 = 7 T, TE = 30 ms, 18 s duration, and a temporal grid of 1 s.Results
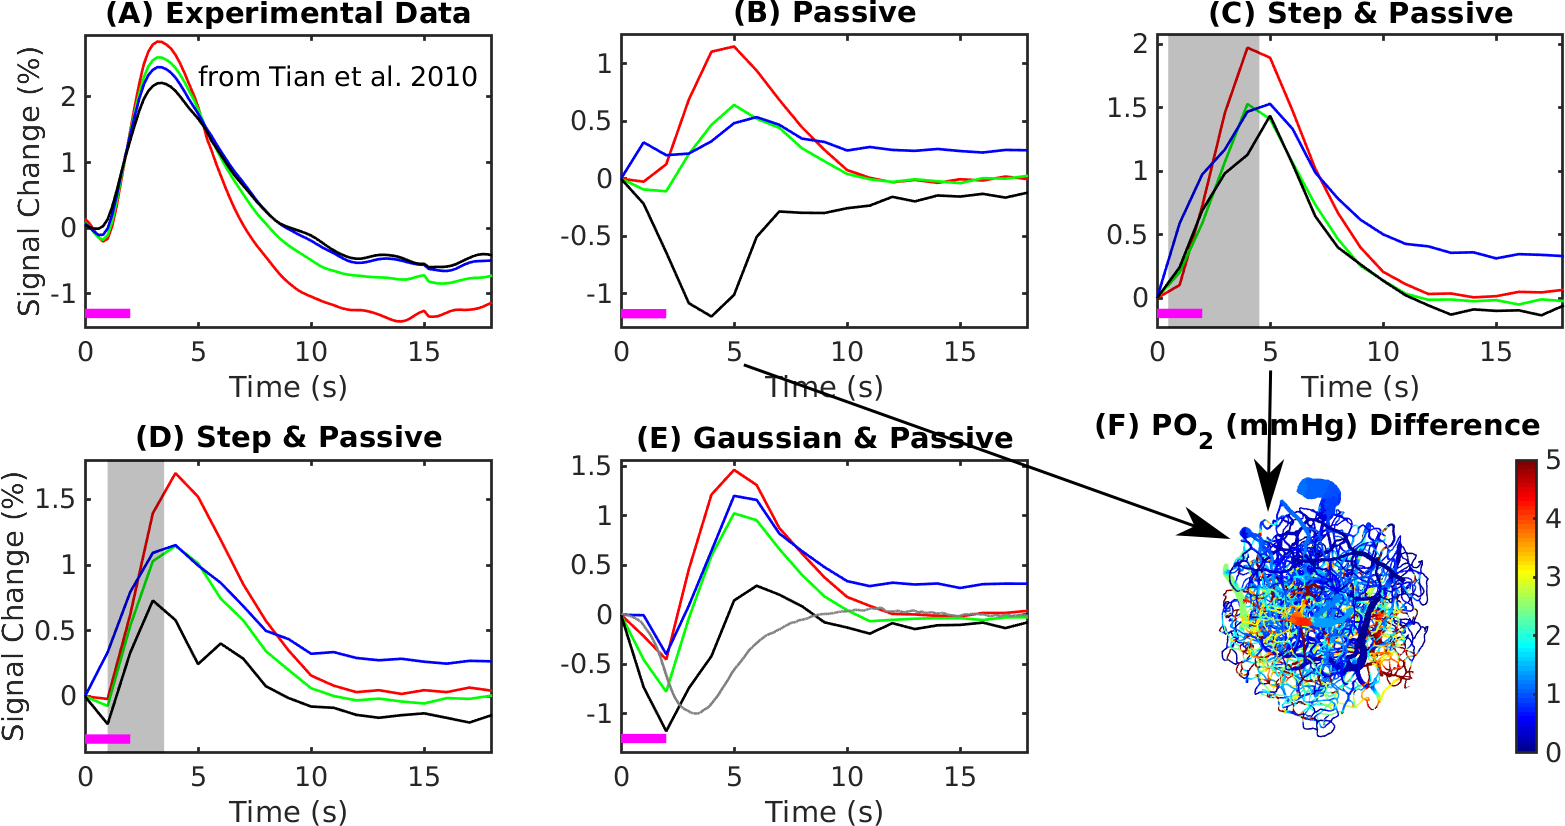
The experimental result shows a positive BOLD effect across all slabs accompanied by an intial dip in the superficial slabs (Fig.3A). The scenario with active arterial and passive capillary as well as vein diameter changes shows a positive response in the two superficial slabs but a flat or negative one in the two lower slabs (Fig.3B). The scenarios with additional constant capillary resistance decreases show higher and positive BOLD responses across all slabs and an initial dip in the lowest slab for the shorter resistance decrease (Fig.3 C & D). The resistance decrease in the capillaries also reduces the passive dilation in capillaries and veins (Fig.2 B & C). If instead a Gaussian resistance decrease is applied all slabs show a negative initial response which increases along the cortical depth followed by a positive response that decreases along the cortical depth (Fig.3E). The remaining scenarios with capillary resistance changes in the time frame 0 – 5 seconds were similar to the scenarios presented in (Fig.3 C & D) while the ones with changes at larger times were similar to the one presented in (Fig.3 B & E). The differences between the oxygenation distributions of scenarios from (Fig.3 B & C) are largest at the periphery far away from the feeding arteries (Fig.3E). Our results did not change qualitatively for different B0 directions.Discussion
Decreases of the capillary resistance in the early phase of the hemodynamic response seem to be necessary to generate flow patterns that result in simulated BOLD responses that agree with the experimentally measured BOLD responses. Here we exploited measures of the BOLD response across cortical depth and compared these with simulated BOLD response.Given how the temporal features of the BOLD response vary with depth this provides more information for testing various scenarios of vascular responses. For example, while the simulated BOLD response measured near the surface matched well with the expected BOLD response, only through examining the responses across depths were we able to identify the mismatch between experiment and simulation occurring at the mid-cortical depths.
Our framework provides a means to test new theories regarding functional hyperemia. For example, according to recent experimental results the capillary resistance decrease could be due to an increase in red blood cell deformability which is driven by blood oxygen depletion during the early phase of the BOLD response4, which would manifest as a rapid decrease in capillary resistance. To allow for further insights into the mechanisms behind the resistance decrease it will be necessary to include blood and gray matter oxygenation into the modeling of capillary resistance.
Acknowledgements
We thank Andreas Linninger and Timothy Secomb for helpfull discussions.References
1. Yu X, Glen D, Wang S, Dodd S, Hirano Y, Saad Z, Reynolds R, Silva A, Koretsky A, Direct imaging of macrovascular and microvascular contributions to BOLD fMRI in layers IV–V of the rat whisker–barrel cortex. NeuroImage. 2012; 59: 1451–1460.
2. Tian P, Teng I, May L, Kurz R, Lu K, Scadeng M, Hillman E, De Crespigny A, D’Arceuil H, et al., Cortical depth-specific microvascular dilation underlies laminar differences in blood oxygenation level-dependent functional MRI signal. Proc Natl Acad Sci USA. 2010; 107(34):15246-51.
3. Uhlirova H, Kılıc ̧ K, Tian P, Thunemann M, Desjardins M, Saisan P, Sakadžić S, Ness T, et al., Cell type specificity of neurovascular coupling in cerebral cortex. Elife. 2016; 31(5): e14315.
4. Wei H, Kang H, Rasheed I, Zhou S, Lou N, Gershteyn A, McConnell E, Wang Y, et al., Erythrocytes Are Oxygen-Sensing Regulators of the Cerebral Microcirculation. Neuron. 2016; 17:91(4):851-862.
5. Gould I, Linninger A, Hematocrit Distribution and Tissue Oxygenation in Large Microcirculatory Networks. Microcirculation. 2015;22(1):1-18.
6. Gagnon L, Sakadžić S, et al. Quantifying the Microvascular Origin of BOLD-fMRI from First Principles with Two-Photon Microscopy and an Oxygen-Sensitive Nanoprobe. J. Neurosci. 2015; 35(8): 3663–3675.
7. Gagnon L, Sakadžić S, Lesage F, Pouliot P, Dale A, Devor A, Buxton R, Boas D, Validation and optimization of hypercapnic-calibrated fMRI from oxygen-sensitive two-photon microscopy. Philos Trans R Soc Lond B Biol Sci. 2016; B 371: 20150359.
8. Fang Q, Sakadžić S, Ruvinskaya L, Devor A, Dale A, Boas D, Oxygen Advection and Diffusion in a Three Dimensional Vascular Anatomical Network. Opt Express. 2008; 16(22): 17530–17541.
9. Boas D, Jones S, Devor A, Huppert T, Dale A, A vascular anatomical network model of the spatio-temporal response to brain activation. Neuroimage. 2008; 40(3): 1116–1129.
10. Pathak AP, Ward BD, Schmainda KM. A novel technique for modeling susceptibility-based contrast mechanisms for arbitrary microvascular geometries: the finite perturber method. Neuroimage 2008; 40(3): 1130-43.
Figures