1098
Accelerated 4D Flow MRI with wave-CAIPI1Department of Diagnostic and Interventional Radiology, University Hospital Würzburg, Würzburg, Germany, 2Comprehensive Heart Failure Center Würzburg, Würzburg, Germany, 3Siemens Healthcare, Erlangen, Germany, 4Siemens Medical Solutions USA, Inc., Chicago, IL, United States
Synopsis
The wave-CAIPI technique was applied to aortic 4D flow MRI. Three healthy volunteers were examined and flow parameters as well as hemodynamic flow patterns were derived from the measured data. The acquisitions were retrospectively accelerated and compared to conventional Cartesian 2D-CAIPI sampling. Using wave-CAIPI sampling, the deviations between flow parameters of the 6-fold accelerated scans and the references (2-fold accelerated) could be reduced by up to 47% compared to Cartesian sampling. As a consequence, the acquisition time of aortic 4D flow acquisitions could be decreased to 3.5 minutes with higher precision, concerning the calculated flow parameters and hemodynamic flow patterns.
Purpose
Dynamic 3D phase-contrast (4D flow) MRI can be used to evaluate flow parameters and to visualize complex hemodynamic flow patterns. As velocity encodings must be performed in all 3 spatial dimensions, a total of 4 images (3 velocity-encoded, 1 flow-compensated) must be acquired for each cardiac phase, leading to considerable scan times. Parallel Imaging methods can be applied to accelerate the image acquisition; however, a significant noise penalty arises for extensive undersampling. We propose the application of the wave-CAIPI k-space trajectory1–4 for optimized parallel Imaging of accelerated aortic 4D flow acquisitions to achieve an acquisition time of less than 4 minutes.Methods
To assess the performance of the wave-CAIPI technique in aortic 4D flow acquisitions, three healthy volunteers were examined using both wave-CAIPI and Cartesian 2D-CAIPRINHA (Controlled Aliasing in Parallel Imaging Results in Higher Acceleration), or 2D-CAIPI, sampling5,6 in a 3D velocity-encoded gradient echo pulse sequence. All measurements were performed on a 3T clinical MR scanner (MAGNETOM Prismafit, Siemens Healthcare, Erlangen, Germany). Images were acquired in sagittal orientation with a k-space matrix of 128×76×28-30 and a corresponding resolution of 2.5×3.5×3.5 mm. Further sequence parameters were: flip angle 7°, TE 3.40 ms, TR 6.03 ms, temporal resolution 48.24 ms, readout bandwidth 500 Hz/pixel, FOV 320×260×98-105 mm, maximum encoded velocity VENC 200 cm/s. For the wave-CAIPI, 4 complete wave cycles with a maximum oscillation amplitude of 9 mT/m were employed during readout. The average acquisition time was (10:40 ± 01:18) minutes. The same acquisition window of 700 ms was used for all volunteers and 14 cardiac phases were reconstructed using prospective ECG-gating. To account for respiratory motion, the acquisition was prospectively gated, using a navigator at the lung/liver interface with an acceptance window of 8 mm. To mitigate residual motion artifacts, the ReCAR method7, a real-time k-space ordering technique that samples the central k-space in end-expiration and the peripheral k-space during inspiration, was applied. Images were acquired with an undersampling factor of 2 in the phase-encoding (anterior-posterior) direction. Undersampled data sets were reconstructed with an iterative SENSE algorithm8. Coil sensitivity maps were estimated from an additional low-resolution scan with increased FOV in the partition-encoding (left-right) direction, using the Berkeley Advanced Reconstruction Toolbox9. No slice oversampling was employed to account for the imperfect slab-selective RF pulse – instead, parallel Imaging (iterative SENSE8) was used to remove the additional aliasing. The scanner-specific gradient system transfer function was employed to correct for gradient distortions, in order to avoid image artifacts10–13. The acquired data was additionally undersampled retrospectively in partition direction with an acceleration rate of 3, simulating a scan time reduction from (10:40 ± 01:18) minutes to (03:33 ± 0:26) minutes, and flow parameters, as well as hemodynamic flow patterns, visualized via streamlines, were calculated. To ensure comparability between the wave-CAIPI and Cartesian 2D-CAIPI results, the segmentation of the aorta, as well as the placement of analysis planes was performed identically for both sampling strategies.Results
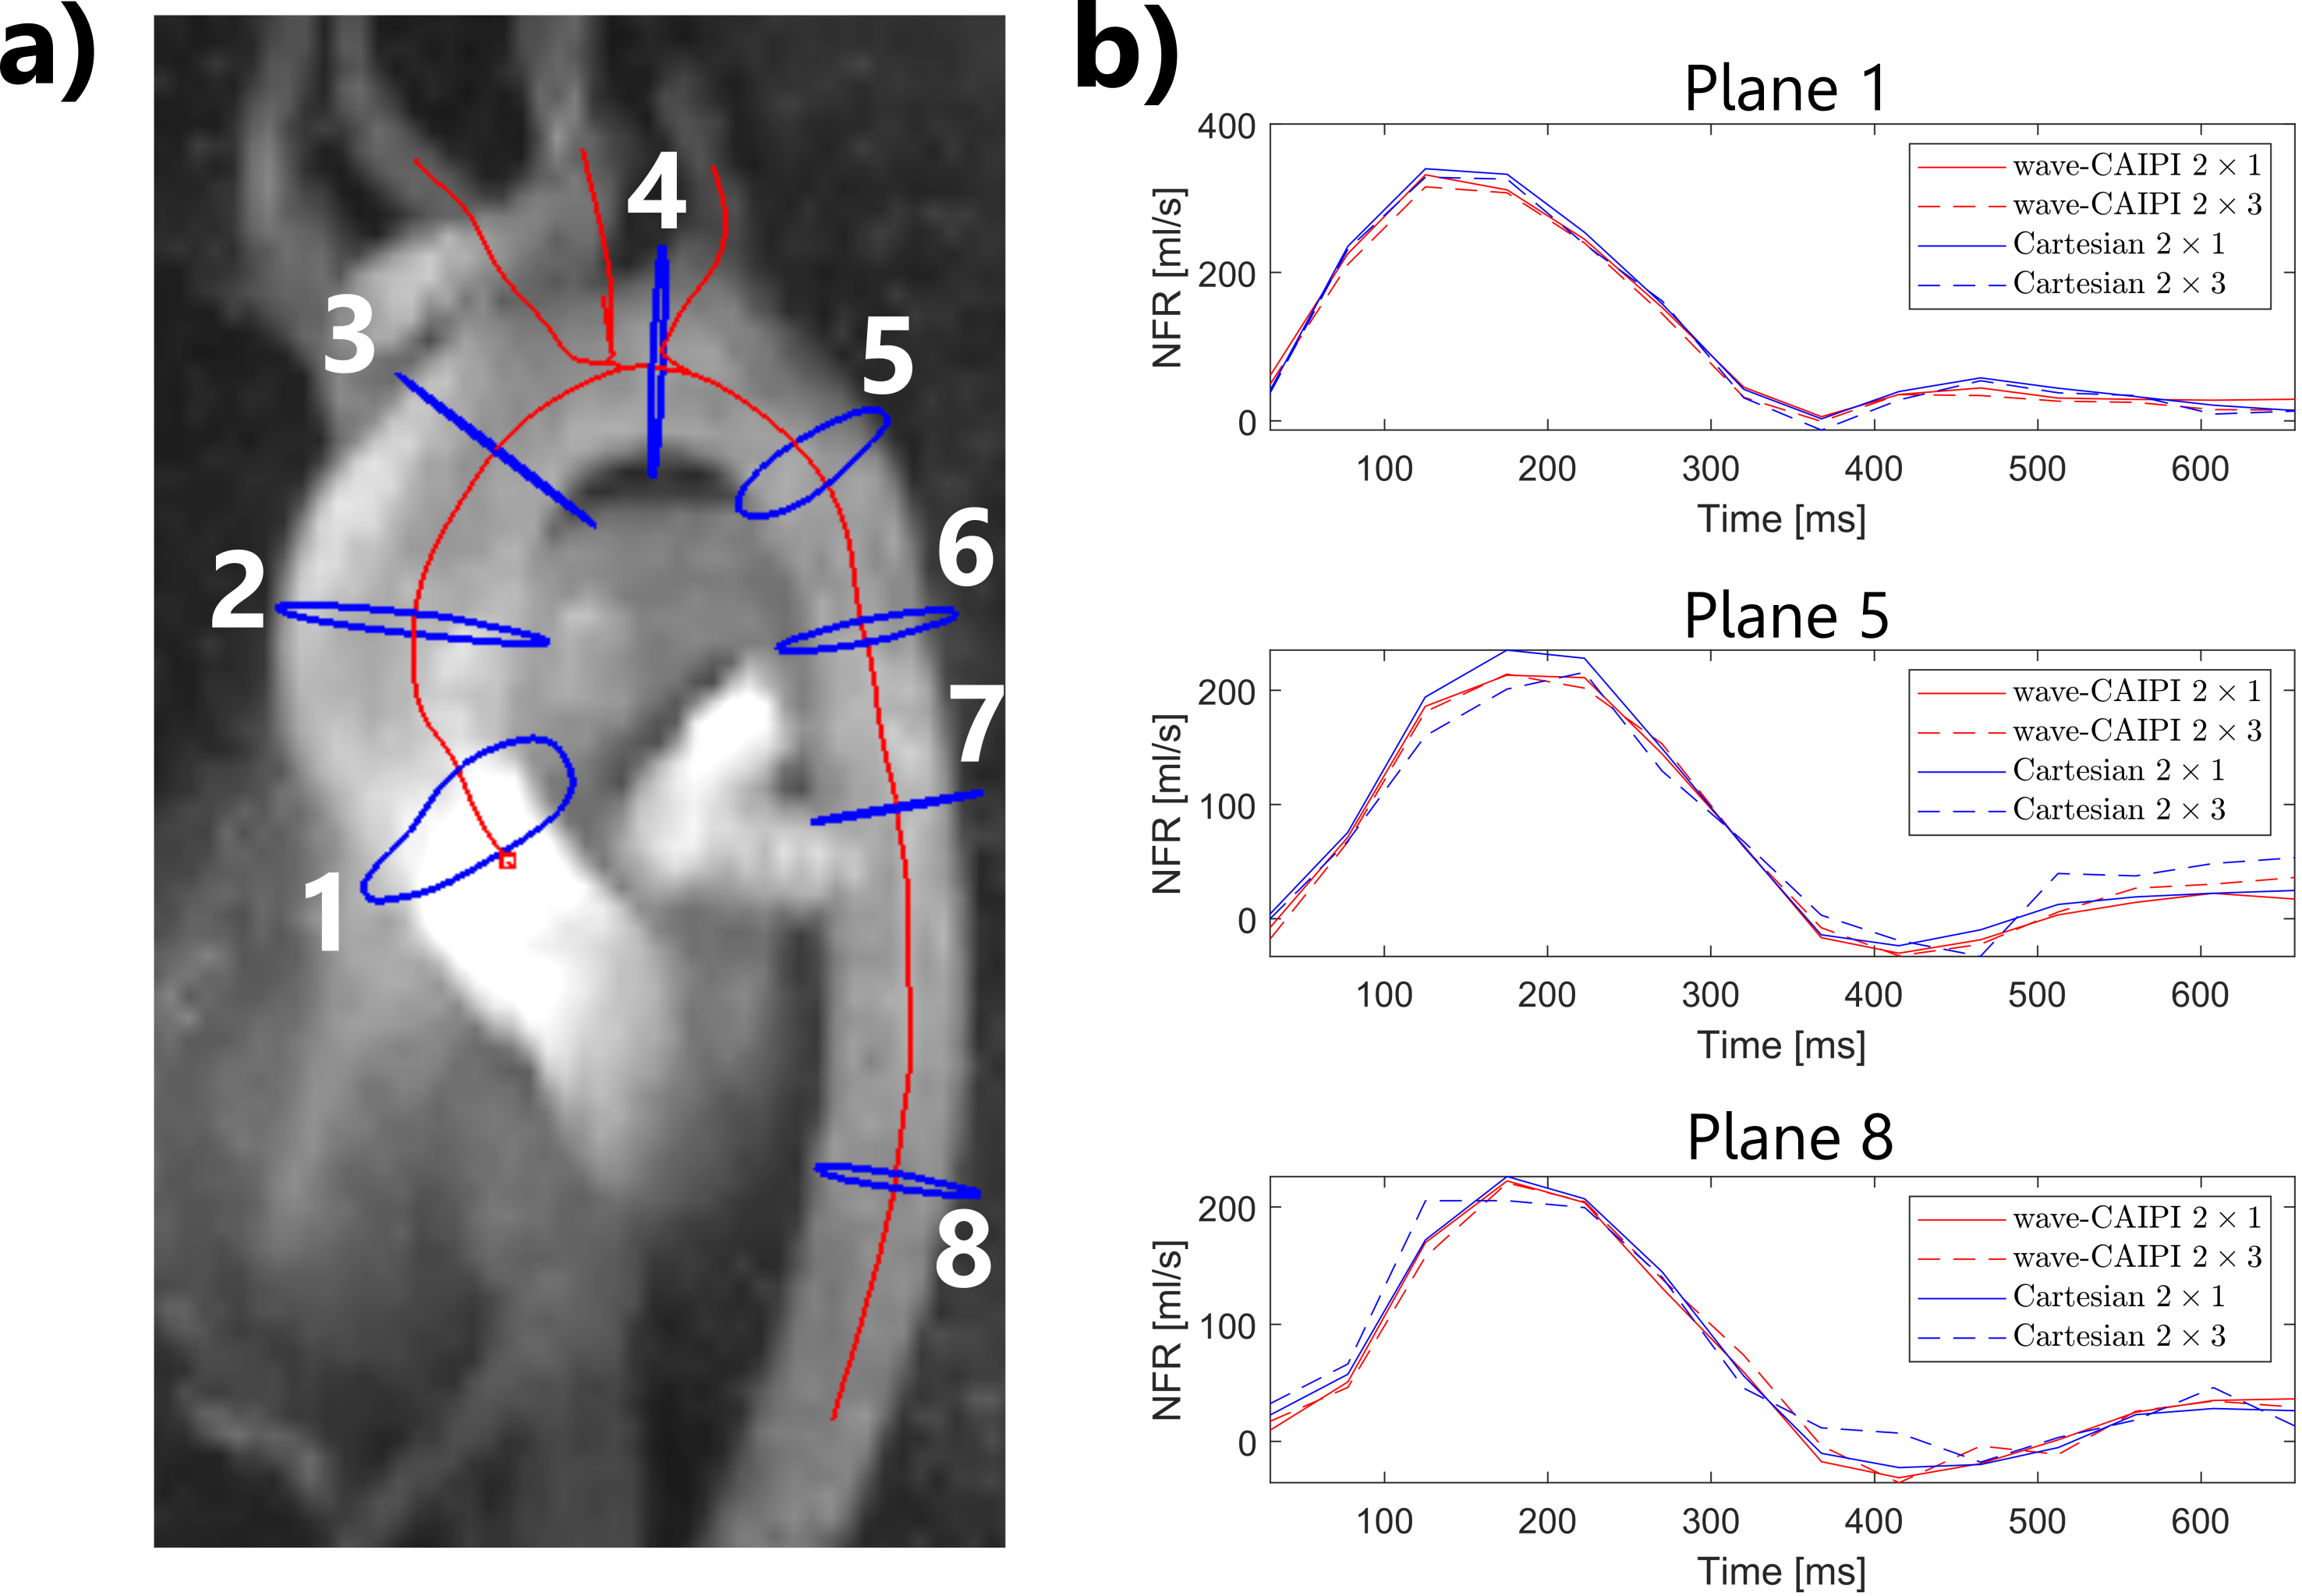
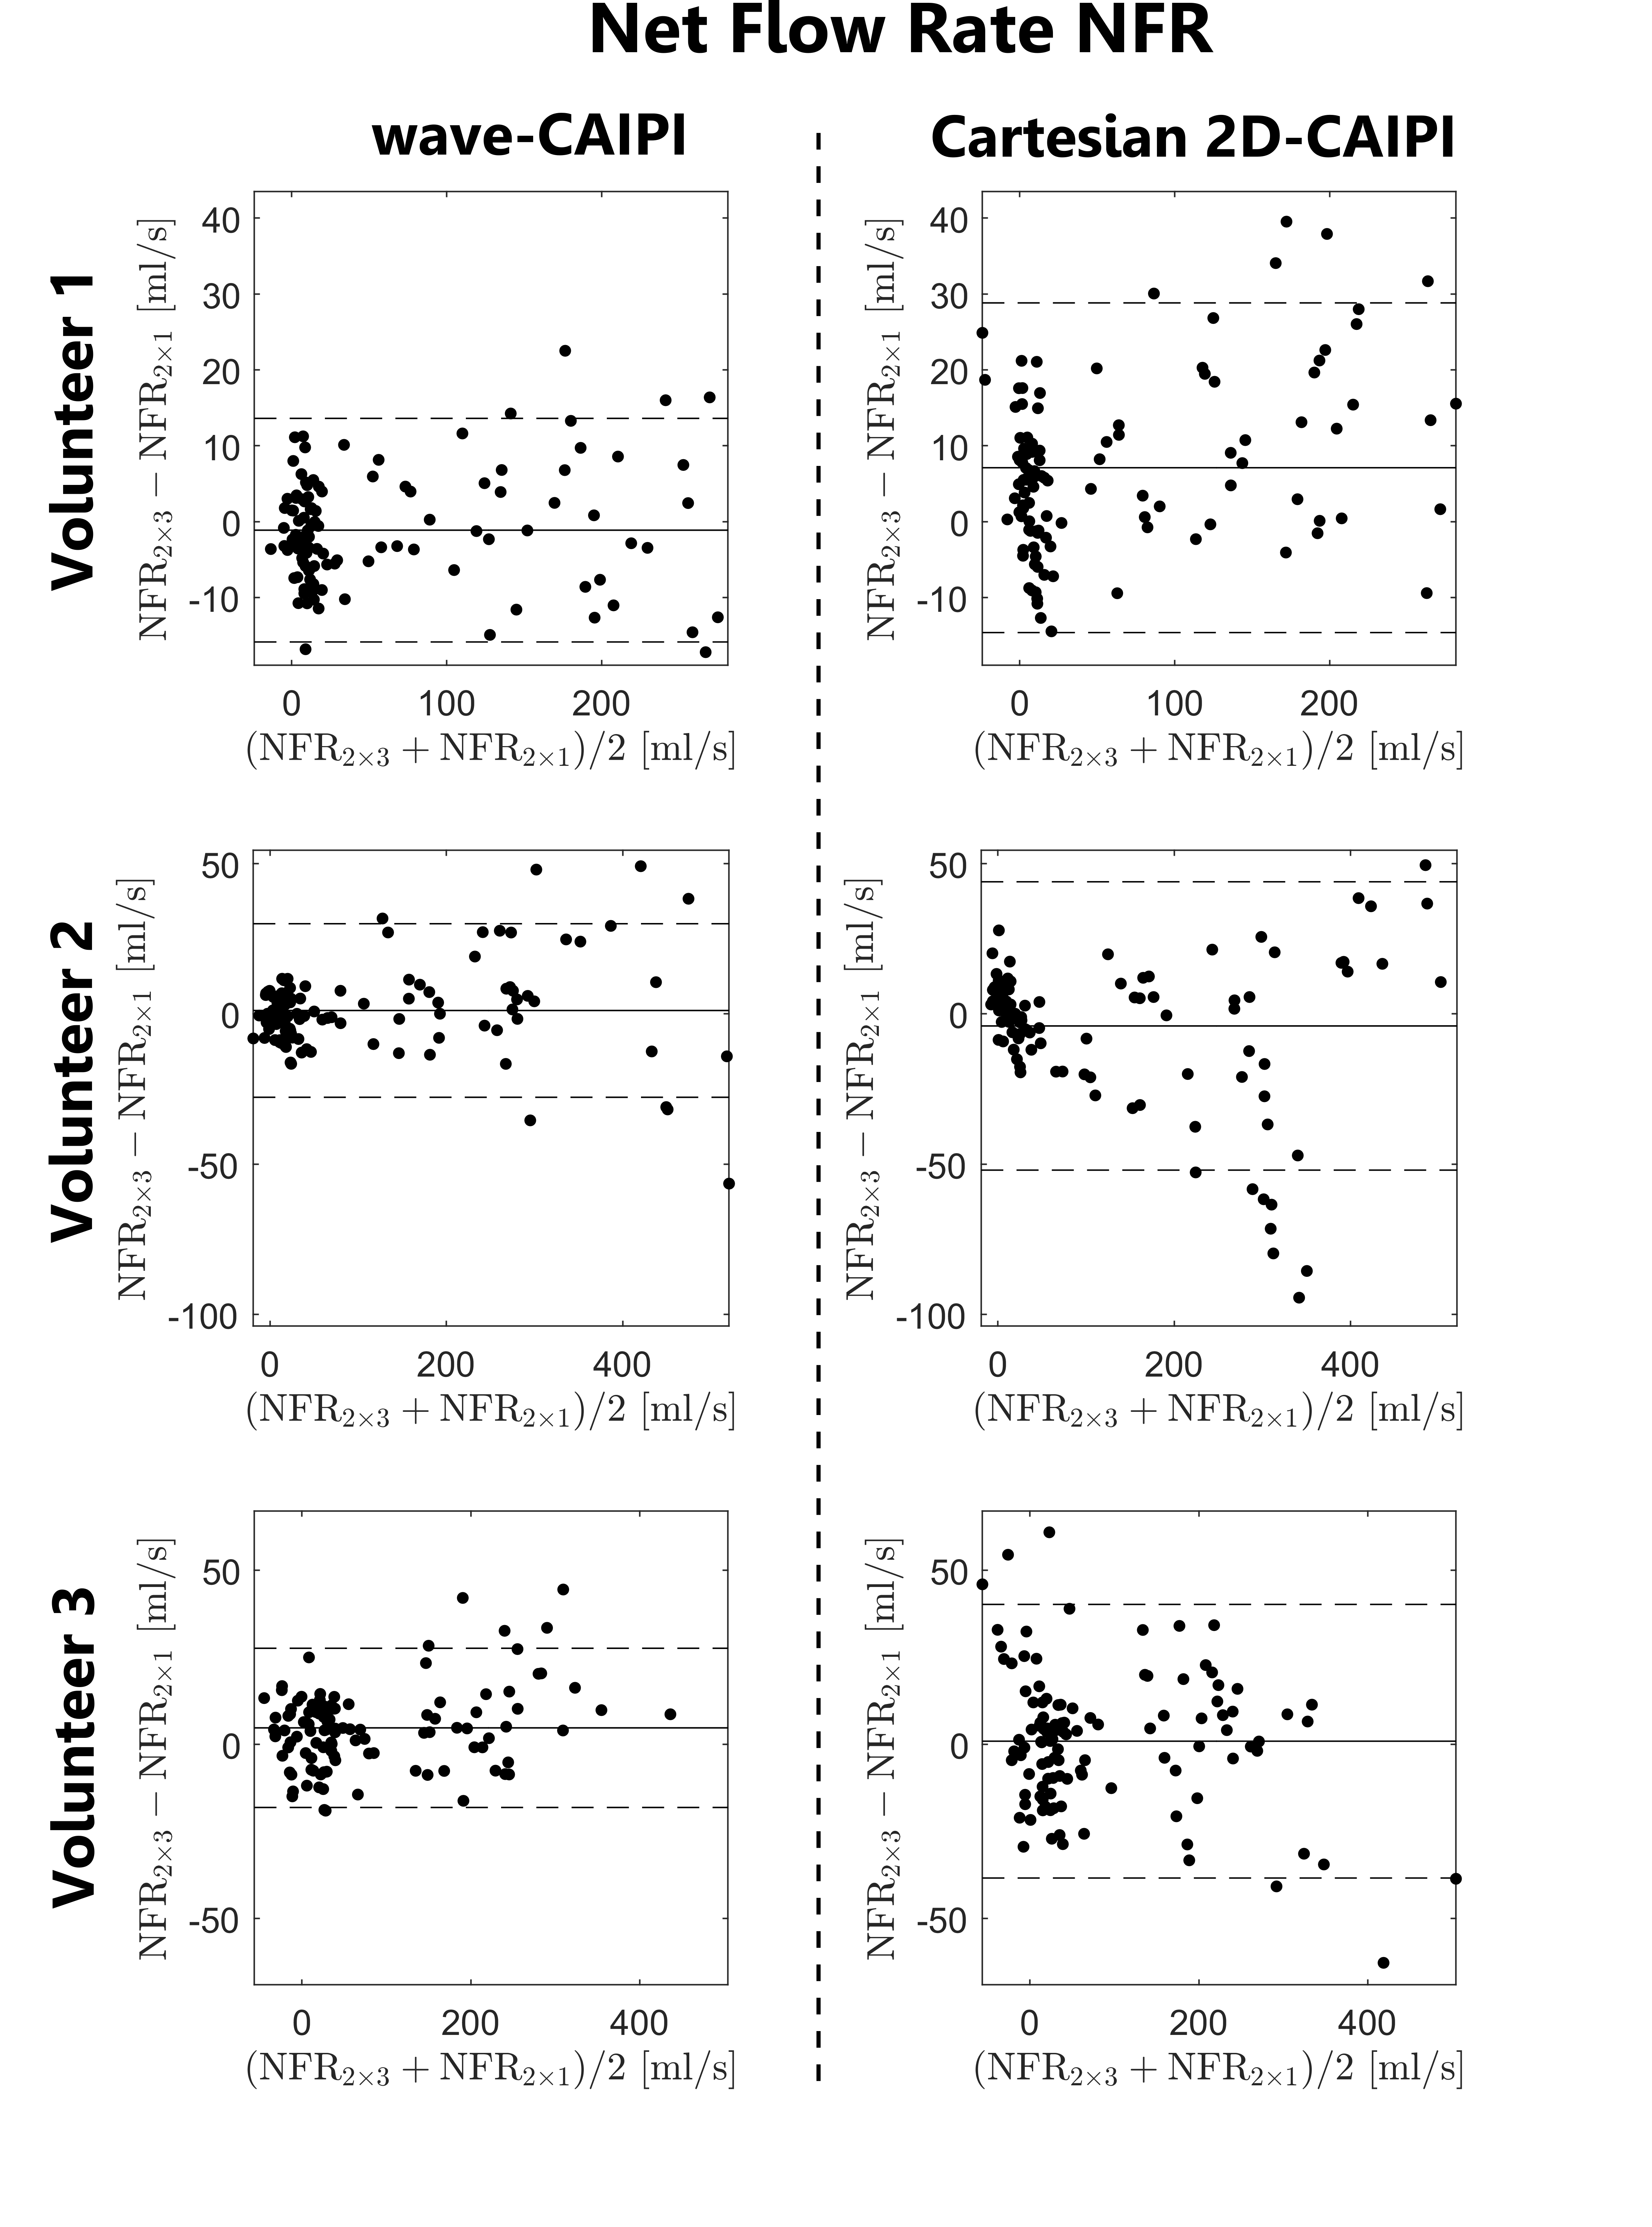
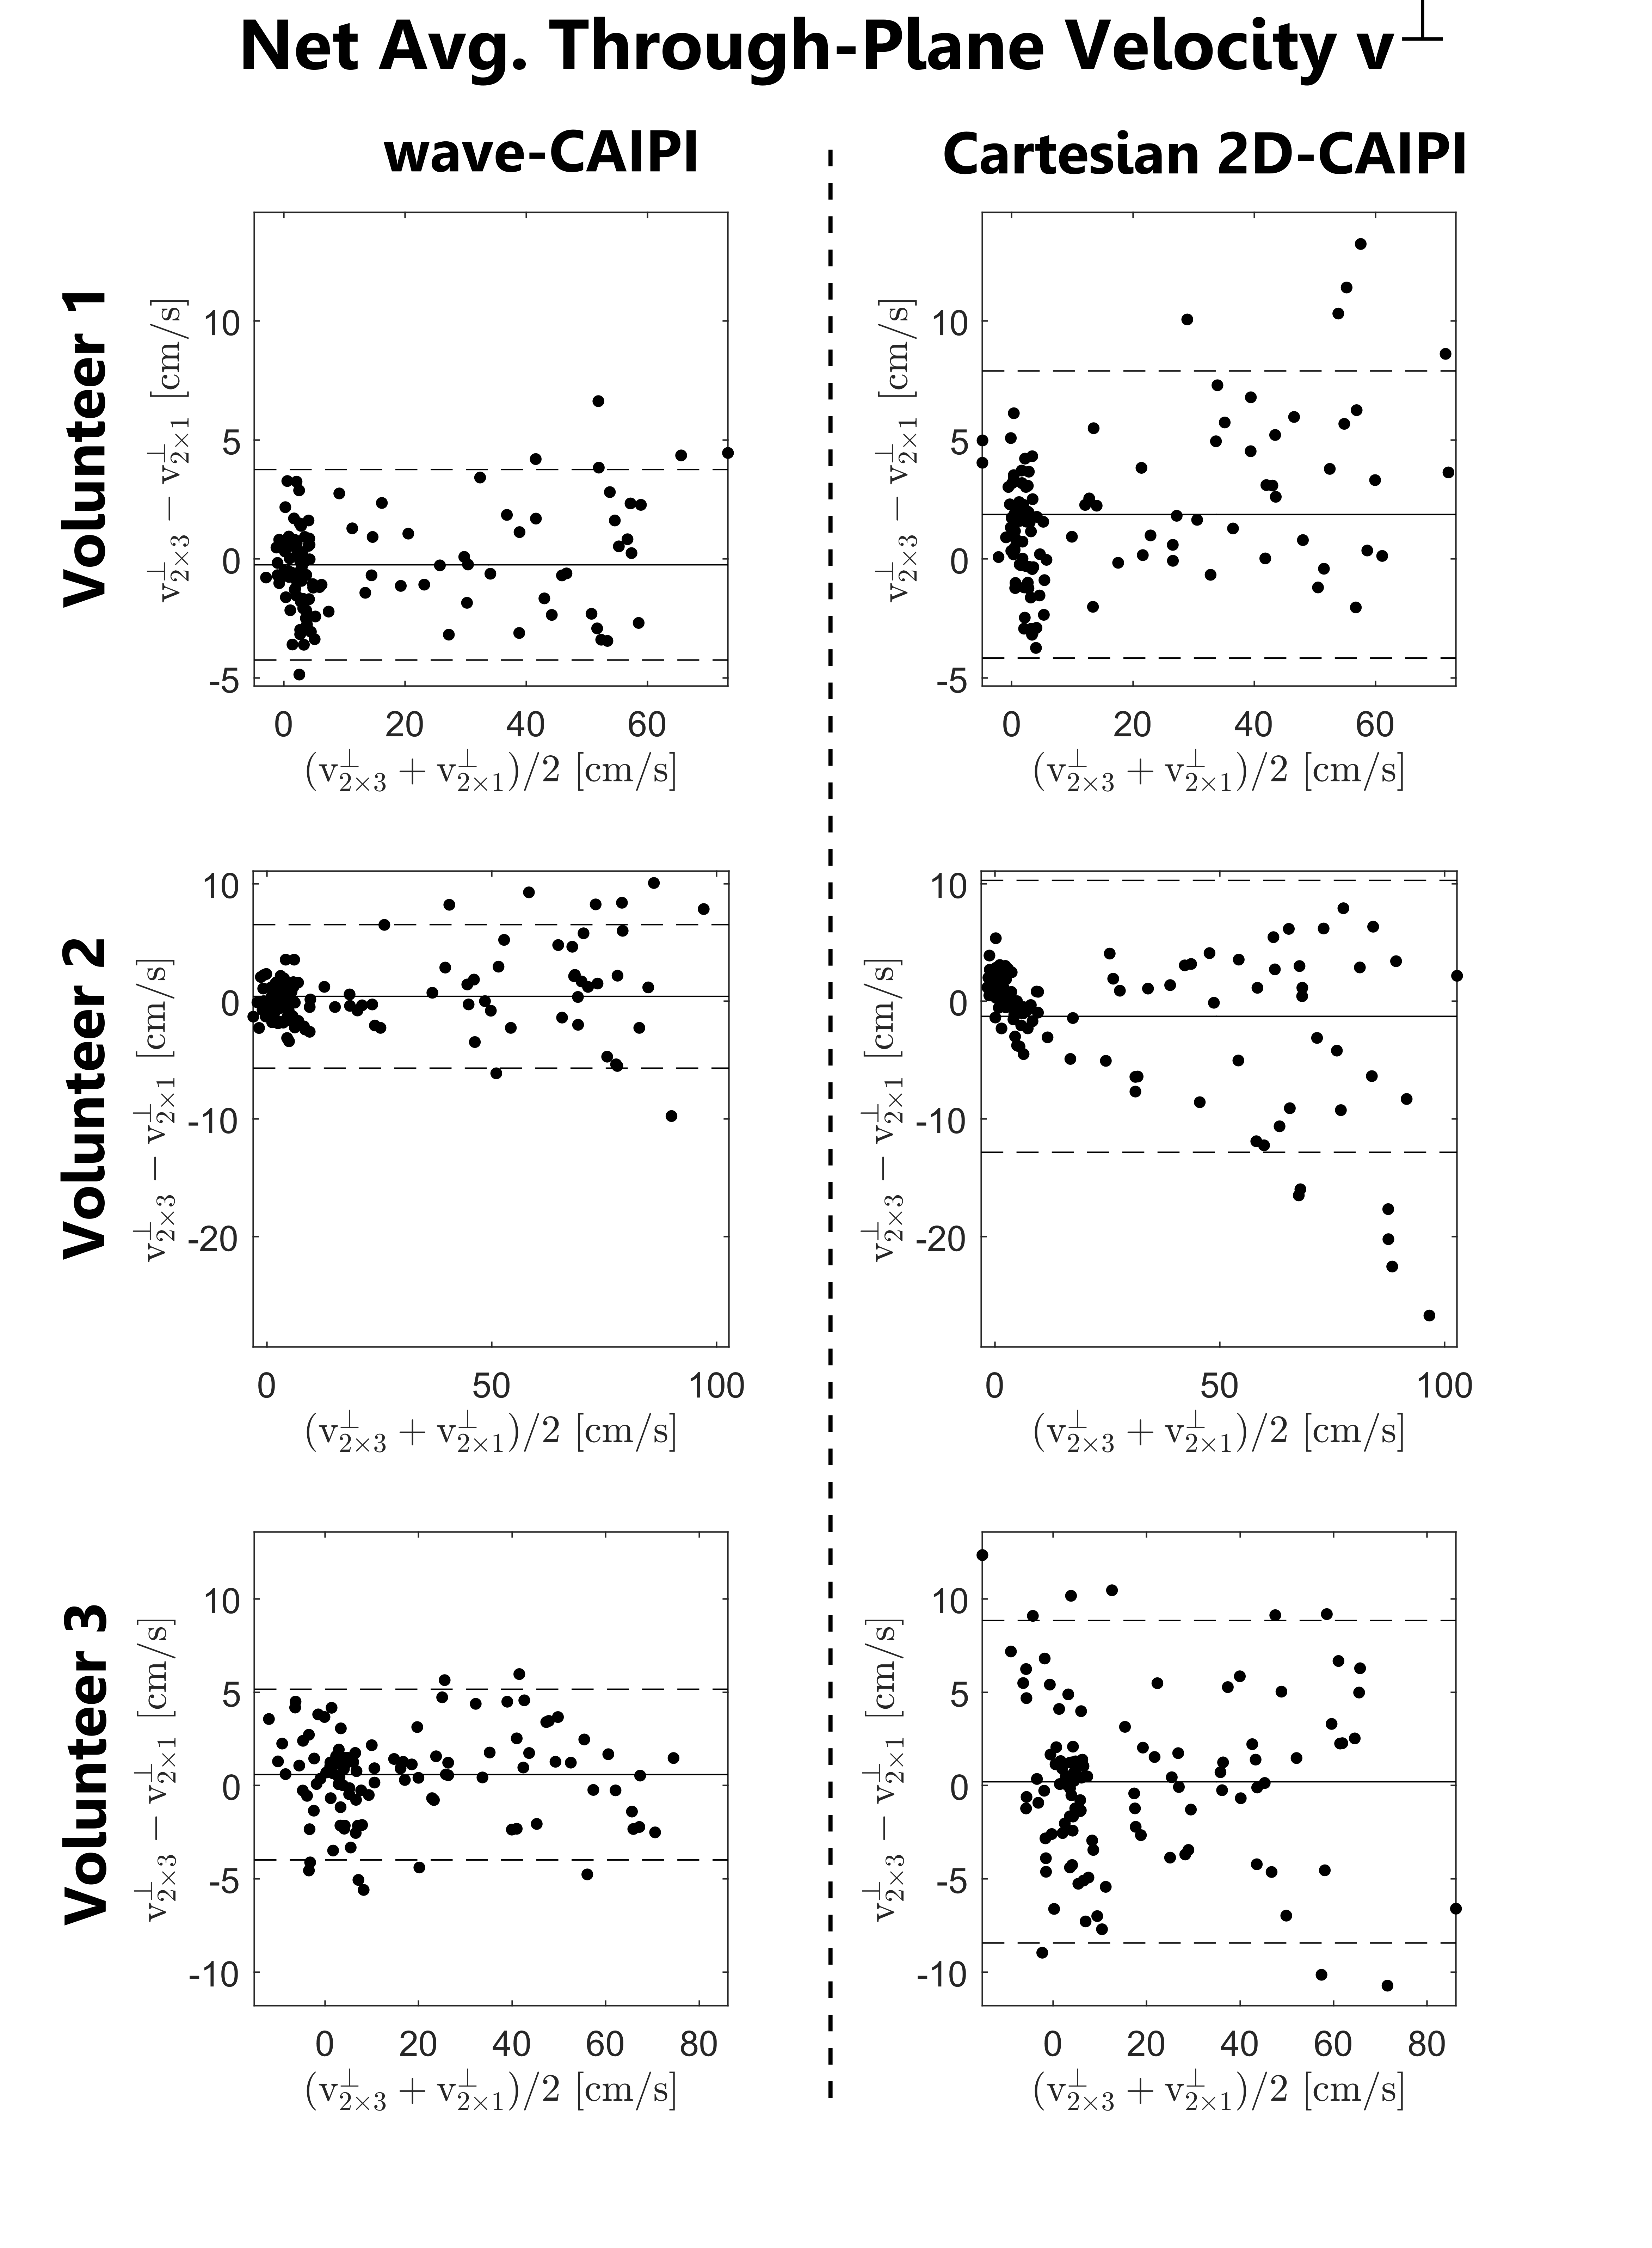
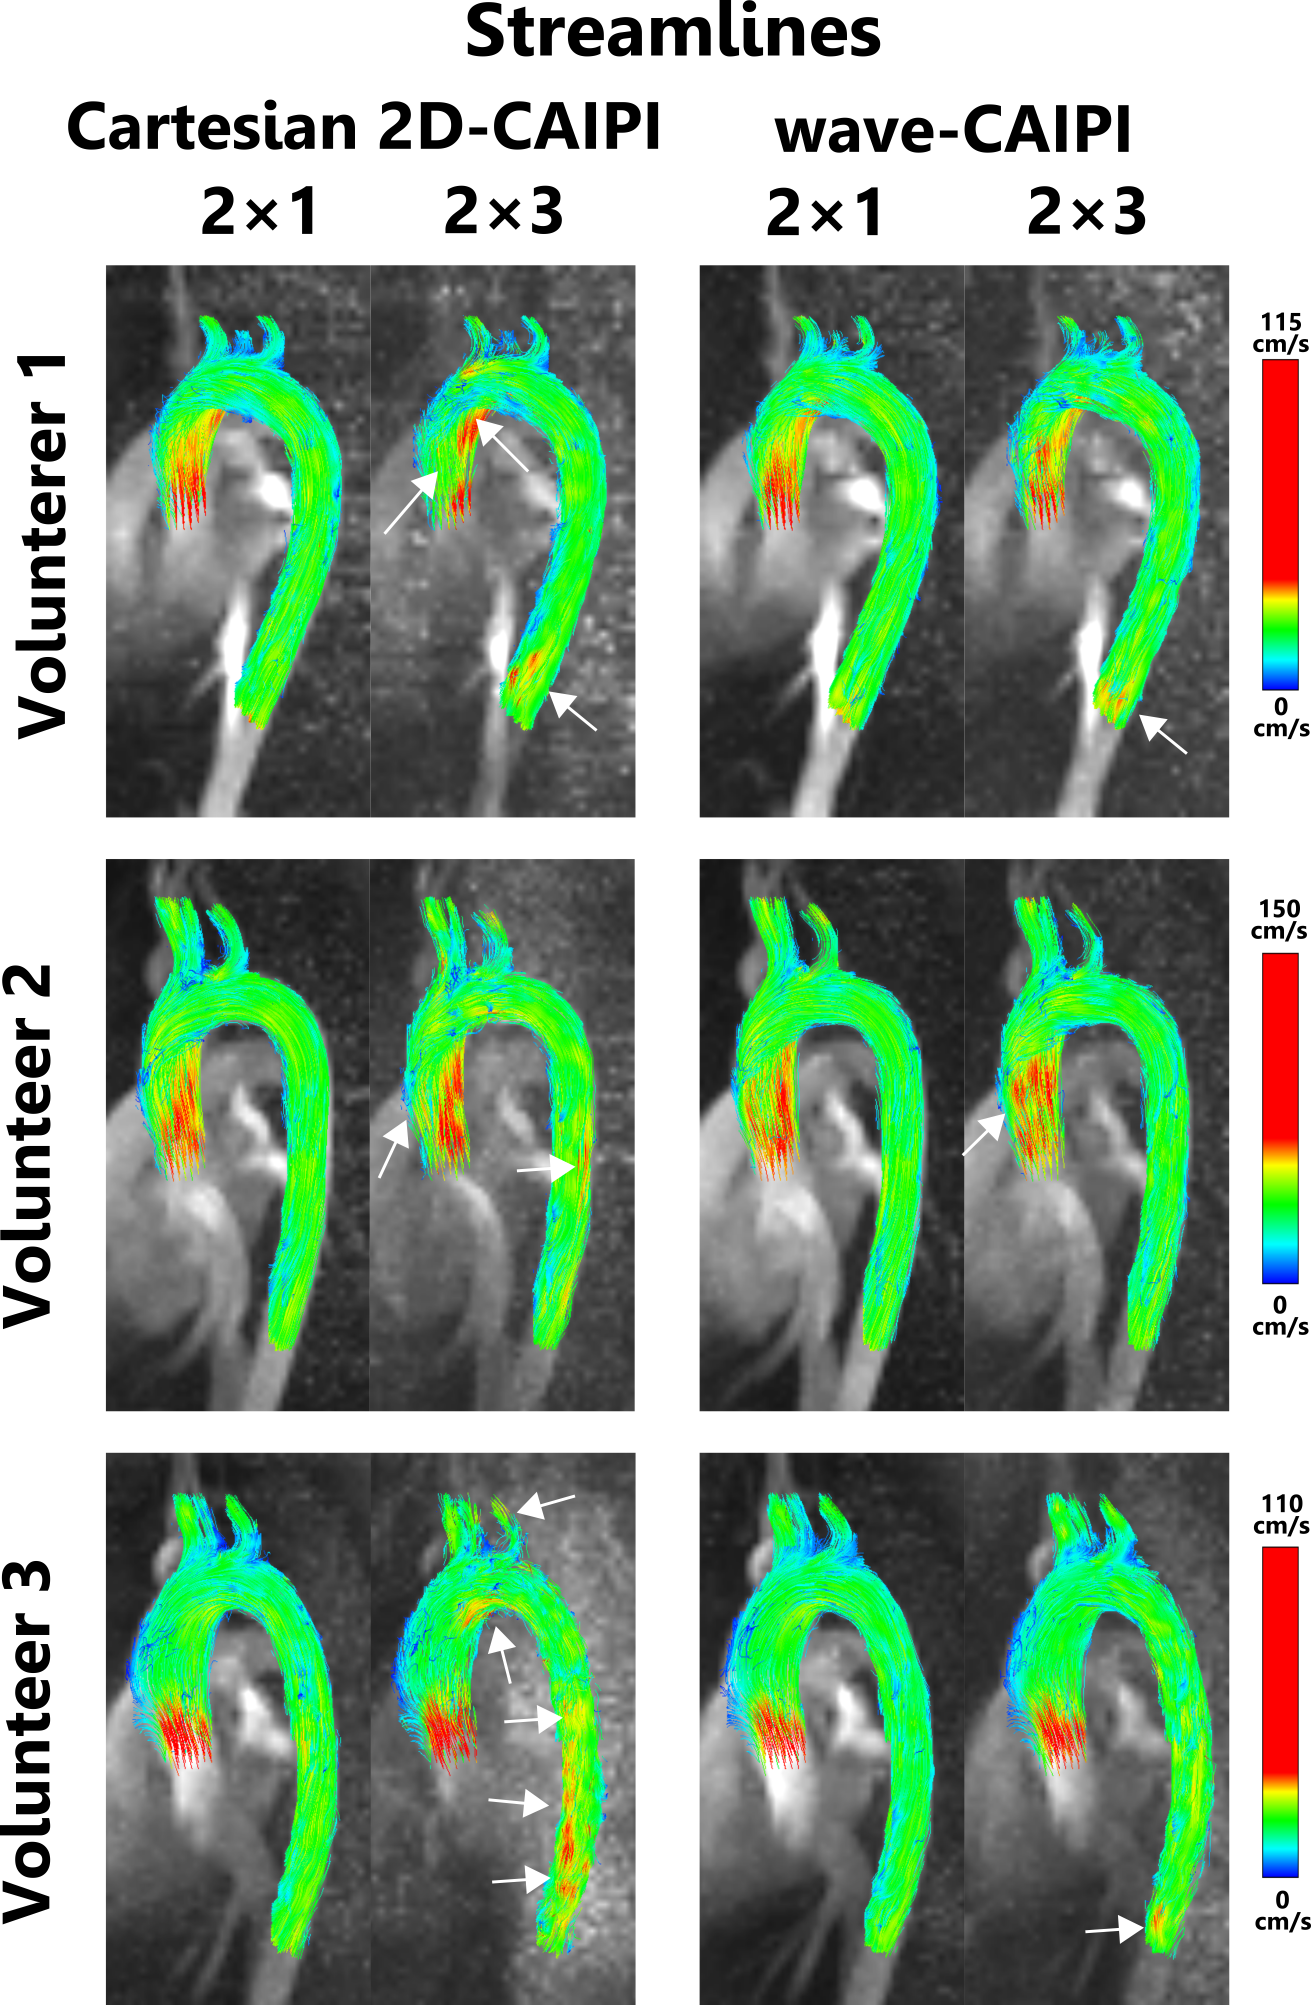
Figure 1 shows the location of 8 analysis planes in the ascending and descending aorta of a healthy volunteer, as well as the calculated net flow rates (NFR) within 3 exemplary planes for wave-CAIPI and Cartesian 2D-CAIPI sampling. The 2×3 accelerated Cartesian acquisition shows a larger deviation from the 2-fold accelerated reference scan than the wave-CAIPI technique. Bland-Altman plots comparing flow parameters of the 2×3 accelerated acquisitions with the parameters of the 2-fold accelerated scans are presented in Figure 2 (net flow rate) and Figure 3 (net average through-plane velocity, $$$v^\perp$$$). The respective data points represent flow parameters calculated in 8 analysis planes (as in Figure 1) and 14 cardiac phases. The wave-CAIPI scans of all three volunteers exhibited a lower standard deviation in both NFR and $$$v^\perp$$$. For the net flow rate, the standard deviation between the two wave-CAIPI data sets was 32 – 42% lower than the corresponding standard deviation in the Cartesian 2D-CAIPI case. For the net average through-plane velocity, the wave-CAIPI standard deviation was between 34 and 47% lower than the Cartesian 2D-CAIPI standard deviation. Hemodynamic flow patterns are visualized in Figure 4 by means of streamlines for wave-CAIPI and Cartesian 2D-CAIPI sampling at peak systole for all three volunteers.Discussion & Conclusion
Due to the wide voxel-spreading properties of the wave-CAIPI point spread function, aliasing artifacts are distributed in all spatial dimensions, and variations in coil sensitivities are used more efficiently in parallel Imaging reconstructions1. As a consequence, the noise enhancement induced by parallel Imaging is significantly reduced, and accelerated phase difference images can be reconstructed with higher precision. Therefore, the calculation of flow parameters using the wave-CAIPI sampling technique is more stable in the case of undersampling. Differences in streamline visualizations between the 2-fold and the 2×3-fold accelerated acquisitions are more pronounced in the Cartesian 2D-CAIPI case. By employing the wave-CAIPI sampling technique, the acquisition time could, in theory, be reduced to (03:33 ± 0:26) minutes with minimal differences in flow parameters and streamline flow visualizations.Funding
Comprehensive Heart Failure Center Würzburg, Grant BMBF 01EO1504Acknowledgements
No acknowledgement found.References
1. Bilgic B, Gagoski BA, Cauley SF, et al. Wave-CAIPI for highly accelerated 3D imaging. Magn Reson Med. 2015;73(6):2152-2162. doi:10.1002/mrm.25347
2. Cauley SF, Setsompop K, Bilgic B, Bhat H, Gagoski B, Wald LL. Autocalibrated wave-CAIPI reconstruction; Joint optimization of k-space trajectory and parallel imaging reconstruction. Magn Reson Med. 2017;78(3):1093-1099. doi:10.1002/mrm.26499
3. Polak D, Setsompop K, Cauley SF, et al. Wave-CAIPI for highly accelerated MP-RAGE imaging. Magn Reson Med. 2018;79(1):401-406. doi:10.1002/mrm.26649
4. Polak D, Cauley S, Huang SY, et al. Highly-accelerated volumetric brain examination using optimized wave-CAIPI encoding. J Magn Reson Imaging JMRI. February 2019. doi:10.1002/jmri.26678
5. Breuer FA, Blaimer M, Mueller MF, et al. Controlled aliasing in volumetric parallel imaging (2D CAIPIRINHA). Magn Reson Med. 2006;55(3):549-556. doi:10.1002/mrm.20787
6. Breuer FA, Blaimer M, Heidemann RM, Mueller MF, Griswold MA, Jakob PM. Controlled aliasing in parallel imaging results in higher acceleration (CAIPIRINHA) for multi-slice imaging. Magn Reson Med. 2005;53(3):684-691. doi:10.1002/mrm.20401
7. Pruessmann KP, Weiger M, Börnert P, Boesiger P. Advances in sensitivity encoding with arbitrary k-space trajectories. Magn Reson Med. 2001;46(4):638-651. doi:10.1002/mrm.1241
8. Ma LE, Markl M, Chow K, et al. Aortic 4D flow MRI in 2 minutes using compressed sensing, respiratory controlled adaptive k-space reordering, and inline reconstruction. Magn Reson Med. 2019;81(6):3675-3690. doi:10.1002/mrm.27684
9. Martin Uecker, Frank Ong, Jonathan I Tamir, et al. Berkeley Advanced Reconstruction Toolbox. In: Proc. Intl. Soc. Mag. Reson. Med. Vol 23. ; 2015.
10. Stich M, Wech T, Slawig A, et al. Gradient waveform pre-emphasis based on the gradient system transfer function. Magn Reson Med. 2018;80(4):1521-1532. doi:10.1002/mrm.27147
11. Vannesjo SJ, Haeberlin M, Kasper L, et al. Gradient system characterization by impulse response measurements with a dynamic field camera. Magn Reson Med. 2013;69(2):583-593. doi:10.1002/mrm.24263
12. Vannesjo SJ, Graedel NN, Kasper L, et al. Image reconstruction using a gradient impulse response model for trajectory prediction. Magn Reson Med. 2016;76(1):45-58. doi:10.1002/mrm.25841
13. Campbell-Washburn AE, Xue H, Lederman RJ, Faranesh AZ, Hansen MS. Real-time distortion correction of spiral and echo planar images using the gradient system impulse response function. Magn Reson Med. 2016;75(6):2278-2285. doi:10.1002/mrm.25788
Figures