1096
Fully automated assessment of myocardial ischemic burden – a joint perfusion and viability mapping approach1King's College London, London, United Kingdom, 2Eindhoven University of Technology, Eindhoven, Netherlands, 3Philips Healthcare, Best, Netherlands
Synopsis
Quantitative myocardial perfusion MRI has the potential to guide the management of patients with coronary artery disease. It has been shown to have high prognostic value and has the benefit of being automated and user-independent. However, a known limitation of the technique is that it cannot distinguish between perfusion defects that are due to a previous infarction and inducible ischemia. In this work we combine quantitative myocardial perfusion with a further automated pipeline for scar quantification from LGE images. It is shown that this combined assessment can identify areas of inducible ischemia in which the tissue is viable.
Introduction
Cardiovascular magnetic resonance (CMR) has become an established method for the assessment of patients with coronary artery disease (CAD). Recently, stress perfusion CMR has been shown to be non-inferior to invasive measurements for guiding the management of patients with stable angina.1 However, it is known that these patients will only benefit from revascularization if there is a sufficient amount of viable myocardium. In this work we propose a fully automated approach which uses a deep learning pipeline for quantitative perfusion analysis to identify areas of reduced perfusion and a further deep learning pipeline for scar identification and quantification from late gadolinium enhancement (LGE) CMR to classify regions as either scarred or viable. This allows the automated computation of the true ischemic burden of a patient.Our group have previously developed a technique to allow the simultaneous visualization of quantitative perfusion and scar,2 this was shown to significantly reduce the overestimation of the ischemic burden as compared to quantitative perfusion alone. However, this work required extensive manual interaction and to our knowledge, the pipeline we propose now is the first fully automated approach to joint myocardial ischemia and viability assessment.
Methods
Perfusion was quantified according to a recently proposed automated pipeline. This involves first motion correcting the image series.3 The motion corrected image series are then passed to a deep learning-based image processing pipeline which segments the myocardium, left ventricle (LV) and right ventricular (RV) insertion points in order to extract the curves needed for the tracer-kinetic modelling.4 The quantitative modelling uses a two-compartment exchange model which is fit to the data in order to estimate perfusion using a Bayesian inference scheme.5 The perfusion quantification is done initially pixel-wise and subsequently the RV insertion points are used to compute the segment-wise values corresponding to the standard American Heart Association (AHA) 16 segments.For the purpose of this work, the three slices of the LGE stack that are closest in position to the three slices of the perfusion image series are automatically identified and processed. The LGE images are also processed according to a recently proposed pipeline allowing automated scar quantification.6 This pipeline again uses deep learning in order to segment the myocardium and RV insertion points. Regions of scar are then segmented, if existent, in the myocardium by fitting a Gaussian mixture model (GMM) to superpixel regions generated in the myocardium. A one class (either all scar or all viable tissue) and two class (co-existent scar and viable tissue) GMM are fit with the model which yields the lower Bayesian information criterion being chosen. In the case of this being the two class model, the superpixels belonging to the Gaussian distribution with the higher mean are classified as scar. The RV insertion points are used to relate the scar segmentation to the standard AHA 16 segments. A segment is deemed to be infarcted if there is >50% scar.
Combined quantitative perfusion and LGE maps are then created allowing the calculation of the ischemic burden with and without inclusion of areas of overt myocardial scar. The technique was tested in fifteen patients referred to our centre suspected of having coronary artery disease who received both stress perfusion and LGE CMR imaging. The assessment based on the automated processing is compared to the visual read by an expert operator. Receiver operating characteristic (ROC) analysis is used to determine the accuracy of the detection of perfusion defects and the ability to distinguish between scarred and ischemic but viable myocardium.
Results
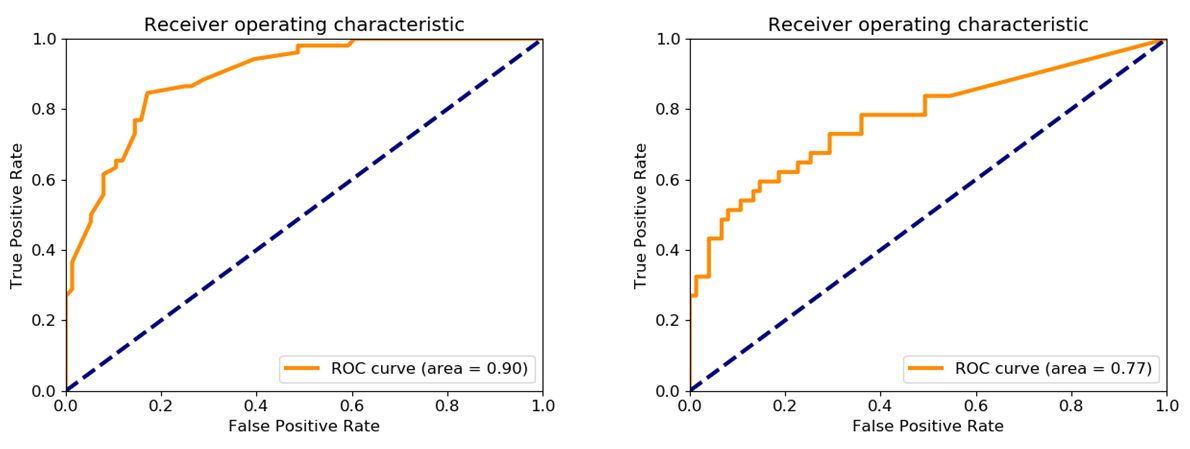
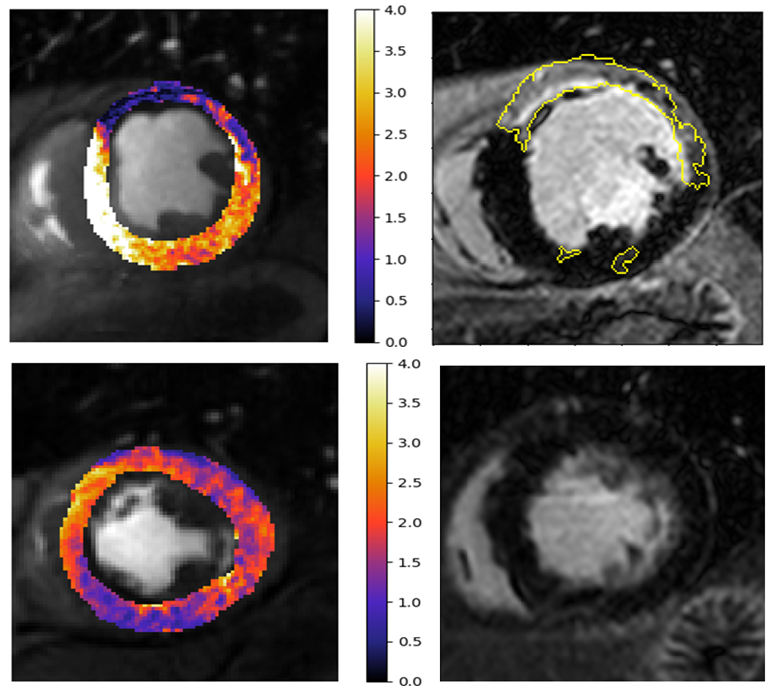
The results of the ROC analysis is shown in Figure 1. The derived cut-off for the identification of reduced perfusion was 1.58 mL/min/g. The area under the ROC curves was 0.90 for the identification of perfusion defects and 0.77 for the joint assessment of both reduced perfusion and viability.Figure 2 shows two example patients with perfusion defects on the quantitative perfusion maps, one with scar and one without. This demonstrates the ability to differentiate between inducible perfusion defects and scarred myocardium.
Discussion and conclusion
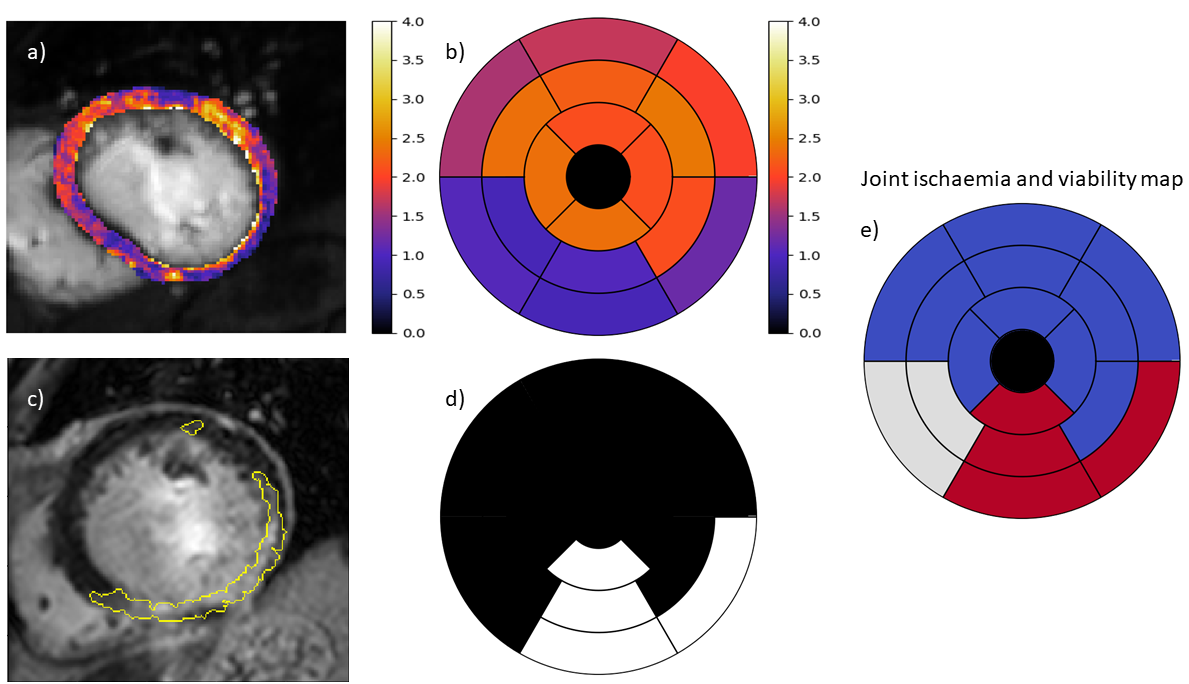
The main motivation of this work is that the presence of LGE leads to an overestimation of the ischemic burden on the quantitative perfusion analysis. While this has been reported previously, it is not often taken into consideration as it necessitates time consuming manual processing. In this work, we have shown that it is possible to achieve this in a fully automated manner and that our resulting pipeline can accurately identify areas of reduced perfusion while assessing whether or not these regions are viable. This can even allow the automated identification of areas of peri-infarct ischemia, as seen in Figure 3. These regions are easily misread on visual assessment.The main limitation of this work is that areas of peri-infarct ischemia are commonly small and may be lost at the resolution of this segment-wise analysis. Further work is required in order to conduct this analysis at a higher resolution. We conclude that our approach will potentially have important clinical impact, in particular for the automated guidance of the management of patients but first requires more extensive validation.
Acknowledgements
The authors acknowledge financial support from the King’s College London & Imperial College London EPSRC Centre for Doctoral Training in Medical Imaging (EP/L015226/1); Philips Healthcare; The Alan Turing Institute under the EPSRC grant EP/N510129/1; The Department of Health via the National Institute for Health Research (NIHR) comprehensive Biomedical Research Centre award to Guy’s & St Thomas’ NHS Foundation Trust in partnership with King’s College London and King’s College Hospital NHS Foundation Trust and via the NIHR Cardiovascular MedTech Co-operative at Guy’s and St Thomas’ NHS Foundation Trust; The Centre of Excellence in Medical Engineering funded by the Wellcome Trust and EPSRC under grant number WT 088641/Z/09/Z.References
[1] Nagel, E. et al. New England Journal of Medicine 2019
[2] Villa, ADM. et al. Journal of Cardiovascular Magnetic Resonance 2016
[3] Scannell, CM, et al. IEEE Transactions on Medical Imaging 2019
[4] Scannell, CM. et al. Medical Image Analysis (accepted) 2019
[5] Scannell, CM. et al. Journal of Magnetic Resonance Imaging 2019
[6] Scannell, CM. et al. ISMRM (submitted) 2020
Figures