1095
Vessel architectural imaging in the human heart using heartbeat-to-heartbeat GESE-EPI1A.A. Martinos Center for Biomedical Imaging, Massachusetts General Hospital, Boston, MA, United States, 2Department of Radiology, University Medical Center Groningen, Groningen, Netherlands, 3Department of Radiology, Harvard Medical School, Boston, MA, United States, 4Department of Diagnostic Physics, Oslo University Hospital, Oslo, Norway, 5Cardiovascular Research Center, Massachusetts General Hospital, Boston, MA, United States, 6Department of Medicine, Harvard Medical School, Boston, MA, United States, 7Division of Health Sciences and Technology, Harvard-MIT, Cambridge, MA, United States, 8Department of Nuclear Medicine and Molecular Imaging, University Medical Center Groningen, Groningen, Netherlands
Synopsis
Vessel architectural imaging (VAI) is explored in the heart by using a heartbeat-to-heartbeat GESE-EPI sequence upon injection of Gd-DTPA. Cardiac VAI can provide the vascular type, caliber, density and blood volume fraction indices in the myocardium, in line with previous work performed in the brain. Further histological validation of these indices is needed, but our initial results demonstrates the feasibility of this technique to advance cardiovascular research into cardiac microvascular dysfunction.
Introduction
Microvascular dysfunction is an increasing problem in cardiovascular risk population resulting in unexpected heart failure1. For cardiac MR applications the main vascular imaging technique is first-pass perfusion2, which does not provide specific microvascular information. For brain applications a vessel architectural imaging (VAI) approach has been demonstrated which allows for vascular volume, type, architecture and caliber calculations3–6. This technique is based on detecting the simultaneous dynamic T2- and T2*-changes upon injection of a contrast agent5-8. Cardiovascular research in microvascular disease could significantly benefit from the specific readouts that VAI provides. Recently, our group has shown that a GESE-EPI sequence gives stable heartbeat-to-heartbeat T2- and T2*-readouts9,10. In this work we evaluate this sequence in combination with a Gd-DTPA administration to determine the initial feasibility of cardiac VAI.Methods
A cardiac GESE-EPI sequence was applied in 10 healthy participants on a 3T-Skyra (Siemens) with a Body-18/Spine-32 coil to acquire dynamic T2- and T2*-maps in a short-axis direction. The first dynamic acquisition was performed during a maximum achievable breath-hold to determine the oxygenation response9,10, while a second acquisition was done during a Gd-DTPA (0.2mmol/kg,4ml/s) injection over a second maximum achievable breath-hold for cardiac VAI. The sequence parameters were previously described9,10 including: 2-GE(TE)=9.8/23.6ms,3-mixed-SE(TE)=38.8/51.9/66.1ms,readout=120ms,TR=RR-interval. T2- and T2*-maps per heartbeat were created using an iterative parameter fitting technique11. The first TE of each heartbeat was used for segmentation and manually drawing a septal ROI12.A dual-Gaussian membership function was fit to the dynamic $$$R_2=\frac{1}{T_2}$$$ and $$$R_2^*=\frac{1}{T_2^*}$$$ time-plots using nonlinear least-squares estimates. These estimated R2- and R2*-curves were combined in a time-parameterized “vessel vortex”3,6,13,14. According to previously published simulations3,5,6 the direction of the vortex indicates the predominant vessel type, which is either arterioles-dominated (clockwise), venule-dominated (counter-clockwise), or a mixture and/or capillaries (straight). Furthermore, the long axes of the vortex (Vindex) is proportional to the blood volume fraction (fBV)3,4, the slope of the vortex can be used to determine the relative vessel caliber index (Cindex)8,15 and also the relative vascular density index (Qindex) can be calculated16. $$V_{index}=\sqrt{\triangle {R_2^*}^2+\triangle {R_2}^2}$$ $$C_{index}=\frac{\triangle R_2^*}{\triangle R_2}$$ $$Q_{index}=\frac{\triangle R_2^*}{{\triangle R_2}^\frac{2}{3}}$$ Furthermore, a linear fit of the non-contrast-enhanced breath-hold data was used to determine the oxygenation response as a percentage in T2- and T2*-change9,10.
Results
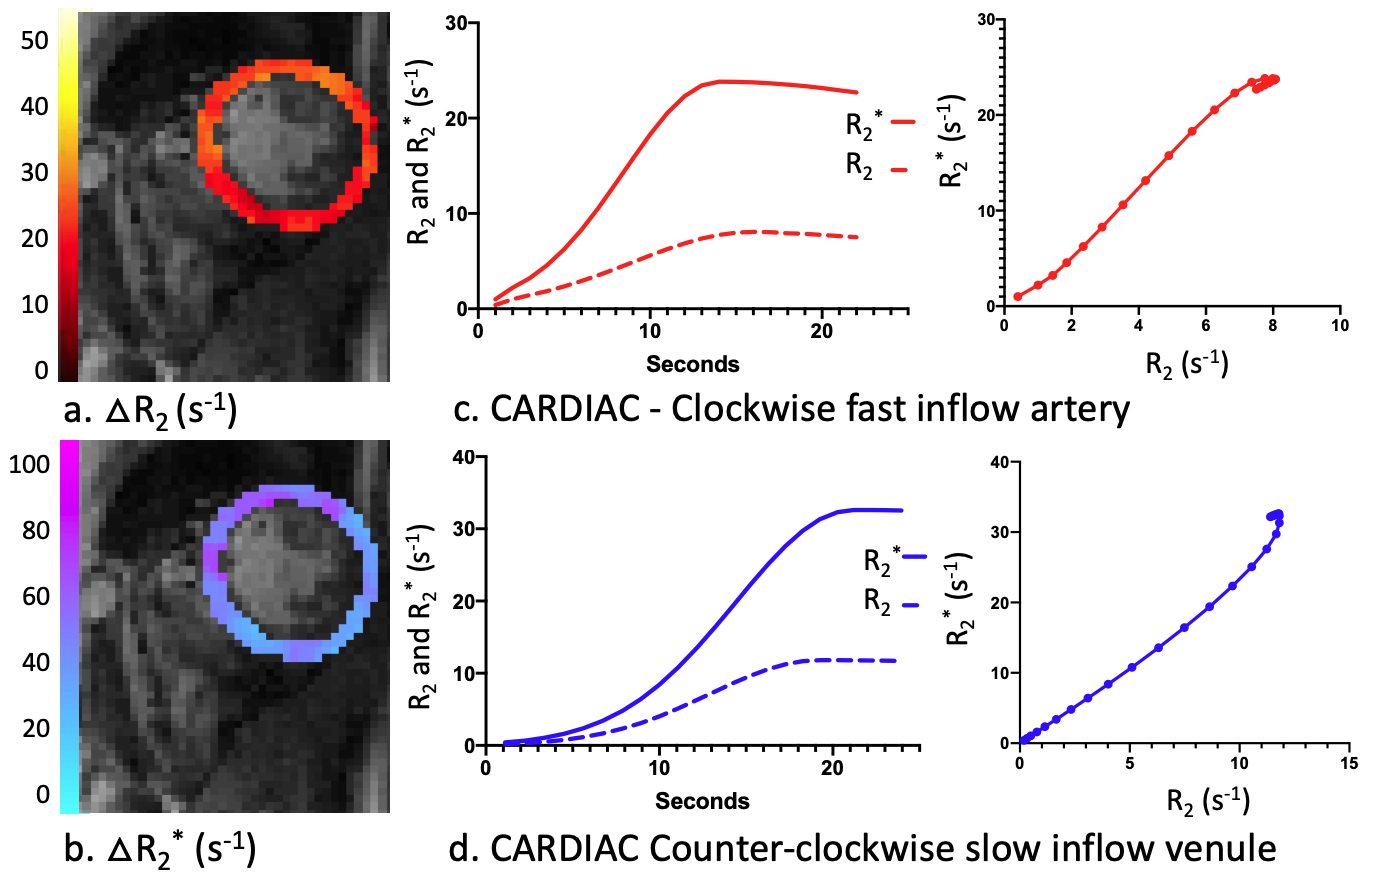
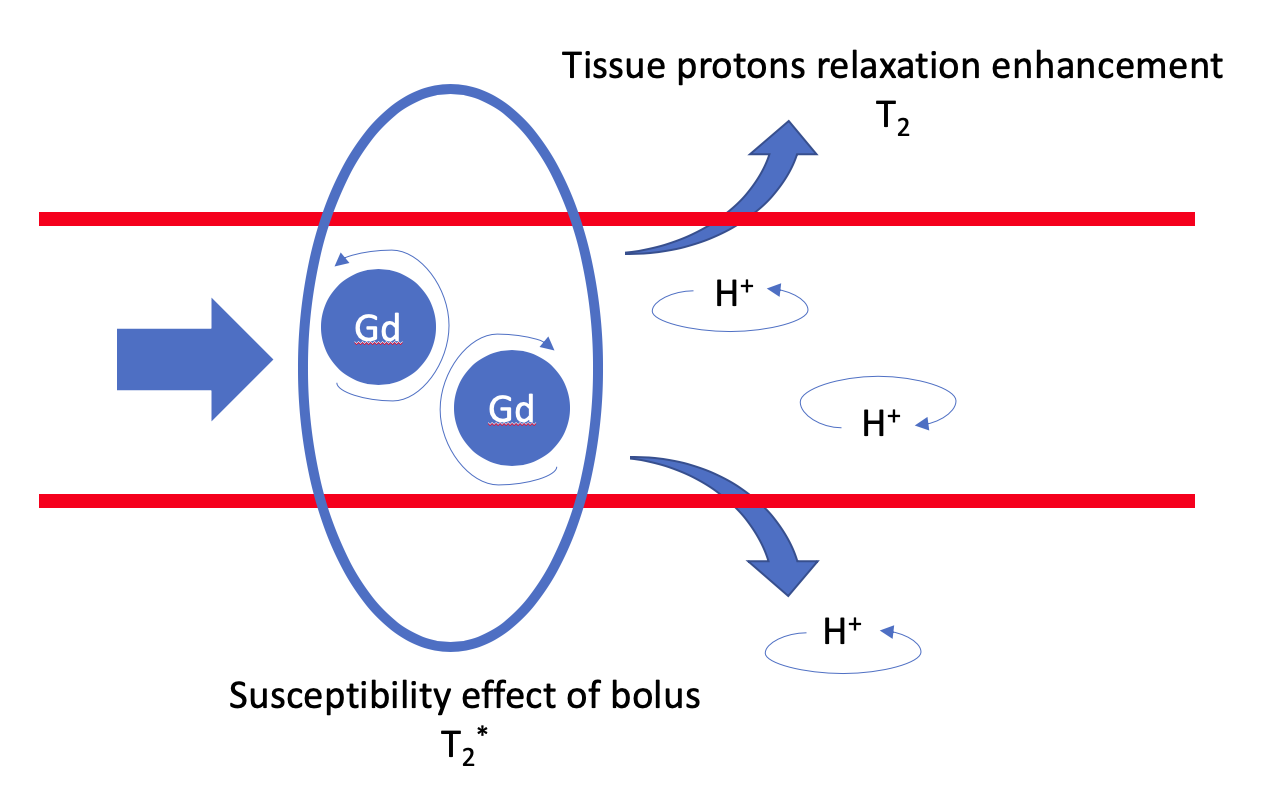
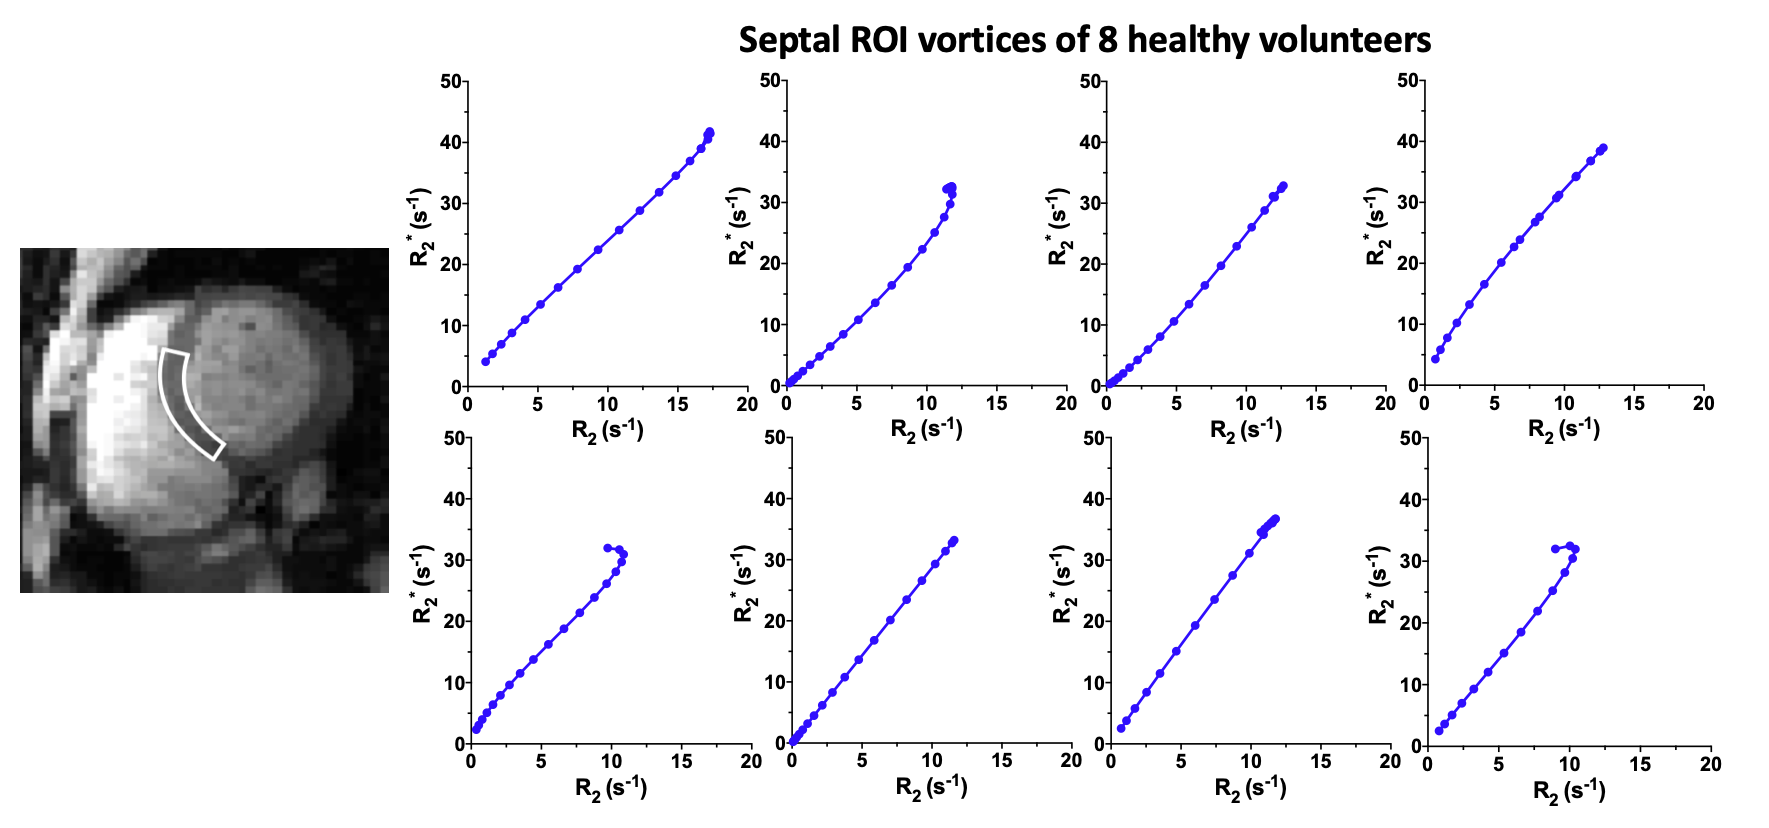
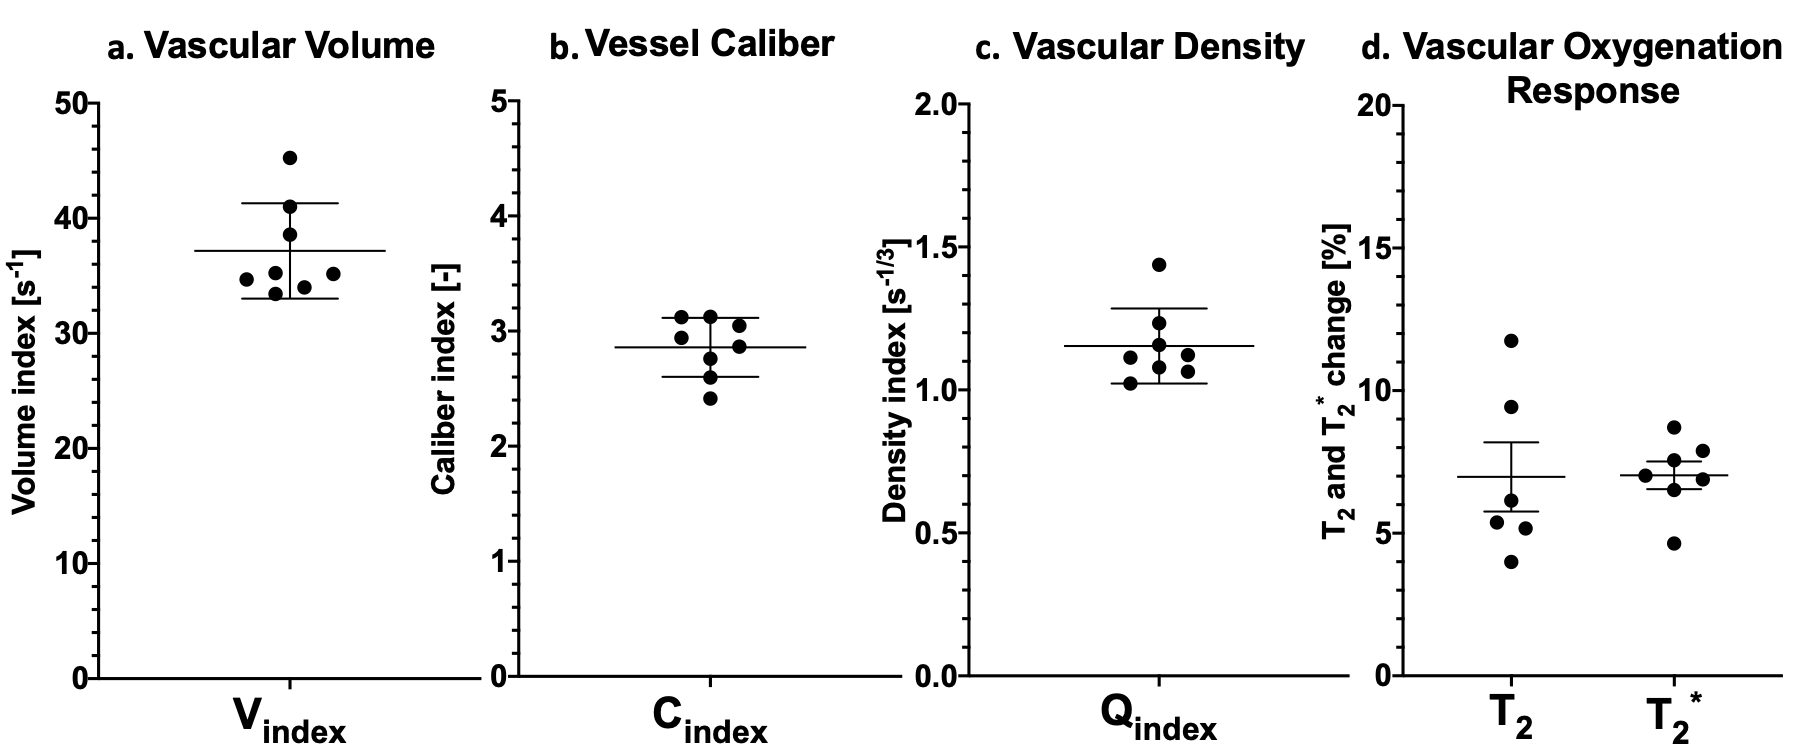
The T2- and T2*-change due to the Gd-DTPA was seen over the time of the breath-hold(Fig1) and the voxel-by-voxel maximum $$$\triangle$$$R2- and $$$\triangle$$$R2*-maps are shown in Fig2a-b. These dynamic $$$\triangle$$$R2- and $$$\triangle$$$R2*-changes in an arterial(Fig2c) and a venule(Fig2d) ROI are shown to result in a clockwise and counter-clockwise vessel vortex, respectively. This vortex directional sensitivity results from the fact that temporal T2- and T2*-changes from Gd-DTPA are slightly shifted in time3,6(Fig3). Furthermore, all septal vortices from the 8 healthy participants that held their breath longer than the Gd-DTPA transit time, showed a predominant capillary architecture3(Fig4). In addition, the septal mean Vindex of 37.2±4.1s-1, mean Cindex of 2.9±0.3 and mean Qindex of 1.2±0.1s-1/3 were extracted(Fig5a-c). The oxygenation responses was determined as a T2- and T2*-change of 7.0±2.0% and 7.0±1.3%, respectively(Fig5d).Discussion
The first results of cardiac VAI with GESE-EPI show a relative minor decrease in $$$\triangle$$$R2 and $$$\triangle$$$R2* after the peak, resulting in incomplete vortex-loops compared to brain3,6,14. Nevertheless, the Vindex, Cindex, Qindex and vortex direction could still be determined(Fig2cd). These cardiac indices need further dedicated validation with histology in the heart, but as an initial step we compared them with histological validated brain-based VAI parameters. Firstly, in rat brain a Cindex of 4.8±0.38 and a Qindex of 0.72±0.21s-1/3 17 have been reported, compared to a 9.2±1.0 and 0.36±0.1521s-1/3 in tumorous tissue, which are in the same range as our cardiac indices. However, from these histology validation studies it has been recommend to use the ratio between indices of healthy and diseased tissue8,15. This emphasizes the need of clinical comparison of cardiac VAI in a cardiovascular disease model. Secondly, absolute values for the slope length in the brain were not reported previously, but it has been shown that these slopes correlate with fBV as $$$V_{index}=10s^{-1}\sim{fBV=3}$$$%3,13. This correlation would result in a mean fBV of 11.2±1.2% in our septal ROIs, which could be expected18. Thirdly, a complete curved vortex cannot be achieved due to leakage of the Gd-DTPA in cardiac tissue, which makes extraction of the oxygen saturation (area of the vortex)3 difficult. Usage of a contrast-agent that remains intravascular19 might solve this leakage problem, but as shown the oxygenation response can also be determined from a non-contrast-enhanced breath-hold acquisition9,10. Lastly, these first cardiac VAI results correspond with the expected high cardiac microvascular density and fBV and showed vortex shapes that are expected in healthy tissue3,13. We hypothesize that these cardiac VAI results using a GESE-EPI sequence, despite the ultimate need for histological validation, can be further evaluated in healthy and myocardial-infracted tissue, which would provide insights in the clinical relevance of cardiac VAI.Conclusion
We successfully performed VAI in the heart for the first time using a GESE-EPI sequence providing dynamic contrast-enhanced myocardial T2*- and T2-maps per heartbeat over the time of a single breath-hold. Obtained values for the dominant vascular type, Vindex, Cindex and Qindex were proportional to previous results in the brain, but still need further histological and clinical validation in cardiac diseases.Acknowledgements
This work was supported in part by the Dutch Heart Association (2016T042) and by NIH research grants (R01EB019437, R01EB020613, R01MH116173, and U01EB025162)References
1. Petersen JW, Pepine CJ. Microvascular Coronary Dysfunction and Ischemic Heart Disease – Where Are We in 2014? Trends Cardiovasc Med 2016;25:98–103. doi:10.1016/j.tcm.2014.09.013.
2. Nagel E, Greenwood JP, McCann GP, Bettencourt N, Shah AM, Hussain ST, et al. Magnetic resonance perfusion or fractional flow reserve in coronary disease. N Engl J Med 2019;380:2418–28. doi:10.1056/NEJMoa1716734.
3. Emblem KE, Mouridsen K, Bjornerud A, Farrar CT, Borra RJH, Wen PY, et al. Vessel Architectural Imaging Identifies Cancer Patient Responders to Anti-angiogenic Therapy. Nat Med 2013;19:1178–83. doi:10.1038/nm.3289.
4. Emblem KE, Farrar CT, Gerstner ER, Batchelor TT, Borra RJH, Rosen BR, et al. Vessel calibre—a potential MRI biomarker of tumour response in clinical trials. Nat Rev Clin Oncol 2014;11:566–84. doi:10.1038/nrclinonc.2014.126.
5. Troprès I, Grimault S, Vaeth A, Grillon E, Julien C, Payen JF, et al. Vessel size imaging. Magn Reson Med 2001;45:397–408. doi:10.1002/1522-2594(200103)45:3<397::AID-MRM1052>3.0.CO;2-3.
6. Kiselev VG, Strecker R, Ziyeh S, Speck O, Hennig J. Vessel size imaging in humans. Magn Reson Med 2005;53:553–63. doi:10.1002/mrm.20383.
7. Prinster A, Pierpaoli C, Turner R, Jezzard P. Simultaneous Measurement of ΔR2 and ΔR2* in Cat Brain during Hypoxia and Hypercapnia. Neuroimage 1997;6:191–200. doi:10.1006/nimg.1997.0288.
8. Dennie J, Mandeville JB, Boxerman JL, Packard SD, Rosen BR, Weisskoff RM. NMR imaging of changes in vascular morphology due to tumor angiogenesis. Magn Reson Med 1998;40:793–9. doi:10.1002/mrm.1910400602.
9. van den Boomen M, Manhard MK, Nguyen C, Emblem K, Slart R, Sosnovik D, et al. Heartbeat-to-Heartbeat Quantitative Cardiac BOLD Imaging during a Single Breath-Hold using a combined Gradient Echo-Spin Echo EPI sequence. SCMR 22nd Annu Sci Sess Focus Sess 6; Seatlle, USA 2019:2.
10. van den Boomen M, Snel GJH, Nguyen C, Manhard MK, Sosnovik D, Rudi AJO, et al. Heartbeat-to-Heartbeat Quantitative Myocardial Oxygenation Imaging within a Single Breath- Hold using a Combined Gradient Echo-Spin Echo EPI ( GESE-EPI ) Sequence in Patients with Hypertension. ISMRM 27th Annu Meet Exhib 2019:585.
11. Schmiedeskamp H, Straka M, Newbould RD, Zaharchuk G, Andre JB, Olivot JM, et al. Combined spin- and gradient-echo perfusion-weighted imaging. Magn Reson Med n.d.;68:30–40. doi:10.1002/mrm.23195.
12. Heiberg E, Sjögren J, Ugander M, Carlsson M, Engblom H, Arheden H. Design and validation of Segment - freely available software for cardiovascular image analysis. BMC Med Imaging 2010;10. doi:10.1186/1471-2342-10-1.
13. Zhang K, Yun SD, Triphan SMF, Sturm VJ, Buschle LR, Hahn A, et al. Vessel architecture imaging using multiband gradient-echo/spin-echo EPI. PLoS One 2019;14:e0220939. doi:10.1371/journal.pone.0220939.
14. Xu C, Kiselev VG, Möller HE, Fiebach JB. Dynamic hysteresis between gradient echo and spin echo attenuations in dynamic susceptibility contrast imaging. Magn Reson Med 2013;69:981–91. doi:10.1002/mrm.24326.
15. Farrar CT, Kamoun WS, Ley CD, Kim YR, Kwon SJ, Dai G, et al. In vivo validation of MRI vessel caliber index measurement methods with intravital optical microscopy in a U87 mouse brain tumor model. Neuro Oncol 2010;12:341–50. doi:10.1093/neuonc/nop032.
16. Wu EX, Tang H, Jensen JH. High-resolution MR imaging of mouse brain microvasculature using the relaxation rate shift index Q. NMR Biomed 2004;17:507–12. doi:10.1002/nbm.921.
17. Jensen JH, Chandra R. MR imaging of microvasculature. Magn Reson Med 2000;44:224–30. doi:10.1002/1522-2594(200008)44:2<224::AID-MRM9>3.0.CO;2-M.
18. McCommis KS, Goldstein TA, Zhang H, Misselwitz B, Gropler RJ, Zheng J. Quantification of myocardial blood volume during dipyridamole and doubtamine stress: A perfusion CMR study. J Cardiovasc Magn Reson 2007;9:785–92. doi:10.1080/10976640701545206.
19. Gale EM, Wey HY, Ramsay I, Yen YF, Sosnovik DE, Caravan P. A manganese-based alternative to gadolinium: Contrast-enhanced MR angiography, excretion, pharmacokinetics, and metabolism. Radiology 2018;286:865–72. doi:10.1148/radiol.2017170977.
Figures