1094
3D Whole-heart High-resolution Motion Compensated Joint T1/T2 Mapping1Biomedical Engineering Department, School of Biomedical Engineering and Imaging Sciences, King's College London, London, United Kingdom
Synopsis
Tissue characterization including identification and quantification of fibrosis and oedema plays an important role in many myocardial diseases. Conventionally 2D T1 and T2 maps are acquired sequentially under several breath-holds. However these approaches achieve limited spatial resolution and coverage. Furthermore, partial volume effects at water-fat interfaces may affect T1 and T2 quantification. In this work, we propose a free-breathing high-resolution whole-heart joint T1 and T2 mapping sequence with Dixon encoding which provides co-registered 3D T1 and T2 maps and complementary 3D anatomical water coronary magnetic resonance angiography (CMRA) and fat images in a single scan of ~9min.
Introduction
Tissue characterization including identification and quantification of fibrosis and oedema plays an important role in many myocardial diseases. Conventionally, 2D T1 and T2 maps are acquired sequentially under several breath-holds1,2. However these approaches achieve limited spatial resolution and coverage of the heart. In this work, we sought to develop a free-breathing motion compensated 3D whole-heart sequence for joint T1/T2 mapping with isotropic resolution and co-registered anatomical water and fat imaging for visualisation of cardiac and coronary anatomy and epicardial and pericardial fat.Methods
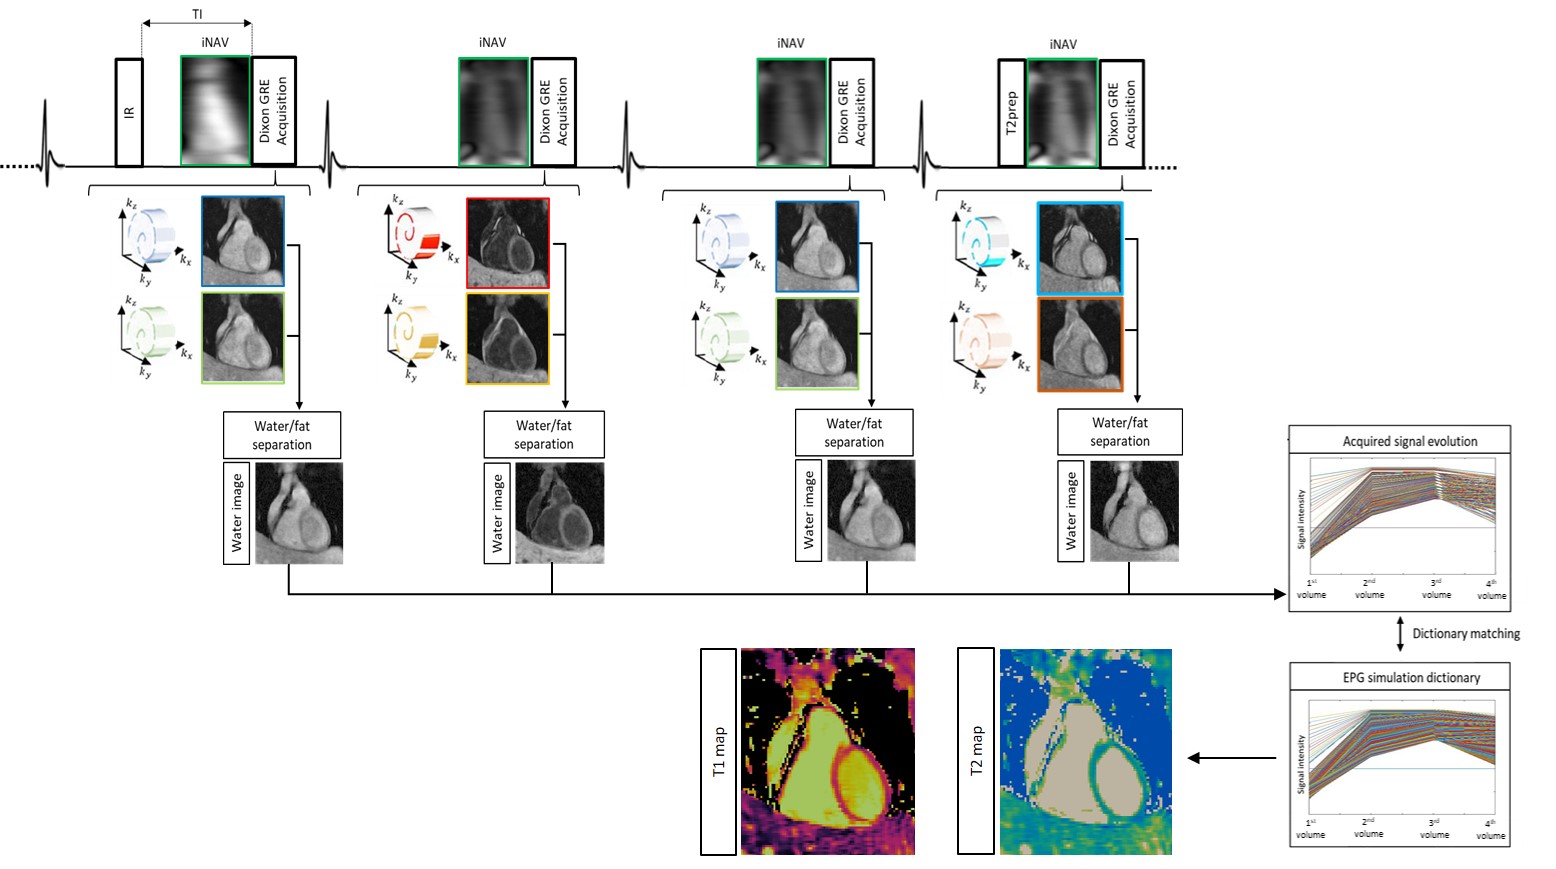
The proposed framework is shown in Fig.1. Four interleaved 3D volumes are acquired with ECG-triggered two-point bipolar Dixon, spoiled gradient echo (GRE) readout and variable-density Cartesian trajectory with spiral profile order and an undersampling factor of 4x3,4. The four datasets are acquired respectively with 1) Inversion Recovery (IR) preparation, 2 and 3) no preparation and 4) T2 preparation pulse (T2prep). Low resolution 2D image navigators (iNAVs)5 are acquired prior to imaging to estimate and correct for translational respiratory motion, enabling 100% scan efficiency and predictable scan time. Translational motion correction at end-expiration is performed for each echo of each dataset separately. The motion compensated undersampled in- and out-of-phase volumes are jointly reconstructed with a 3D multi-contrast patch-based low-rank reconstruction (HD-PROST)6. A water-fat separation algorithm7 is used to generate fat and water images for each dataset, and the four water images are normalized on a voxel-by-voxel basis in time to obtain the signal evolution across the four acquired volumes. Extended phase graph (EPG) simulations8, matching the acquisition parameters, are carried out to generate a subject-specific dictionary. Quantitative water T1 and T2 maps are generated by matching each voxel measured signal evolution to the closest dictionary entry, corresponding to a T1/T2 pair, whereas the T2-prepared dataset (4th dataset) is used for water/fat anatomical and coronary visualization.Acquisition: A standardized T1/T2 phantom and six healthy subjects were scanned on a 1.5T scanner (Siemens Magnetom Aera) to validate the proposed free-breathing sequence. Acquisition parameters included FA=8deg, isotropic resolution of 2mm3, FOV=320x320x88-124mm3, coronal orientation, 14 echoes for iNAV acquisition, subject specific mid-diastolic trigger-delay and acquisition window of 96-118ms, TR/TE1/TE2=6.71/2.38/4.76ms, bandwidth=485Hz/pixel, T2prep=50ms, TI=120ms and total scan time=9±1min48sec. Accuracy and precision of T1 and T2 quantification was investigated in phantom scans with respect to phantom reference values9, and in-vivo with respect to 2D MOLLI and T2prep-based 2D bSSFP T2 mapping. Additionally, a standard T2-prepared CMRA with Dixon encoding, was acquired to qualitatively asses the fat/water separation for each acquired dataset and anatomical visualization of cardiac structures and coronary anatomy. 2D clinical T1 and T2 maps were acquired in 3 short axis views with a spatial resolution of 1.8x1.8x8mm3 in a ~10sec breath-hold for each slice, whereas the acquisition parameters of the conventional 3D T2-prepared (T2prep=40ms) CMRA matched the proposed sequence.
Results
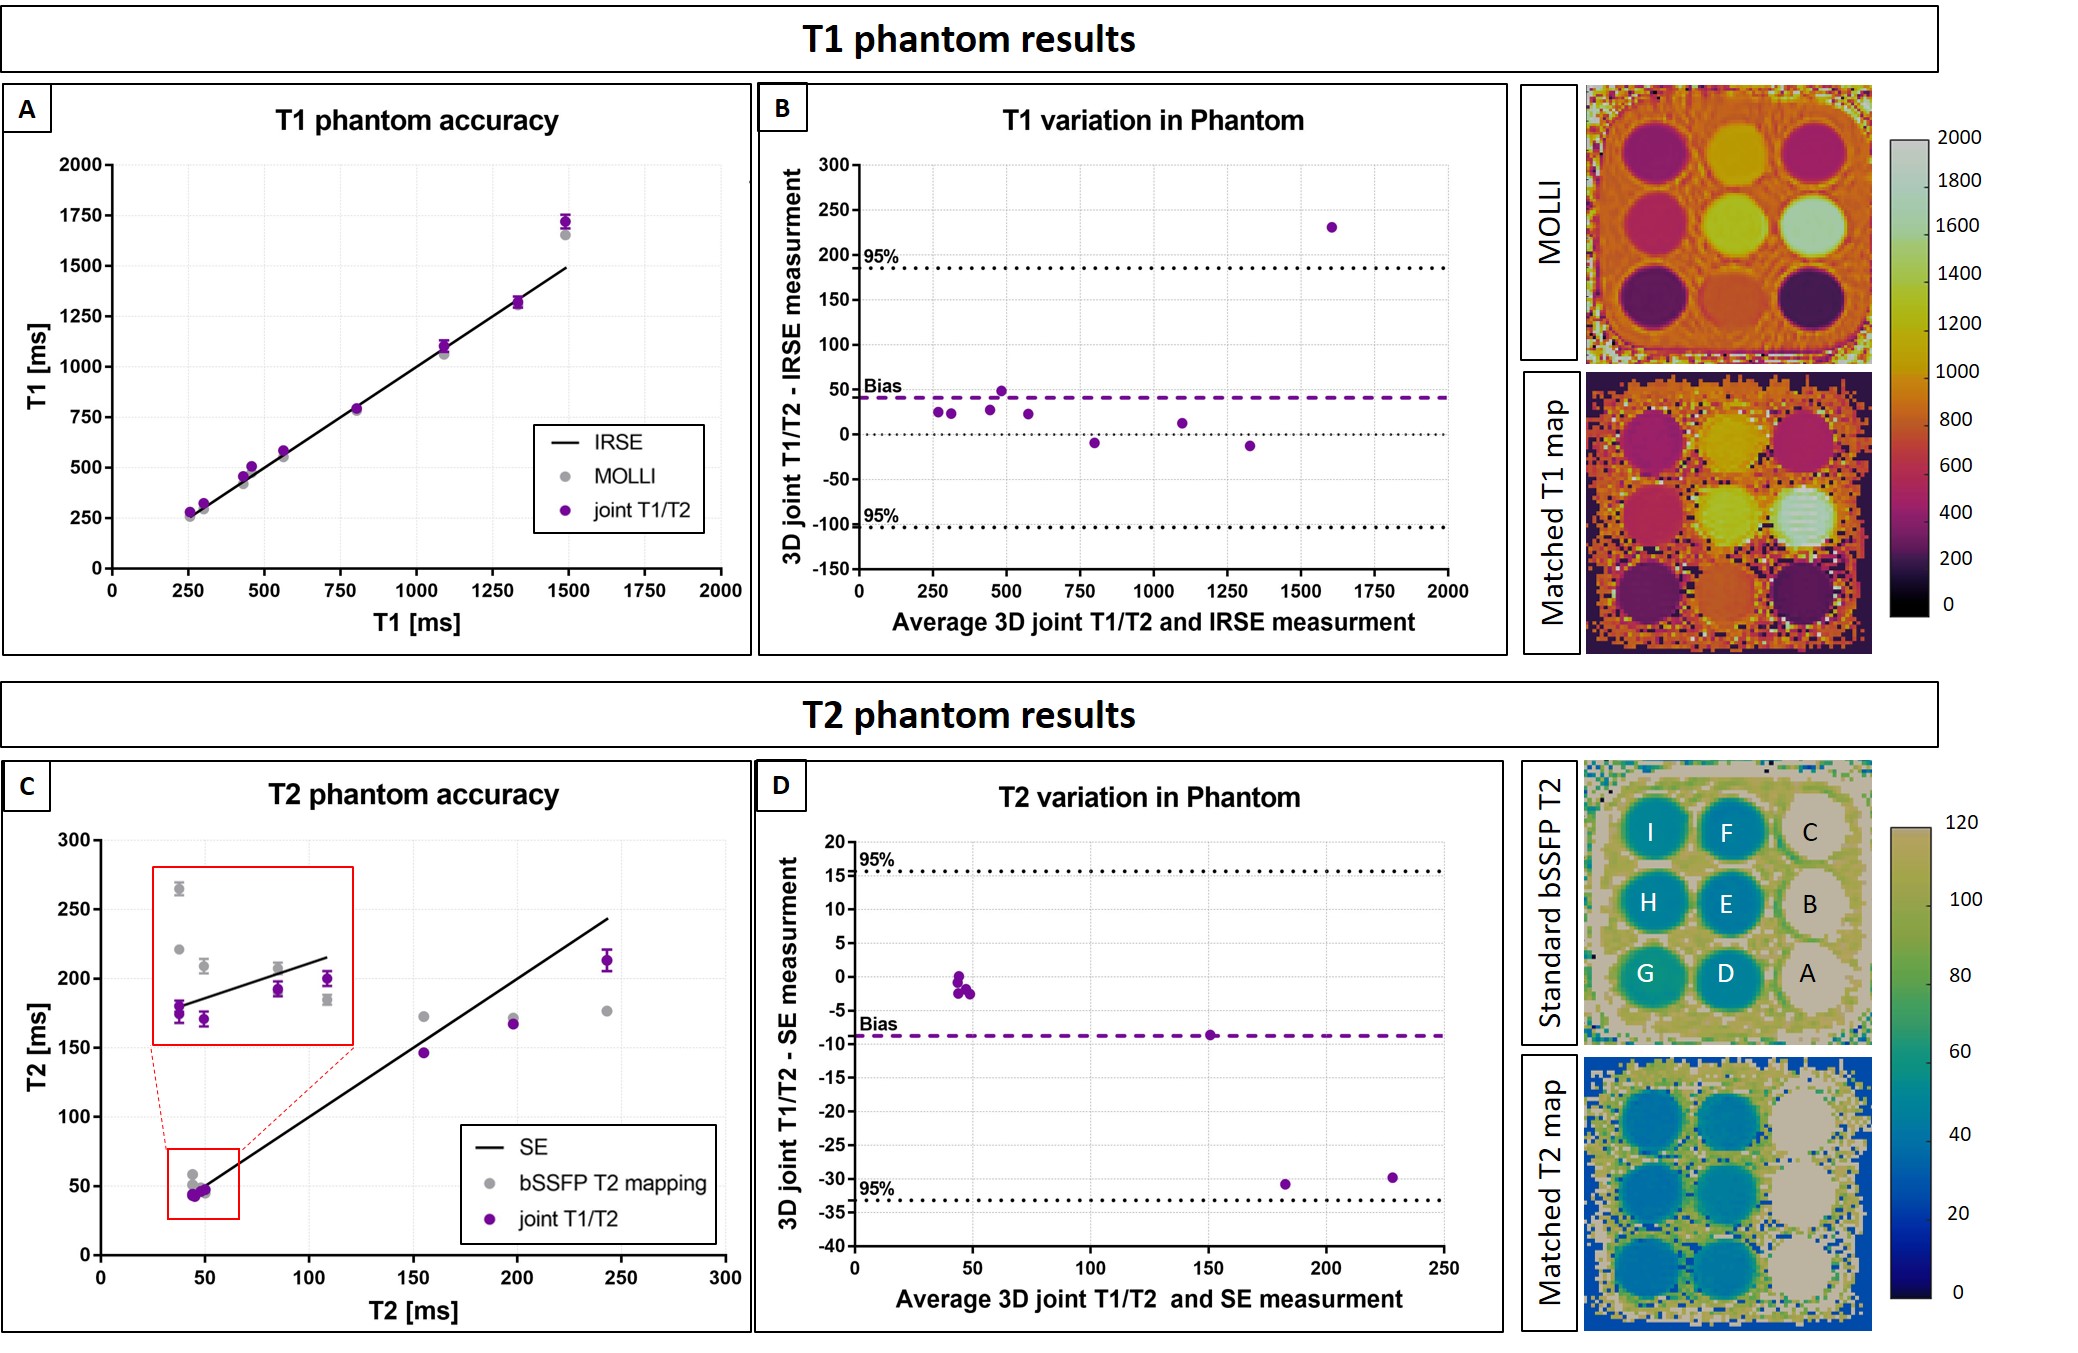
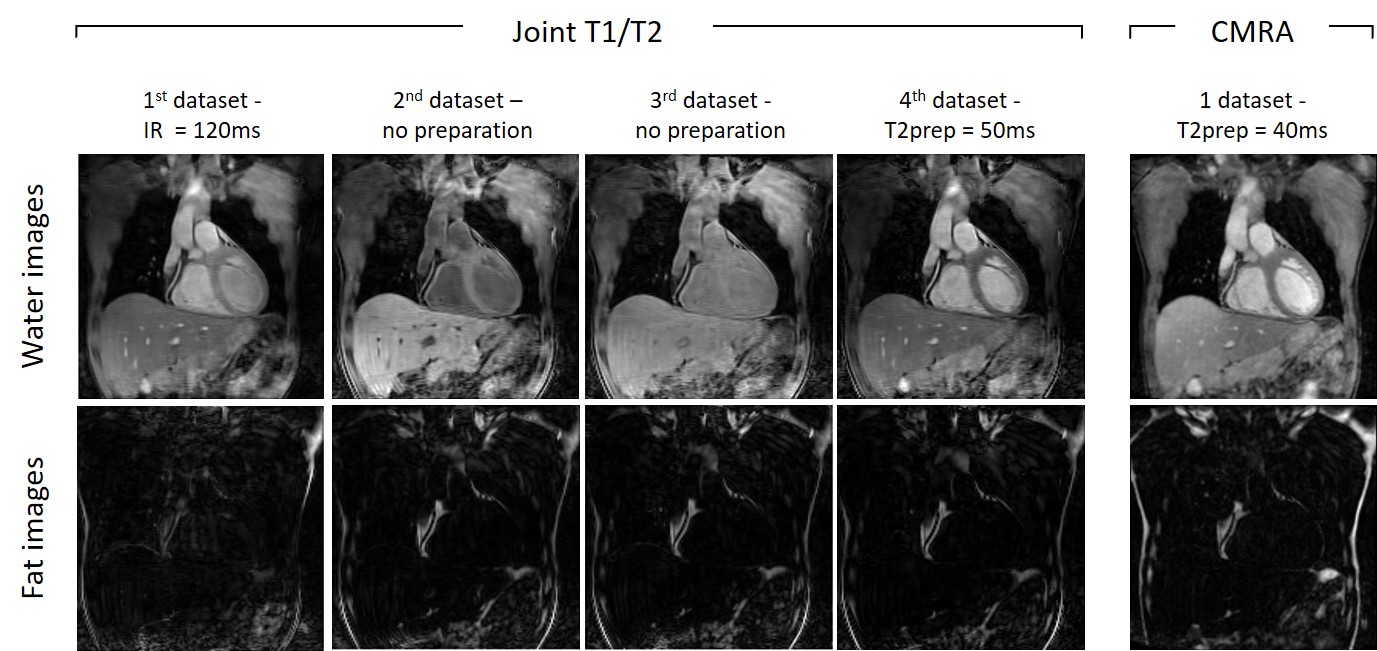
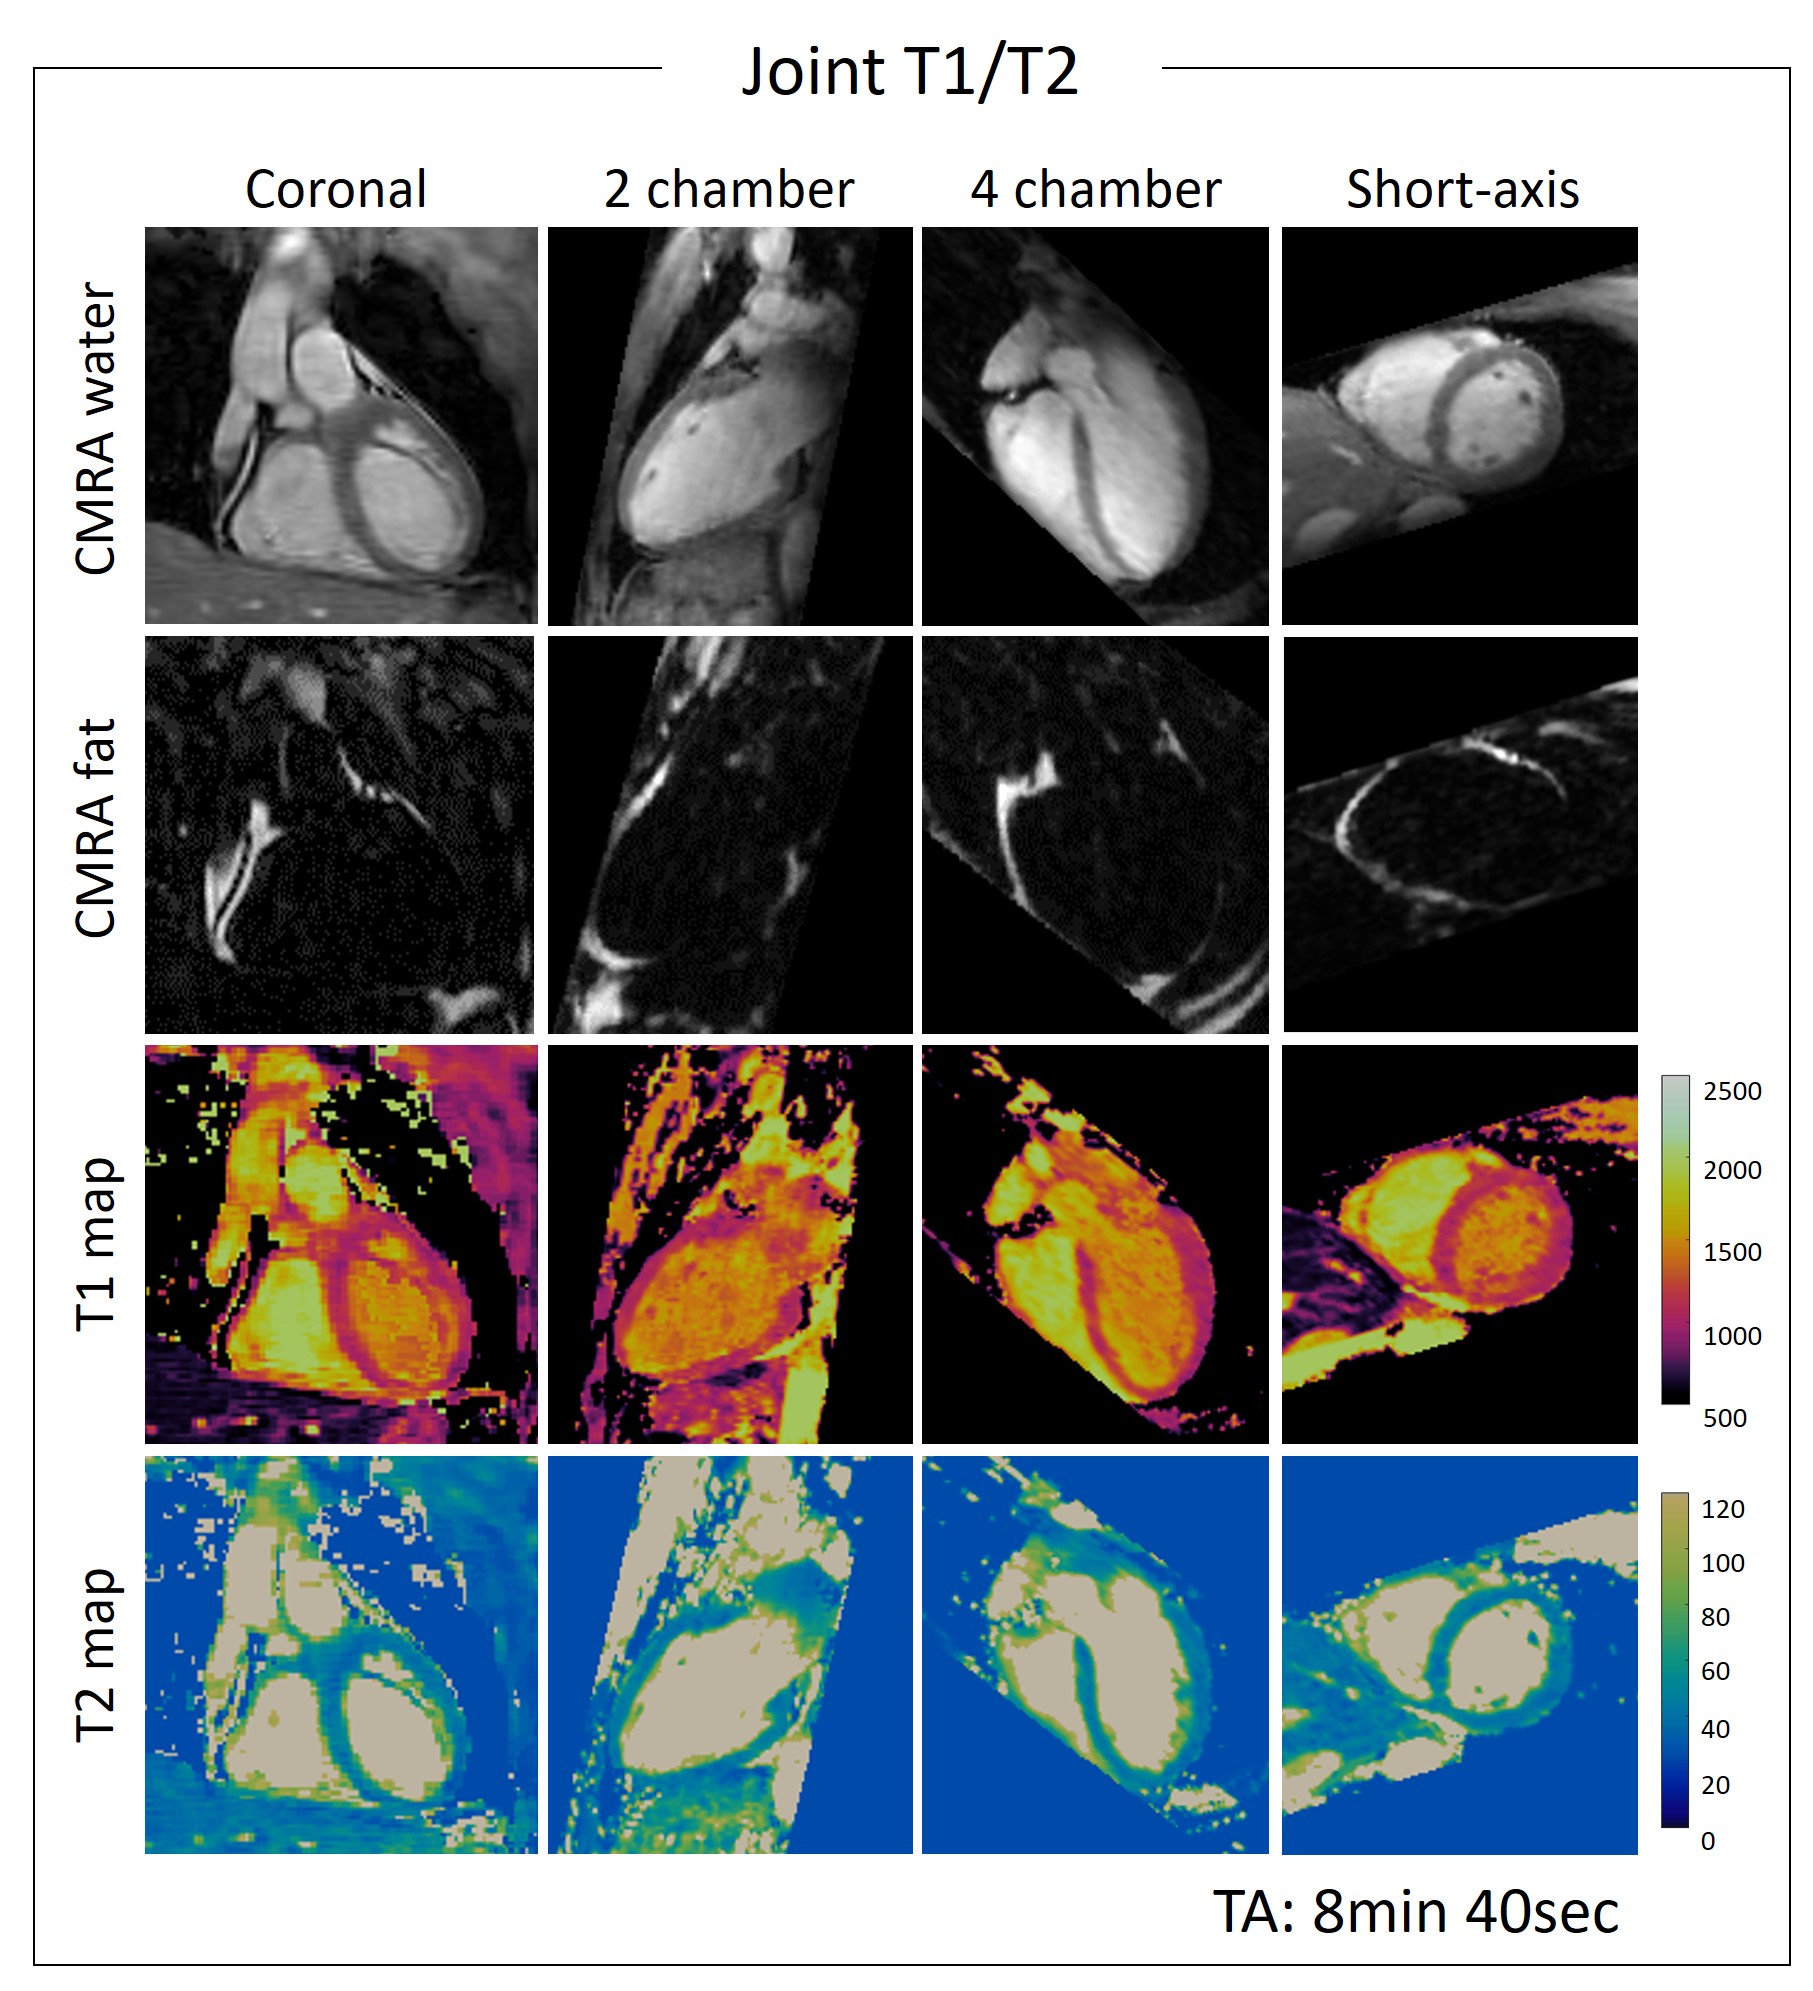
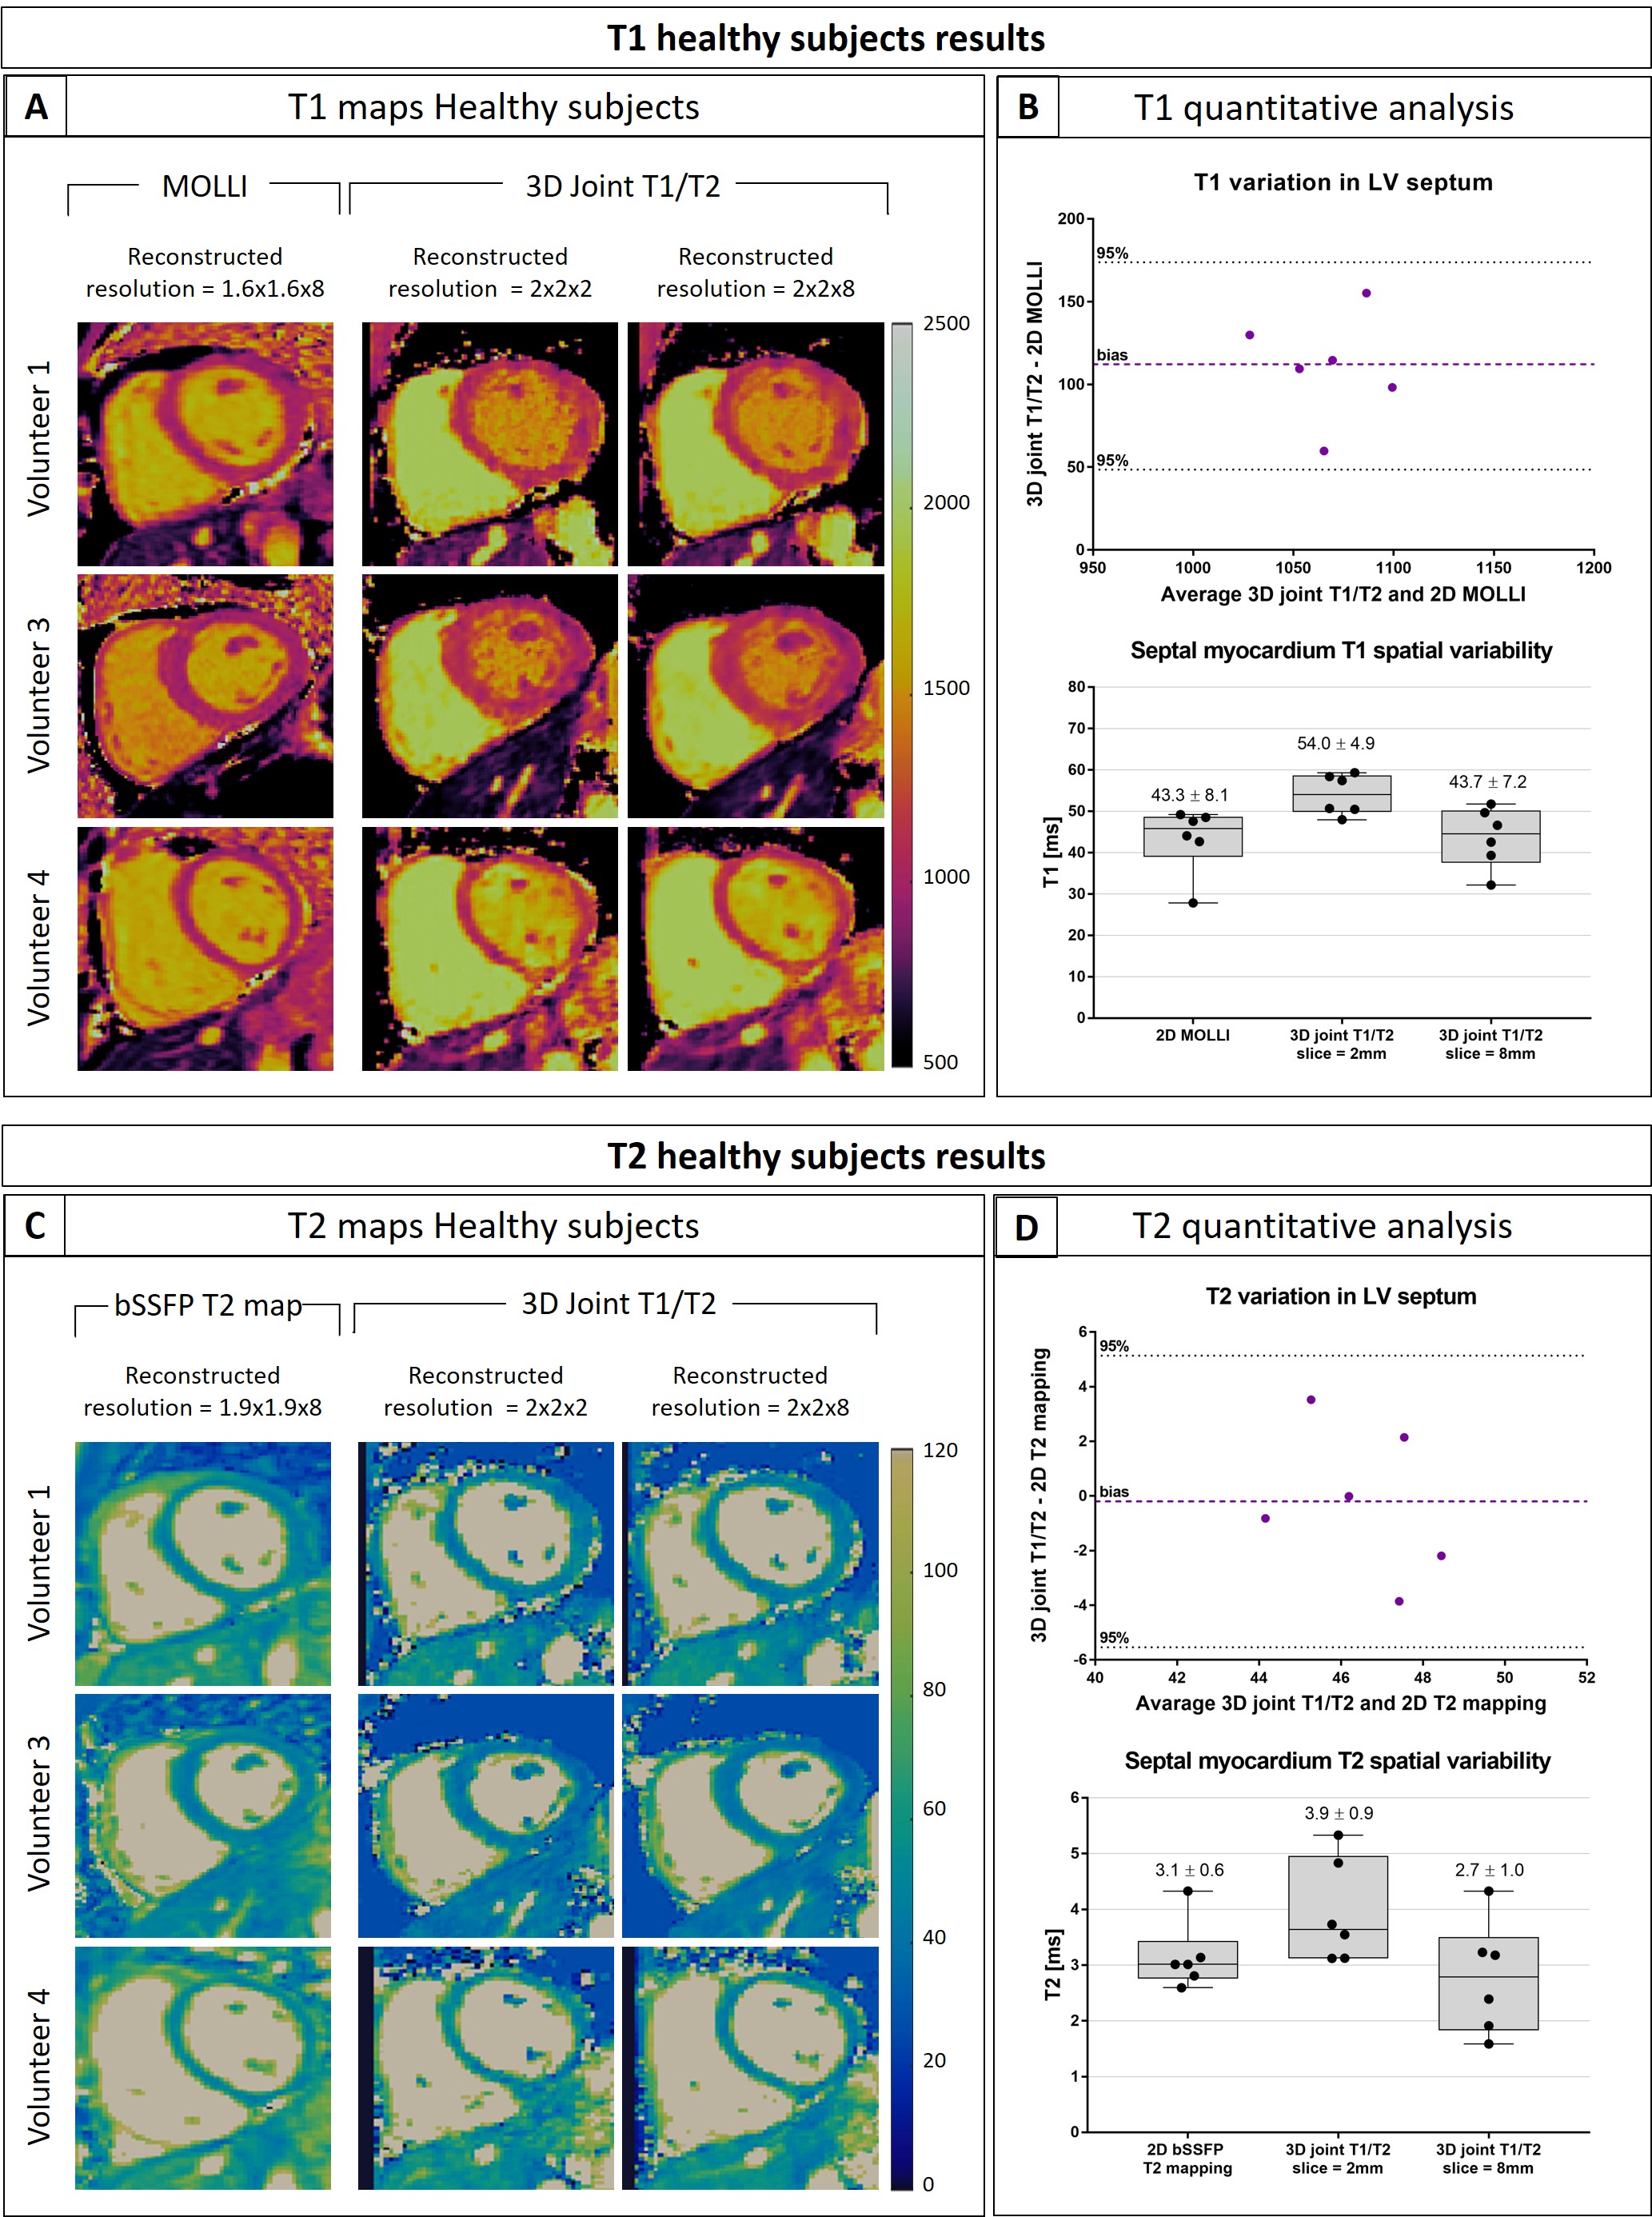
T1/T2 phantom: Phantom results are shown in Fig.2. Excellent linear correlations of y = 1.07x-11.7 (R2=0.98) and y = 0.85x + 5.7 (R2=0.99) were found between the proposed sequence and spin echo phantom values for both T1 and T2 quantification respectively. An overestimation of long T1 (T1=1489ms corresponding to blood) and an underestimation of long T2s (vials corresponding to blood) were observed with the proposed sequence. The resulting biases were T1 = 40.93ms and T2 = -8.75ms respectively. However such over and underestimations were observed also with the 2D MOLLI and 2D T2-prepared bSSFP sequences.Healthy subjects: The translational motion corrected water and fat images for each acquired volume are shown in Fig.3 and compared with conventional T2-prepared CMRA with Dixon encoding. Good fat/water separation is achieved with no observable water/fat swaps in the cardiac region for each reconstructed dataset. The T2-prepared water volume (4th dataset of the proposed approach) showed good myocardium-blood contrast for visualization of anatomical structures. The 3D isotropic nature of the acquisition allowed to reformat the acquired anatomical water and fat images and T1 and T2 maps in different orientations. Good depiction of anatomical structures and homogeneous T1 and T2 quantification can be observed for one representative healthy subject in Fig.4. T1 and T2 maps obtained with the proposed approach show comparable image quality to standard 2D techniques (Fig.5). A T1 overestimation leading to a bias of T1 = 111.2ms was observed in the septum compared to standard 2D MOLLI. In contrast a small bias of only -0.2ms was observed for T2 quantification compared to 2D bSSFP T2 mapping. A lower precision, quantified by the spatial variability in the septal region, was observed with the proposed approach (joint T1/T2 spatial variability: T1 = 54.0±4.9, T2 = 3.9±0.9) compared to 2D acquisitions (2D MOLLI spatial variability: T1= 43.3±8.1 and bSSFP T2 map spatial variability: T2 = 3.1±0.6). However, a comparable precision of T1 = 43.7±7.2ms and T2 = 2.7±1.0ms were observed by reconstructing the images matching the resolution of the 2D acquisitions (slice thickness = 8mm).
Conclusion
The proposed motion compensated joint T1/T2 sequence showed good agreement with reference T1 and T2 values in the T1/T2 phantom and good agreement with 2D MOLLI T1 mapping and 2D bSSFP T2 mapping in healthy subjects. Additionally, a 3D CMRA water/fat volume for anatomical and coronary visualization is obtained. Future work will include validation in patients.Acknowledgements
This work was supported by EPSRC (EP/L015226/1, EP/P001009/1, EP/P007619 and EP/P032311/1) and the Wellcome EPSRC Centre for Medical Engineering (NS/A000049/1).References
1. Messroghli, D. R. et al. Modified Look-Locker inversion recovery (MOLLI) for high-resolutionT1 mapping of the heart. Magn. Reson. Med. 52, 141–146 (2004).
2. Montant, P., Sigovan, M., Revel, D. & Douek, P. MR imaging assessment of myocardial edema with T2 mapping. Diagn. Interv. Imaging 96, (2015).
3. Prieto, C. et al. Highly efficient respiratory motion compensated free-breathing coronary MRA using golden-step Cartesian acquisition. J. Magn. Reson. Imaging 41, (2015).
4. Bustin, A. et al. Five-minute whole-heart coronary MRA with sub-millimeter isotropic resolution, 100% respiratory scan efficiency, and 3D-PROST reconstruction. Magn. Reson. Med. vol. 810, pp. 102-115no. 0, Jul. 2018, 2019.
5. Henningsson, M. et al. Whole-heart coronary MR angiography with 2D self-navigated image reconstruction. Magn. Reson. Med. 67, (2012).
6. Bustin, A. et al. High-dimensionality undersampled patch-based reconstruction (HD-PROST) for accelerated multi-contrast MRI. Magn. Reson. Med. 81, 3705–3719 (2019).
7. Liu, J., Peters, D. C. & Drangova, M. Method of B0 mapping with magnitude-based correction for bipolar two-point Dixon cardiac MRI. Magn. Reson. Med. 78, 1862–1869 (2016).
8. Weigel, M. Extended phase graphs: Dephasing, RF pulses, and echoes - pure and simple. J. Magn. Reson. Imaging 41, 266–295 (2015).
9. Captur, G. et al. A medical device-grade T1 and ECV phantom for global T1 mapping quality assurance---the T1 Mapping and ECV Standardization in cardiovascular magnetic resonance (T1MES) program. J. Cardiovasc. Magn. Reson. 18, 58 (2016).
Figures