1089
Accelerating Myocardial Arterial Spin Labeling in Small Animals by Exploiting Spatiotemporal Correlations1Institute for Biomedical Engineering, ETH Zurich, Zurich, Switzerland, 2Aix Marseille Univ, CNRS, CRMBM, Marseille, France
Synopsis
The feasibility of accelerating arterial spin labelling (ASL) by exploiting spatiotemporal correlations for assessing myocardial perfusion in small animals is demonstrated. Based on numerical simulations and retrospectively undersampled in-vivo data, three-fold acceleration yields errors below 16 ± 10 % in myocardial blood flow quantification and hence the method is considered promising to shorten the long scan times of myocardial ASL in small animals.
Introduction
Arterial spin labelling (ASL) cardiac magnetic resonance (CMR) is a method to quantitatively map myocardial blood flow in the heart muscle without the need for exogenous contrast agents1. Flow sensitive alternating inversion recovery (FAIR) pulsed ASL perfusion MR has become a method of choice for pre-clinical, small animal studies2–5. However, ASL suffers from long acquisition times on the order of 15 – 60 min6, which are challenging in animals with rapidly changing, unstable physiology, e.g. during stress protocols. To this date, undersampling in the k–t domain has been employed to accelerate various CMR protocols7–9. However, the concept of k–t sparsity in ASL has not been fully explored. Accordingly, the objective of the present work was to exploit spatiotemporal correlations for accelerating of myocardial ASL perfusion imaging.Methods
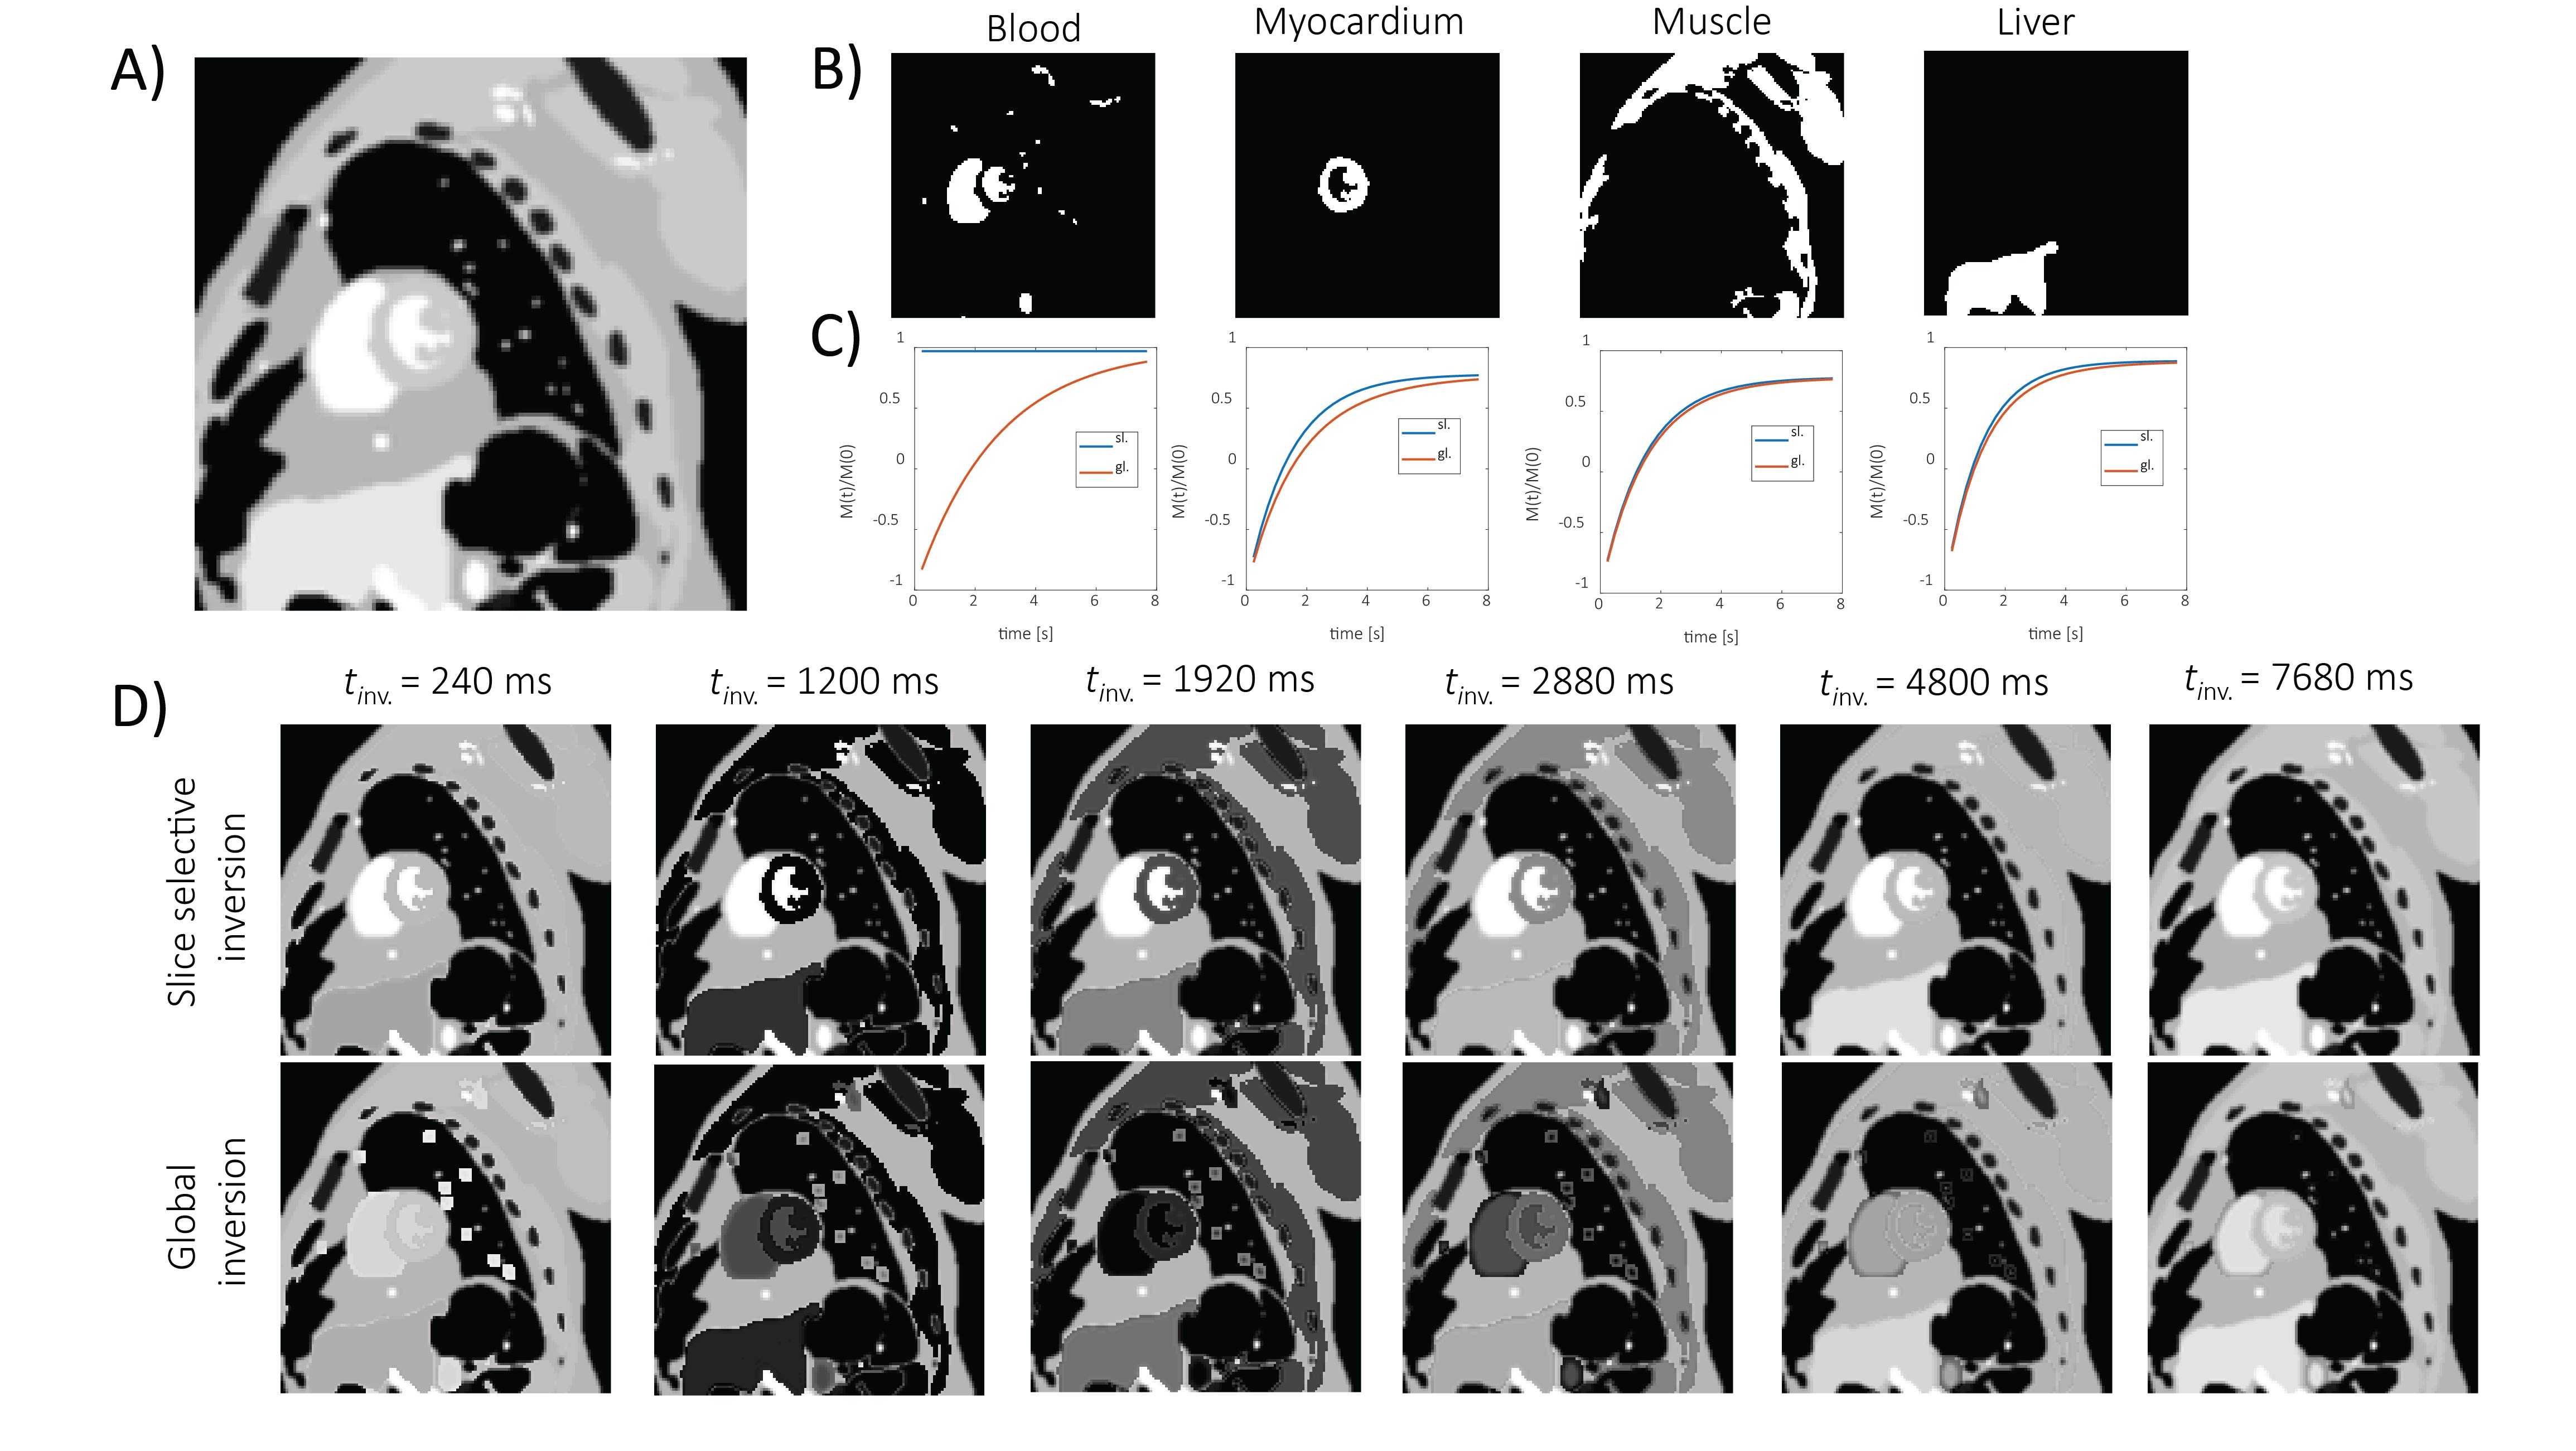
Numerical phantom: Simulations of magnetization recovery after slice-selective/global inversion were performed using the MXRCAT framework10,11 (Fig. 1). A midventricular short-axis slice was used. The longitudinal magnetization in the slice $$$M_{sl}(t)$$$ and in the entire sensitive volume $$$M_{gl}(t)$$$ was simulated according to12:$$\left\{ \begin{array}{ll}M_{sl}(t) \approx M_{\infty}\\M_{gl}(t) = M_{\infty} - (M_{\infty} - M_{0})\exp(-\frac{t}{T_{b}})\end{array} \right.$$
for blood and
$$\left\{ \begin{array}{ll}M_{sl}(t) = M_{\infty} - (M_{\infty} - M_{0})\exp(-\frac{t}{T^{\ast}_{t,sl}})\\M_{gl}(t) = M_{\infty} - (M_{\infty} - M_{0})\exp(-\frac{t}{T^{\ast}_{t,sl}}) + [M_{0,b}-M_{b}(0)]P\frac{\exp(-\frac{t}{T_{b}} - \exp(-\frac{t}{T^{\ast}_{t,gl}}))}{T^{-1}_{b}-T^{\ast, -1}_{t,gl}}\end{array} \right.$$
for tissue, where $$$M_{\infty/0}$$$ is the magnetization after inversion/at the steady-state, $$$T_{b/t}$$$ is the relaxation time of blood/tissue and $$$P$$$ is the perfusion factor.
Data acquisition: All MR data were recorded with a 9.4 T small animal MRI scanner (Bruker BioSpec, Ettlingen, Germany) equipped with a quadrature 80 mm T/R volume resonator and a 2x2 receive-only phased array. All animal experiments were performed with adherence to the Swiss Federal Act on Animal Protection and were approved by the Cantonal Veterinary Office Zurich. Female C57/BL6 mice were used, age 6–8 months. The FAIR ASL sequence was used as described previously2 with following acquisition parameters: TE/TR: 1.8/240 ms, field-of-view: 30 x 30 mm2, acquisition matrix: 128 x 64 (nfrequecny x nphase), NA = 3, number of inversion recovery points: 32, inversion applied ~ 10 s.
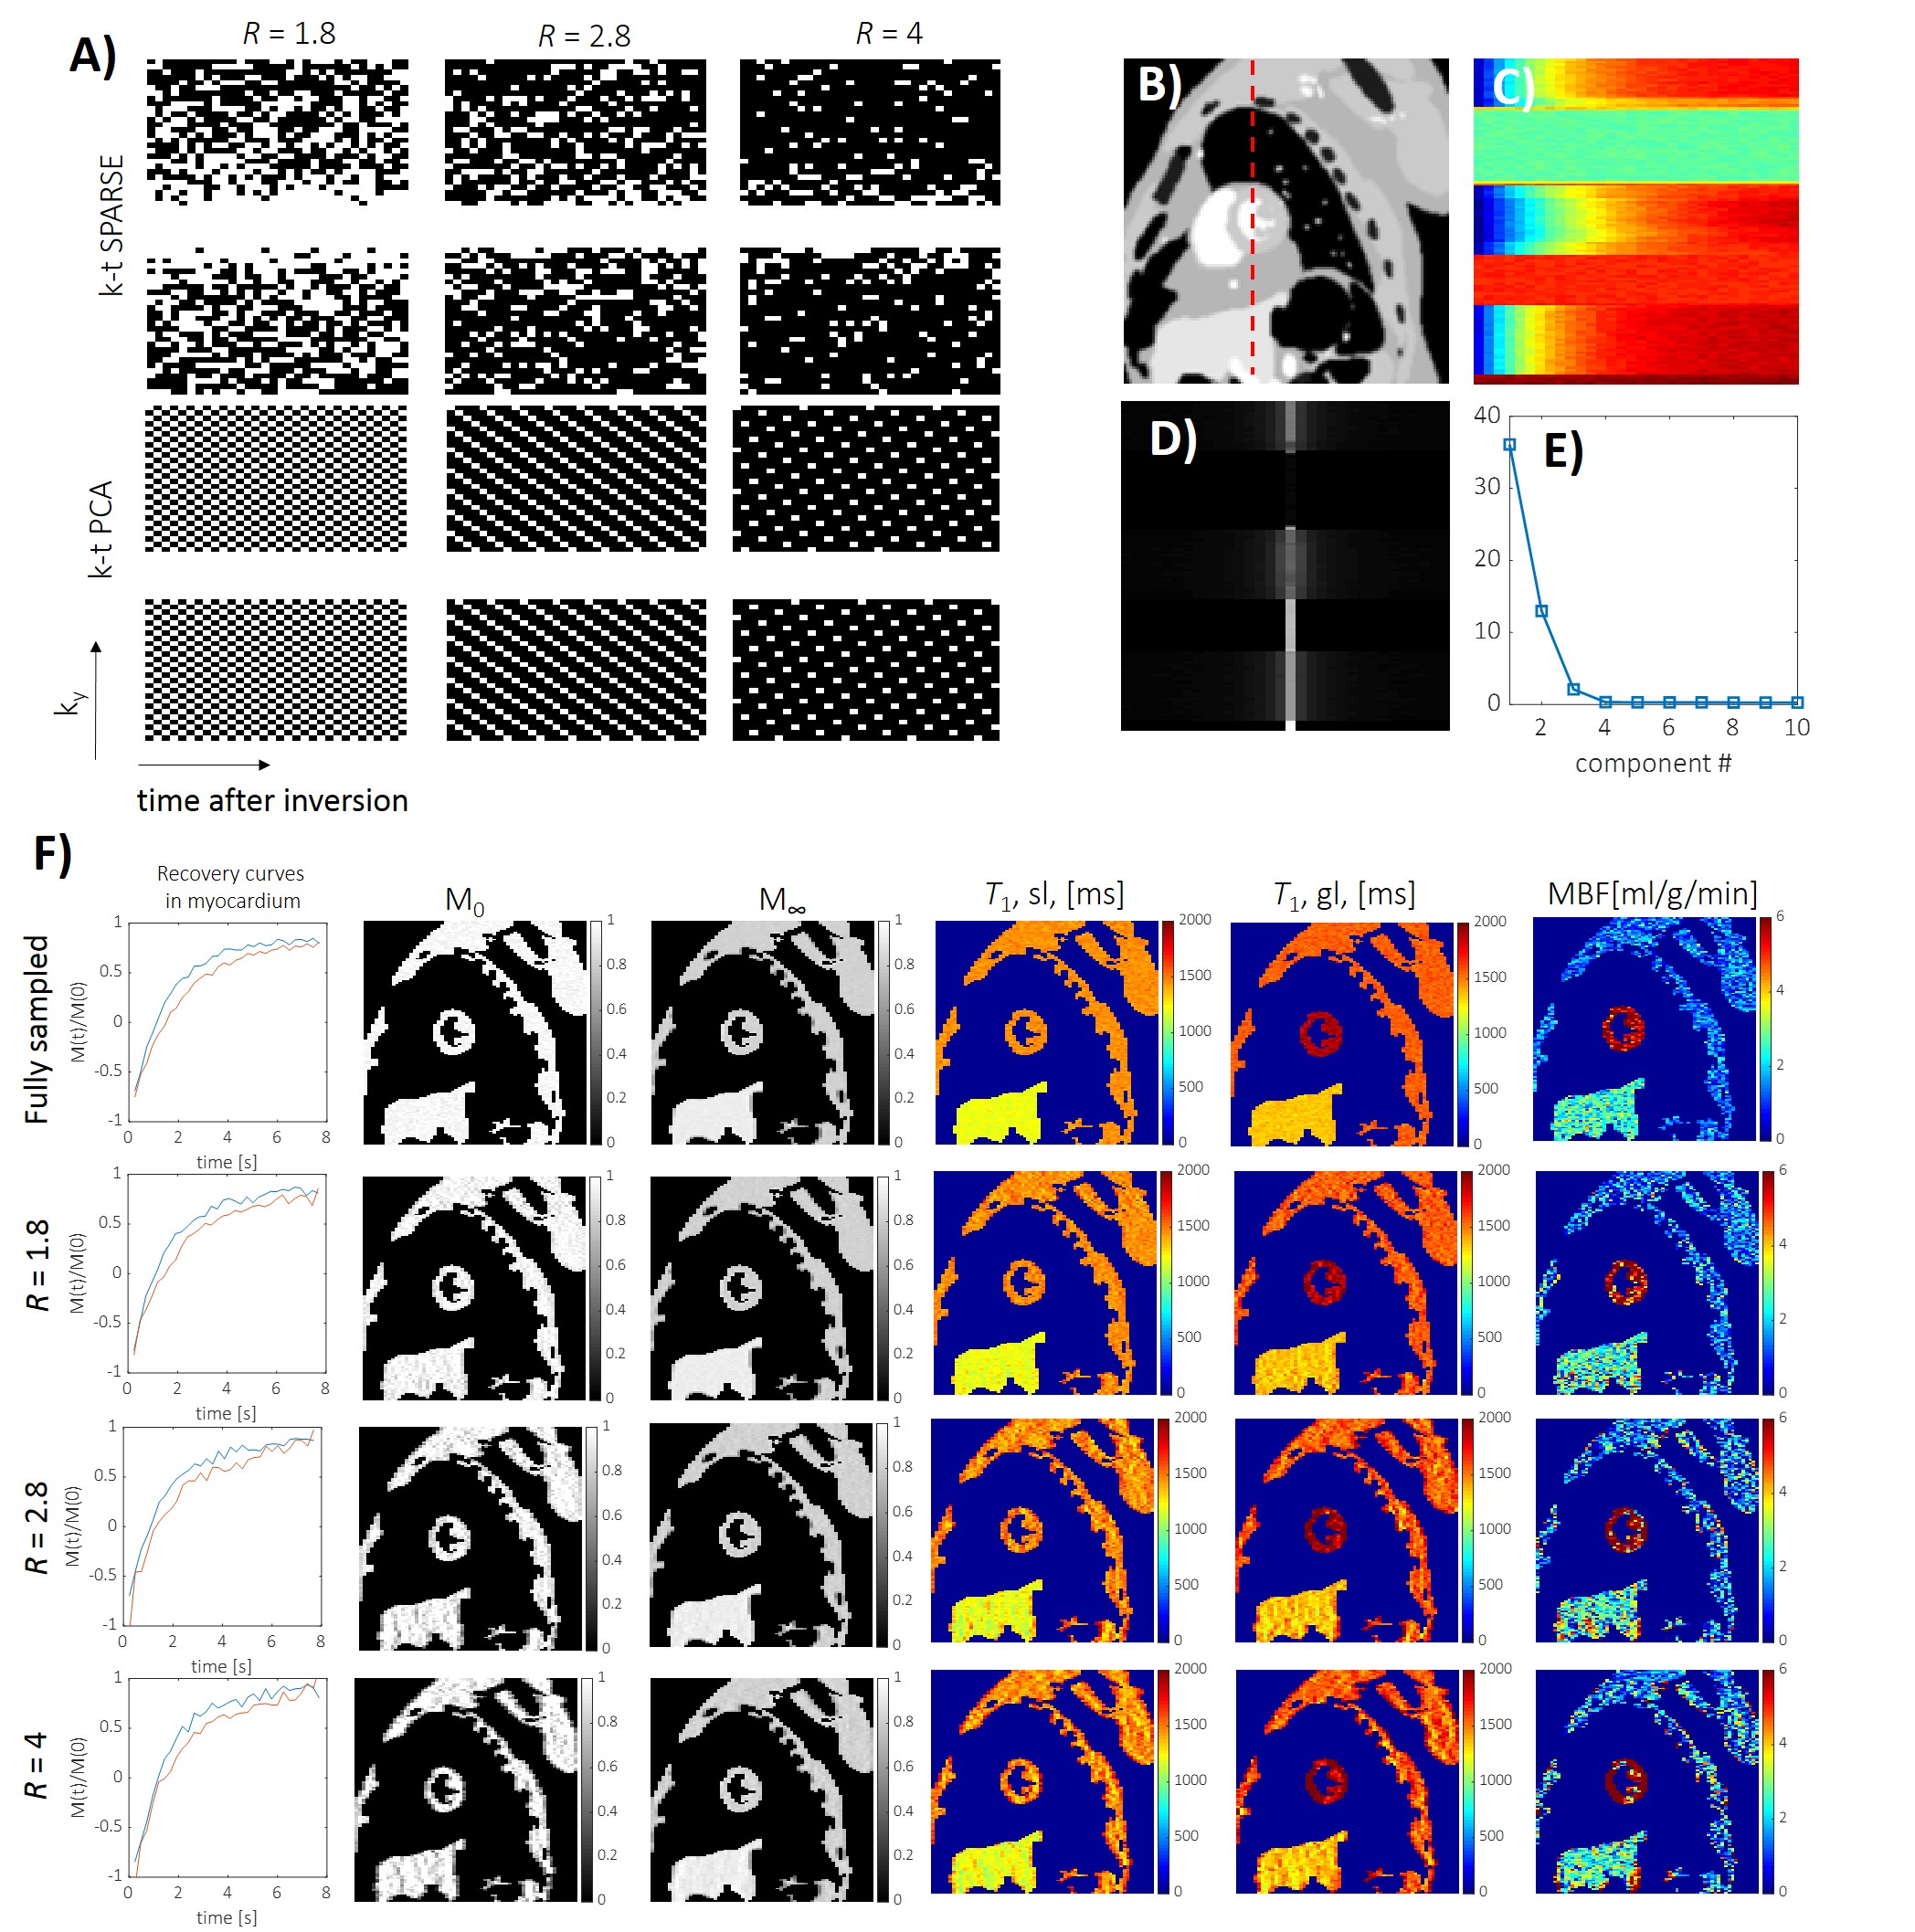
Image reconstruction: The fully sampled data were reconstructed in ParaVision 6.0.1 (Bruker). Retrospective undersampling (acceleration factors R=1.8, 2.8 and 4) was performed using either Poisson-like random undersampling (k–t SPARSE)13 with the Fourier transform along the time or using sheared-grid undersampling with subsequent principal component analysis along time (k–t PCA)14. Perfusion quantification: All data were quantified in MatLab 2018b (Mathworks, Natick, MA) using a home-built routine. The slice-selective/global inversion T1 maps were obtained using a three-parameter fit:
$$S(t) = A[1-B\exp(-\frac{t}{T_{1}})]$$
The mean blood flow (MBF) maps were calculated pixel-wise using12:
$$MBF = \frac{\lambda}{2T_{b}}(1+\frac{M_{\infty}}{M_{0}})(\frac{T^{\ast}_{t,gl}}{T^{\ast}_{t,sl}}-1)$$
assuming:
$$\left\{ \begin{array}{ll}M_{\infty} = A, \; \; \; \; \; \; \; \; \; \; \; T^{\ast}_{t,gl} = T_{1}\\M_{0} = A(B-1), \; T^{\ast}_{t,sl} = T_{1}\end{array} \right.$$.
Results
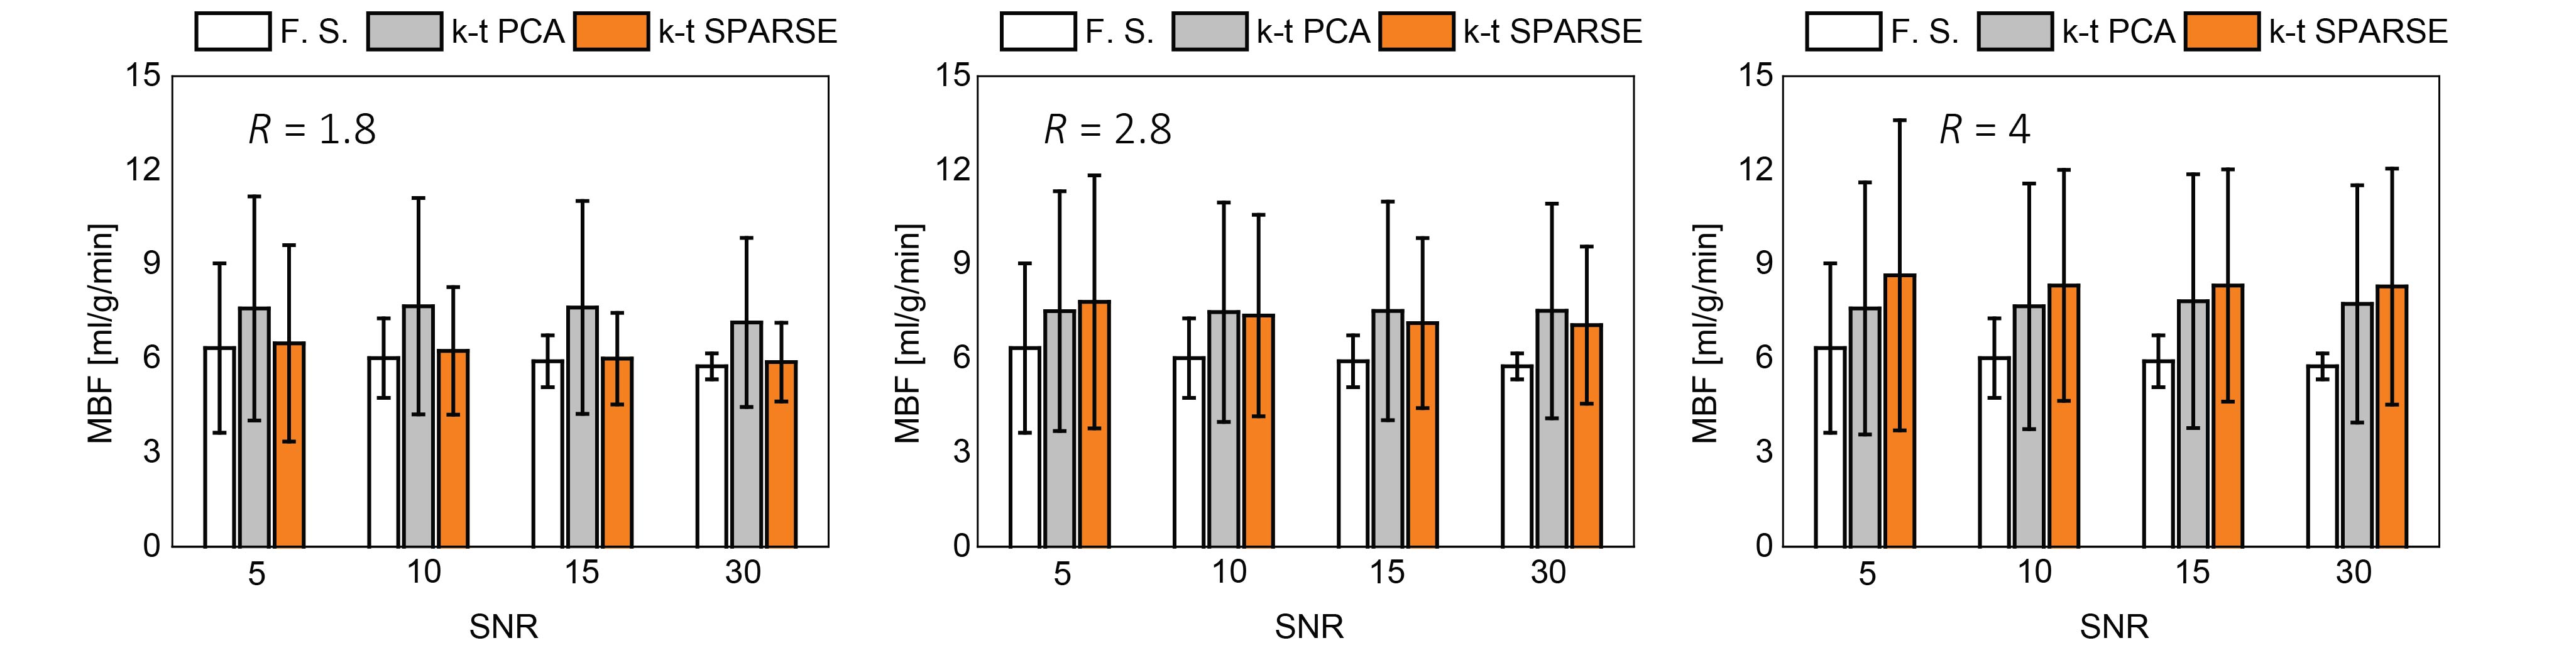
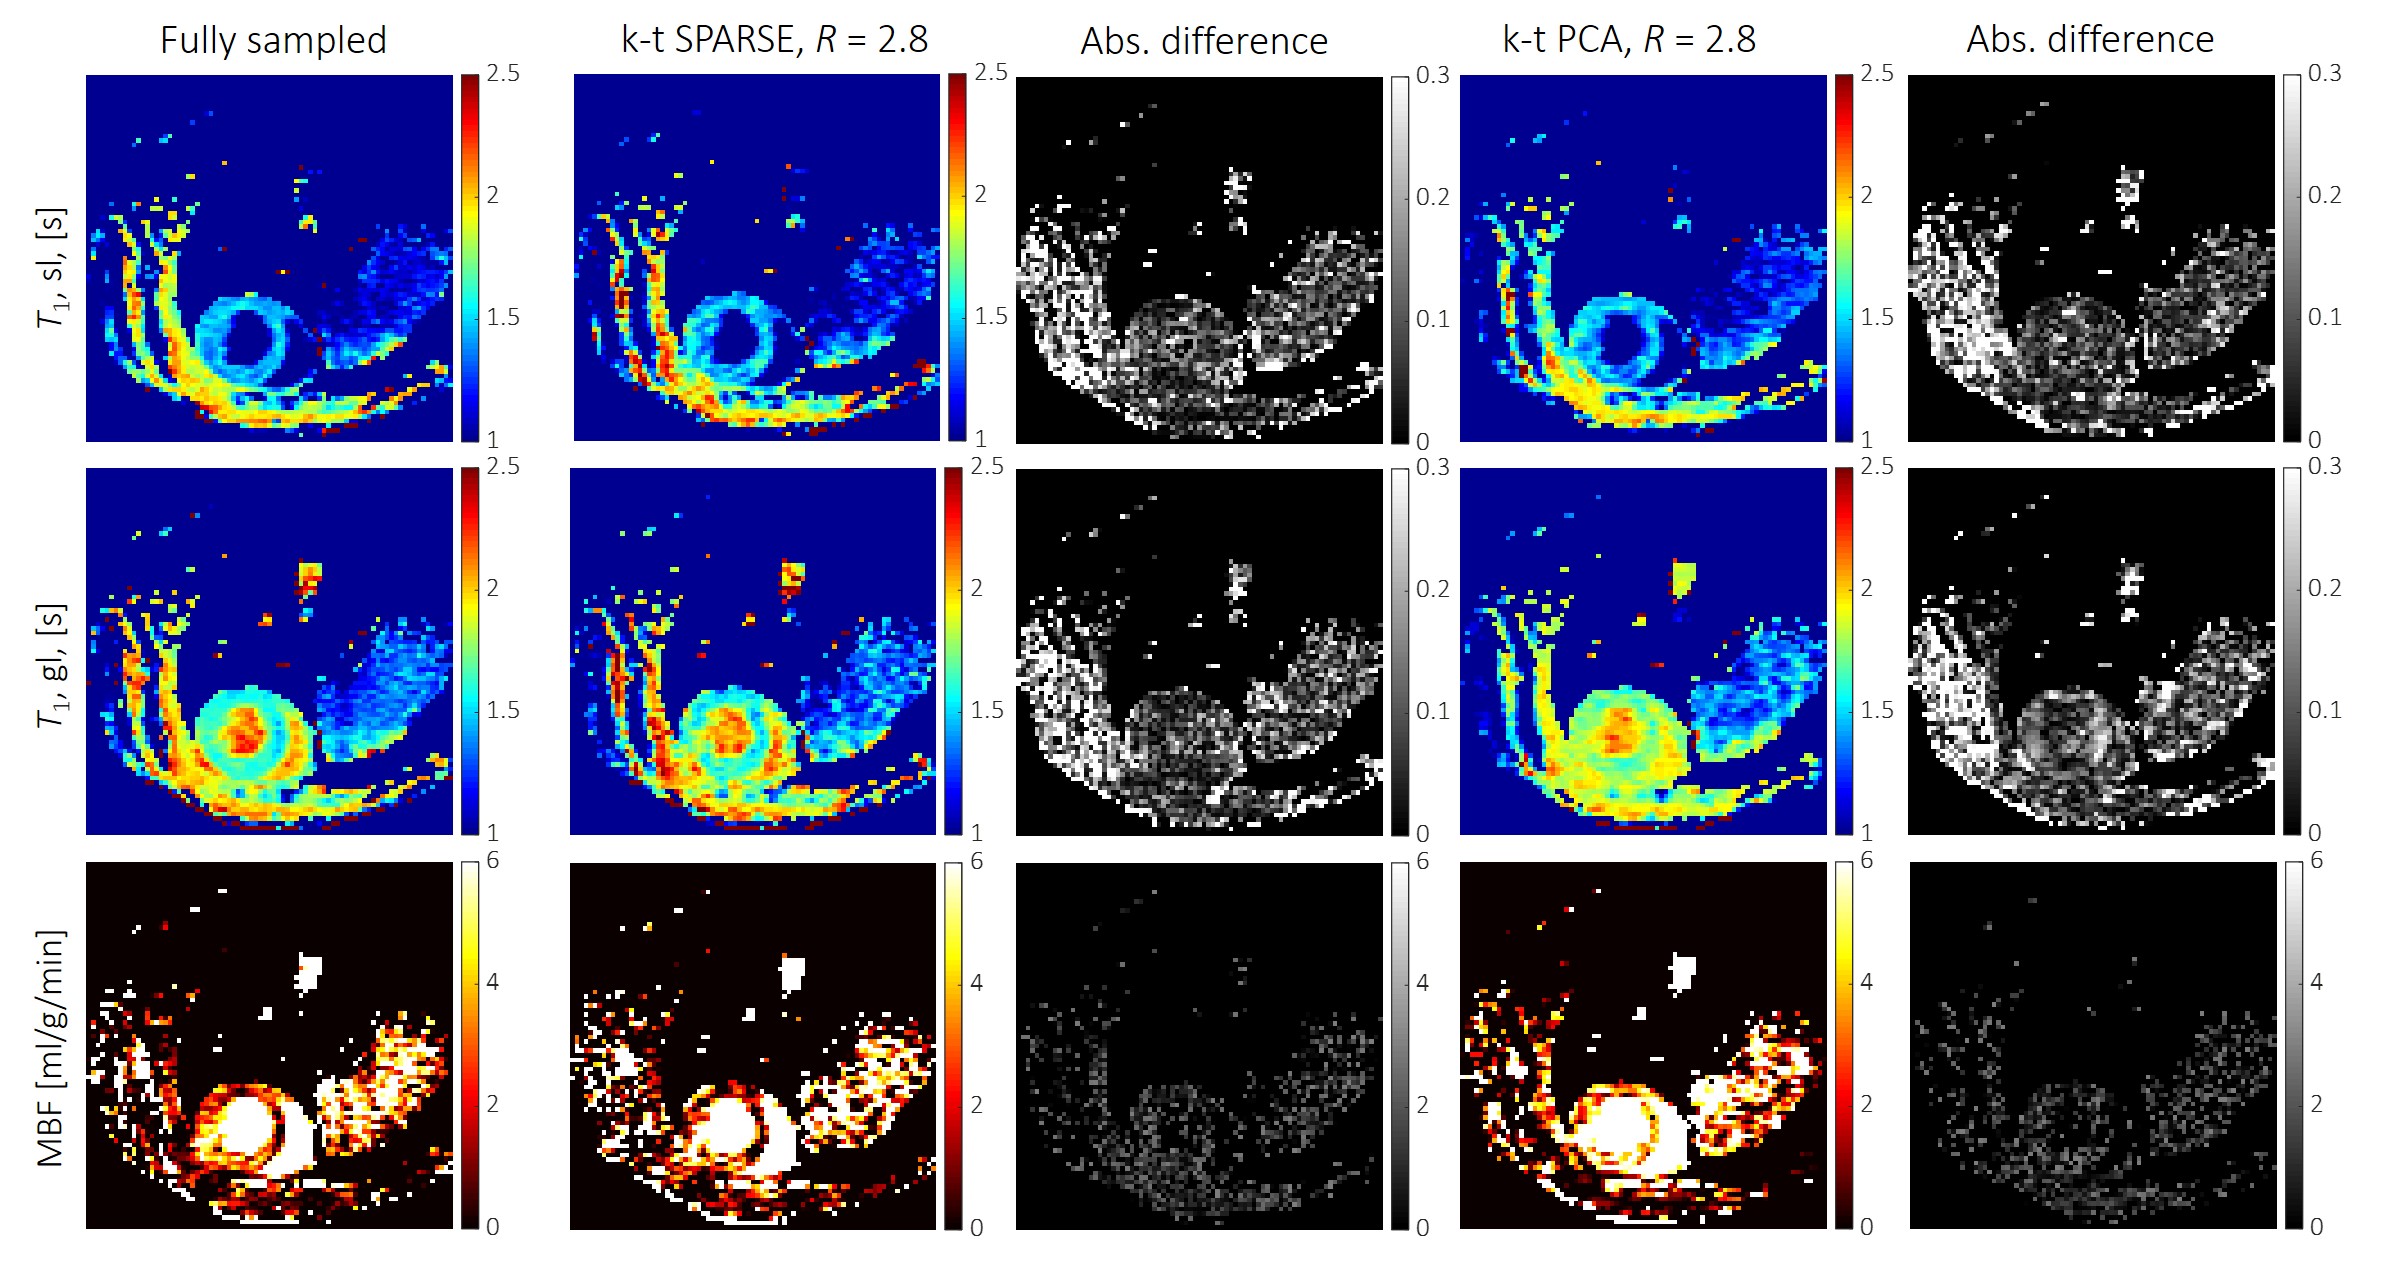
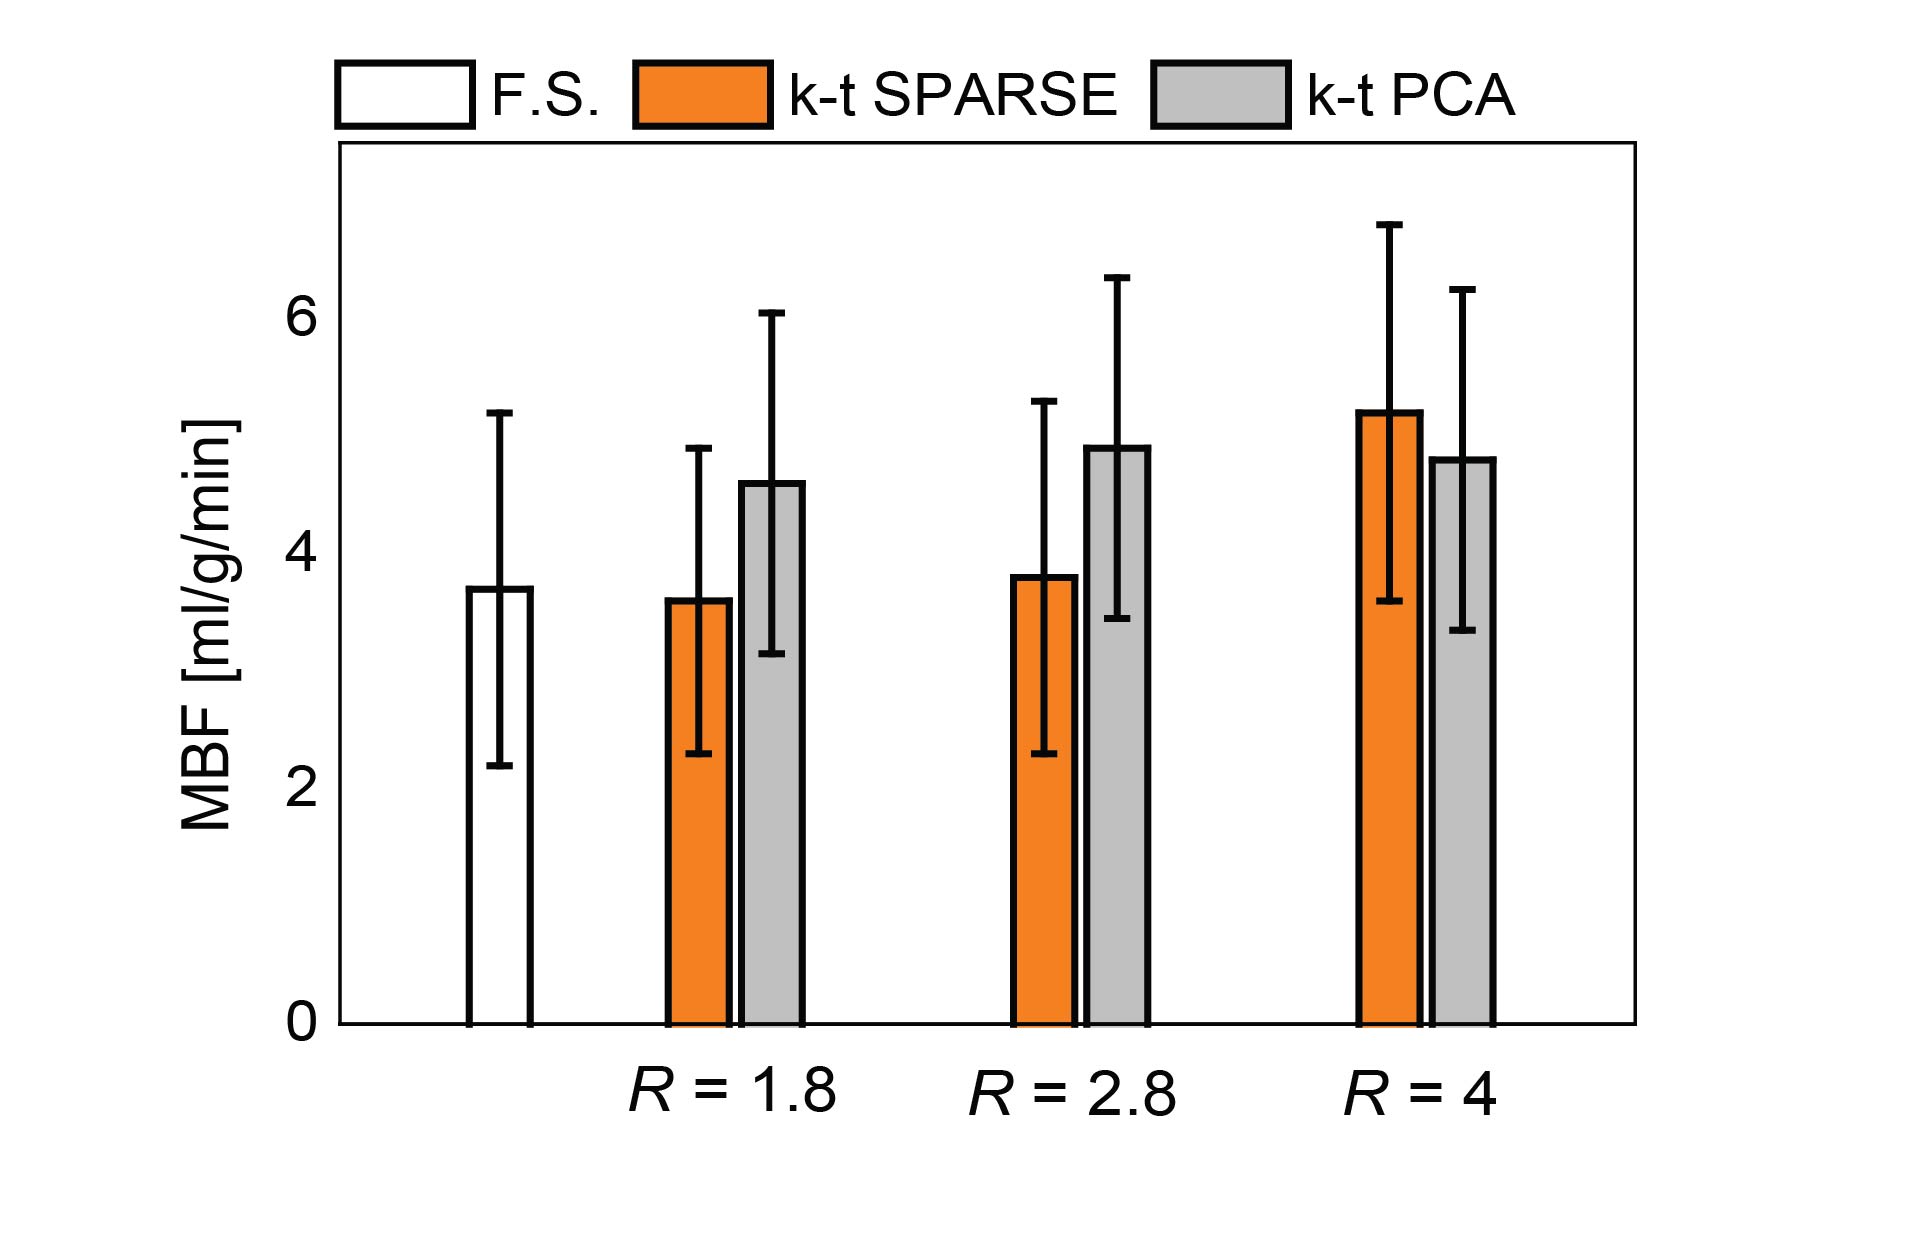
Simulations: The numerical phantom yielded the relation between acquisition parameters (SNR, acquisition matrix) on the reconstruction accuracy. Examples of simulated and retrospectively undersampled data for SNR=15 are given in Fig. 2. An analysis of mean MBF obtained for different undersampling factors and different SNR levels, using reconstruction with k–t SPARSE/k–t PCA is shown in Fig. 3.In-vivo data: Examples of image reconstructions from retrospectively undersampled in-vivo data recorded in a mouse at rest is shown in Fig. 4. A comparison of reconstruction accuracy for k–t SPARSE/k–t PCA for all acceleration factors tested is summarized in Fig. 5.
Discussion
The present study has demonstrated the potential benefit of accelerating ASL perfusion MR measurements with k–t undersampling. The numerical simulations have demonstrated that all key features of ASL measurement are reproduced up to three-fold undersampling. Both, k–t PCA and k–t SPARSE could be used to reconstruct the undersampled data. k–t SPARSE outperformed k–t PCA for acceleration factors up about three. Reconstruction with k–t PCA resulted in overestimation of the perfusion values, for all acceleration factors associated with spatiotemporal fidelity issues described previously15. The reconstruction with both, k–t SPARSE and k–t PCA did not depend significantly on the global SNR level. Our analysis of in-vivo data agreed well with the results obtained using the numerical phantom, indicating that k–t SPARSE might be better suited for acceleration of ASL perfusion imaging, provided a modest acceleration factor is used. The potential advantages of reducing the acquisition time of myocardial ASL perfusion include reduced variability and increased robustness toward physiological noise16 which are especially relevant in small animal measurements.Future work should focus on comparing reconstruction strategies prospectively and at different vasodynamic states to confirm the applicability of accelerated ASL for measuring perfusion reserves in small animals.
Acknowledgements
This project has received funding from the European Union’s Horizon 2020 research and innovation program under grant agreement No 820374.References
1. Kober F, Jao T, Troalen T, Nayak KS. Myocardial arterial spin labeling. J Cardiovasc Magn Reson. 2016;18:1-16. doi:10.1186/s12968-016-0235-4
2. Kober F, Iltis I, Izquierdo M, et al. High-Resolution Myocardial Perfusion Mapping in Small Animals In Vivo by Spin-Labeling Gradient-Echo Imaging. Magn Reson Med. 2004;67(August 2003):62-67. doi:10.1002/mrm.10676
3. Campbell-Washburn AE, Price AN, Wells JA, Thomas DL, Ordidge RJ, Lythgoe MF. Cardiac arterial spin labeling using segmented ECG-gated Look-Locker FAIR: Variability and repeatability in preclinical studies. Magn Reson Med. 2013;69(1):238-247. doi:10.1002/mrm.24243
4. Gutjahr FT, Kampf T, Winter P, et al. Quantification of perfusion in murine myocardium: A retrospectively triggered T1-based ASL method using model-based reconstruction. Magn Reson Med. 2015;74(6):1705-1715. doi:10.1002/mrm.25526
5. Vandsburger MH, Janiczek RL, Xu Y, et al. Improved Arterial Spin Labeling After Myocardial Infarction in Mice Using Cardiac and Respiratory Gated Look-Locker Imaging With Fuzzy C-Means Clustering. Magn Reson Med. 2010;657:648-657. doi:10.1002/mrm.22280
6. Naresh NK, Chen X, Moran E, Tian Y, French BA, Epstein FH. Repeatability and variability of myocardial perfusion imaging techniques in mice: Comparison of arterial spin labeling and first-pass contrast-enhanced MRI. Magn Reson Med. 2016;75(6):2394-2405. doi:10.1002/mrm.25769
7. Wespi P, Steinhauser J, Kwiatkowski G, Kozerke S. High-resolution hyperpolarized metabolic imaging of the rat heart using k–t PCA and k–t SPARSE. NMR Biomed. 2018;31(2). doi:10.1002/nbm.3876
8. Motaal AG, Coolen BF, Abdurrachim D, et al. Accelerated high-frame-rate mouse heart cine-MRI using compressed sensing reconstruction. 2013;(June 2012):451-457. doi:10.1002/nbm.2883
9. Naresh NK, Chen X, Roy RJ, Antkowiak PF, Annex BH, Epstein FH. Accelerated Dual-Contrast First-Pass Perfusion MRI of the Mouse Heart : Development and Application to Diet-Induced Obese Mice. Magn Reson Med. 2015;73:1237-1245. doi:10.1002/mrm.25238
10. Wissmann L, Segars WP, Kozerke S. MRXCAT: Realistic numerical phantoms for cardiovascular magnetic resonance. J Cardiovasc Magn Reson. 2014;16:1-11. doi:10.1186/s12968-014-0063-3
11. Segars WP, Sturgeon G, Mendonca S, Grimes J, Tsui BMW. 4D XCAT phantom for multimodality imaging research. Med Phys. 2010;37(9):4902-4915. doi:10.1118/1.3480985
12. Kampf T, Helluy X, Gutjahr FT, et al. Myocardial perfusion quantification using the T1-based FAIR-ASL method: The influence of heart anatomy, cardiopulmonary blood flow and look-locker readout. Magn Reson Med. 2014;71(5):1784-1797. doi:10.1002/mrm.24843
13. Lustig M, Santos JM, Donoho D, Pauly JM. k–t SPARSE: High frame rate dynamic MRI exploiting spatio-temporal sparsity. Proc 14th Annu Meet Int Soc Magn Reson Med. 2006;50(5):2420. http://cds.ismrm.org/ismrm-2006/files/02420.pdf.
14. Pedersen H, Kozerke S, Ringgaard S, Nehrke K, Won YK. K–t PCA: Temporally constrained k–t BLAST reconstruction using principal component analysis. Magn Reson Med. 2009;62(3):706-716. doi:10.1002/mrm.22052
15. Vitanis V, Manka R, Giese D, et al. High resolution three-dimensional cardiac perfusion imaging using compartment-based k–t principal component analysis. Magn Reson Med. 2011;65(2):575-587. doi:10.1002/mrm.22620
16. Do HP, Jao TR, Nayak KS. Myocardial arterial spin labeling perfusion imaging with improved sensitivity. J Cardiovasc Magn Reson. 2014;16:1-6. doi:10.1186/1532-429X-16-15
Figures