1086
5D Flow Tensor MRI with Multipoint Encoding for Efficient Mapping of Reynolds Stresses in the In-vivo Aorta1Institute for Biomedical Engineering, University and ETH Zurich, Zurich, Switzerland, Zurich, Switzerland, 2Great Ormond Street Hospital, London, United Kingdom, 3Department of Cardiology, University Hospital Zurich, Zurich, Switzerland
Synopsis
In-vivo 5D Flow Tensor MRI with multipoint encoding for accurate assessment of Reynolds stresses in the aorta is presented. Based on distributions of turbulence intensity in healthy and pathological flows, a 6-directional multipoint encoding with 3 different encoding strengths is proposed. Using a 5D Flow compressed sensing acquisition in-vivo data are collected in 10 minutes irrespective of breathing motion. Data obtained in aortic valve patients and healthy controls demonstrate the feasibility of the method to quantify turbulence in healthy and pathological flow.
Introduction
Turbulence can be considerable in pathological flows1 but is neglected in conventional 4D Flow MRI. Based on the signal model for generalized phase-contrast MRI2, statistical measures of turbulence can be derived from the ratio of a non-encoded and a velocity-encoded phase-contrast measurement:$$S(k_v)=S_0\,exp\left(\frac{-\sigma^2 {k_v}}{2}\right)\,exp(-ik_v\bar{v})$$with intra-voxel standard deviation (IVSD) of turbulent velocity components$$$\,\sigma$$$, mean velocity$$$\,\bar{v}\,$$$, velocity encoding$$$\,k_v$$$, and a signal component independent of flow$$$\,S_0$$$. Encoding motion in at least 6 non-collinear directions allows for derivation of the entire Reynolds stress tensor (RST). Given the non-linear relationship between$$$\,S(k_v)\,$$$and$$$\,\sigma\,$$$in the above equation, choosing the encoding strength$$$\,k_v\,$$$is crucial for accurate quantification in the presence of noise. To address this issue, multipoint encoding can be employed to increase the dynamic range of turbulence quantification at the cost of increased scan times4. Building on recent advances in accelerated 5D Flow MRI5, we propose multipoint 5D Flow Tensor MRI to quantify turbulence in clinically feasible scan times.Methods
Simulations and In-vivo DataThe distribution of IVSD was compared based on 4D Flow MRI data of patients with moderate and severe aortic valve stenosis $$$\left(N=28\right)$$$ and healthy controls $$$\left(N=9\right)$$$ collected as part of a previous study6. Resulting uncertainty for given VENC on IVSD quantification was assessed using Monte-Carlo simulations.
The effect of different signal-to-noise ratios (SNR) and the impact of image resolution was assessed using data previously acquired with particle tracking velocimetry (PTV)7. Moreover, a Monte-Carlo simulation with 40 repetitions provided accuracy and precision of TKE and maximum principal turbulent shear stress (MPTSS) quantification at$$$\,30~dB\,$$$and$$$\,2.5~mm\,$$$resolution (as estimated for in vivo exams). A prospective in-vivo study of flow in the aorta of two patients with bioprosthetic aortic valves and two healthy controls was performed on a 1.5T MR system (Philips Healthcare, Best, The Netherlands). Scan parameters were $$$TE/TR = 3.9~ms/~6.0~ms$$$, spatial resolution $$$2.5\times2.5\times2.5~mm^3$$$, $$$25$$$ cardiac phases, $$$10$$$ minutes scan time.
Encoding Scheme and Acquisition
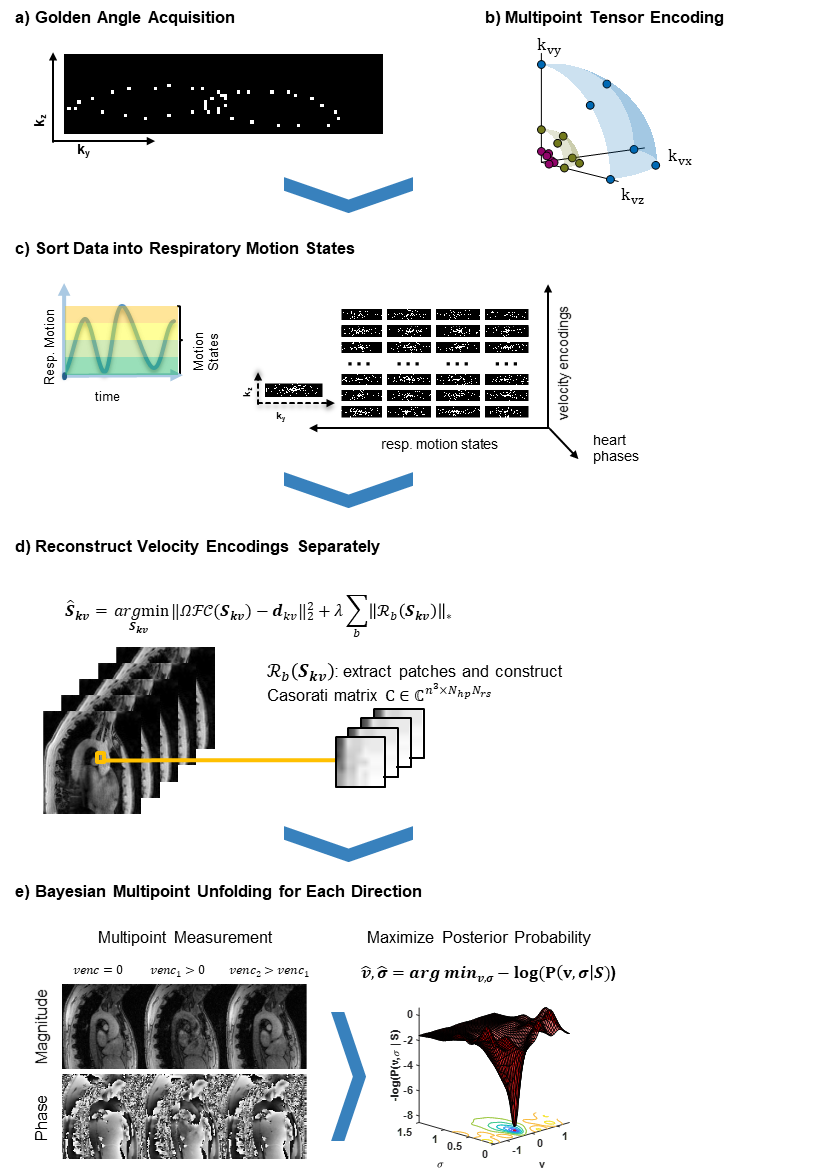
A distributed 6-directional encoding scheme with encoding velocities (VENC) of $$$0.5~m/s$$$, $$$1.5~m/s$$$ and $$$4.5~m/s$$$ per axis was used. Velocities were encoded along the Cartesian axes and along the diagonals. Data acquisition was performed using a compressed sensing 5D Flow MRI sequence5 and multipoint Reynolds tensor encoding. Data were reconstructed using Bayesian multipoint unfolding4 as illustrated in Figure 1.
Data Analysis
Turbulent Kinetic Energy (TKE) was calculated as:$$TKE=\frac{\rho}{2} \left(\overline{v^{'}_xv^{'}_x}+\overline{v^{'}_yv^{'}_y}+\overline{v^{'}_zv^{'}_z}\right)$$
with $$$\rho=1060\,kg/m^3$$$.
MPTSS was calculated from the eigenvalues$$$\,\delta_1>\delta_2>\delta_3\,$$$of the RST as:$$\tau_{max}=0.5(\delta_1-\delta_3).$$
Results
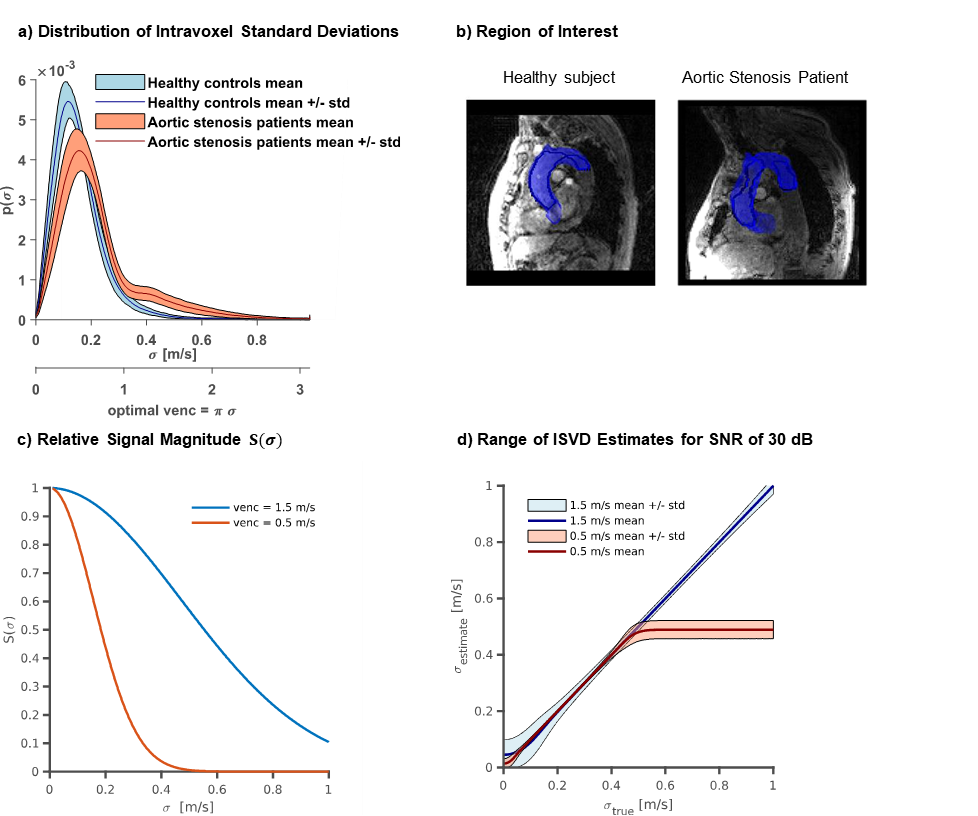
SimulationsAs shown in Figure 2a, ISVD reaches up to $$$0.8~m/s$$$ in patients, while peak ISVD values of $$$0.3~m/s$$$ are measured in healthy controls. A velocity encoding (VENC) of $$$0.5~m/s$$$ shows high sensitivity to IVSD in the healthy controls whereas a VENC of $$$1.50~m/s$$$ is optimal to probe IVSD in the aortic stenosis patients. Effects of SNR and image resolution are summarized in Figure 3. At a resolution of$$$\,2.5~mm\,$$$and an SNR of $$$30~dB$$$, as used for the in vivo exams, MPTSS is overestimated by $$$15.9\%$$$ on average. TKE distributions are also skewed towards higher values for large voxel sizes with an overestimation of$$$\,3.1\%\,$$$ at$$$\,2.5\,mm\,$$$voxel size. Results of the Monte-Carlo assessment of precision and accuracy at $$$30~dB$$$ and$$$\,2.5~mm\,$$$voxel size yield TKE values with a mean of $$$511.8 ± 1.4~J/m^3$$$ and a standard deviation of$$$\,198.9±\,4.6~J/m^3\,$$$and values of MPTSS with a mean of $$$\,174.9±\,1.6~Pa$$$ and a standard deviation of$$$\,110.7\,±\,10.0~Pa$$$.
Prospective In-vivo Data
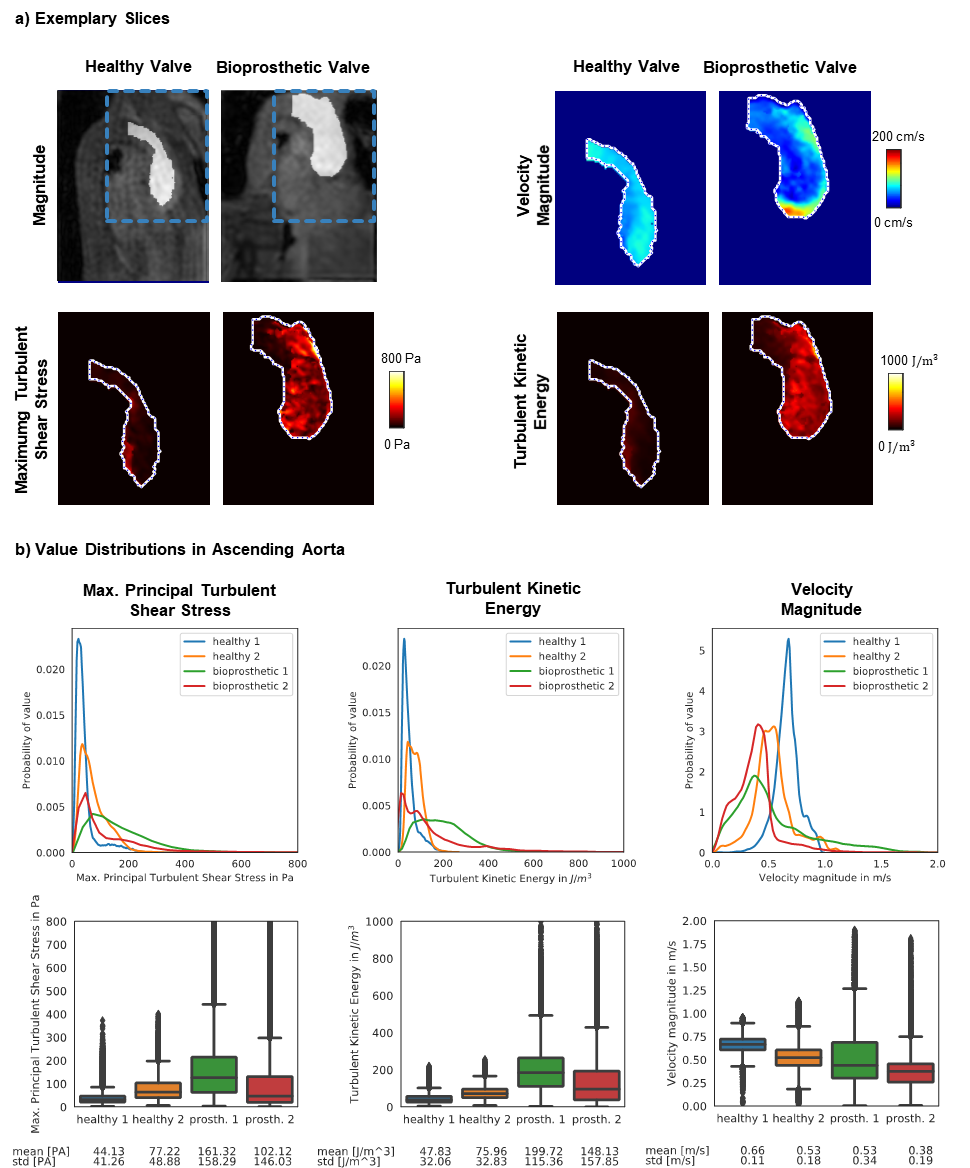
Figure 4a shows exemplary results in a single slice for a patient and a healthy control. The highest values of TKE and MPTSS are found downstream of the bio-prosthetic valve in the patient. Figure 4b shows value distributions of velocity magnitudes, TKE and MPTSS in the ascending aorta during systole for all subjects. While distributions of velocity show similar values of mean and standard deviation, distributions of MPTSS and TKE exhibit higher mean values and standard deviations for the two patients.
Discussion
In this work, the assessment of mean and turbulent flow components including the entire RST in-vivo has been demonstrated. Based on distributions of IVSD in the aortae of healthy subjects and patients with aortic valve disease, a multipoint encoding scheme was proposed. Simulations have further revealed that reduced image resolution leads to an overestimation of turbulence, which can be related to violation of the assumption of Gaussian intra-voxel velocity distributions8. In the future, data assimilation approaches9 are considered an option to address this limitation.By leveraging high-dimensional signal correlations with 5D imaging5, in-vivo RST assessments with a duration of 10 minutes have become possible. Distinct differences in distributions of MPTSS and TKE have been found in patients when compared to healthy controls. MPTSS values in the patients with bioprosthetic valves were higher compared to controls but remained below the threshold of elevated risk of red blood cell damage (ca.$$$\,600~Pa$$$10 and$$$\,800~Pa$$$11). Beyond the in-vivo feasibility demonstrated in our work, further studies are warranted to include e.g. patients with mechanical heart valves, which have been associated with blood cell damage12.
Conclusion
5D Flow Tensor MRI provides sufficient precision for the in-vivo quantification of the Reynolds stress tensor and holds promise to provide comprehensive flow assessment in patients with heart valve diseases.Acknowledgements
The authors thank Dr. Christian Stoeck for his support in conducting the patient scans, Dr. Gérard Crelier from Gyrotools LLC for his support in developing the 5D Flow Tensor pulse sequence, and Dr. Christian Binter for providing the PTV data used for simulations.References
1. Stein PD, Sabbah HN. Turbulent blood flow in the ascending aorta of humans with normal and diseased aortic valves. Circulation research. 1976;39(1):58–65.
2. Dyverfeldt P, Sigfridsson A, Kvitting JPE, Ebbers T. Quantification of intravoxel velocity standard deviation and turbulence intensity by generalizing phase-contrast MRI. Magnetic Resonance in Medicine. 2006;56(5):850–858.
3. Elkins CJ, Alley MT, Saetran L, Eaton JK. Three-dimensional magnetic resonance velocimetry measurements of turbulence quantities in complex flow. Experiments in Fluids. 2009;46(2):285–296.
4. Binter C, Knobloch V, Manka R, Sigfridsson A, Kozerke S. Bayesian multipoint velocity encoding for concurrent flow and turbulence mapping. Magnetic Resonance in Medicine. 2013;69(5):1337–1345.
5. Walheim J, Dillinger H, Kozerke S. Multipoint 5D Flow Cardiovascular Magnetic Resonance - Accelerated Cardiac- and Respiratory-Motion Resolved Mapping of Mean and Turbulent Velocities. Journal of Cardiovascular Magnetic Resonance. 2019.
6. Binter C, Gotschy A, Sündermann SH, Frank M, Tanner FC, Lüscher TF, Manka R, Kozerke S. Turbulent Kinetic Energy Assessed by Multipoint 4-Dimensional Flow Magnetic Resonance Imaging Provides Additional Information Relative to Echocardiography for the Determination of Aortic Stenosis Severity. Circulation: Cardiovascular Imaging. 2017;10(6):1–8.
7. Knobloch V, Binter C, Gülan U, Sigfridsson A, Holzner M, Lüthi B, Kozerke S. Mapping mean and fluctuating velocities by Bayesian multipoint MR velocity encoding-validation against 3D particle tracking velocimetry. Magnetic Resonance in Medicine. 2014;71(4):1405–1415.
8. Binter C, Gülan U, Holzner M, Kozerke S. On the accuracy of viscous and turbulent loss quantification in stenotic aortic flow using phase-contrast MRI. Magnetic Resonance in Medicine. 2016;76(1):191–196.
9. Funke SW, Nordaas M, Evju Ø, Alnæs MS, Mardal KA. Variational data assimilation for transient blood flow simulations: Cerebral aneurysms as an illustrative example. International Journal for Numerical Methods in Biomedical Engineering. 2018;(April 2017):1–27.
10. Grigioni M, Daniele C, D’Avenio G, Barbaro V. A discussion on the threshold limit for hemolysis related to Reynolds shear stress. Journal of Biomechanics. 1999;32(10):1107–1112.
11. Lu PC, Lai HC, Liu JS. A reevaluation and discussion on the threshold limit for hemolysis in a turbulent shear flow. Journal of biomechanics. 2001;34(10):1361–1364.
12. Yoganathan AP, Woo YR, Sung HW. Turbulent shear stress measurements in the vicinity of aortic heart valve prostheses. Journal of Biomechanics. 1986;19(6):433–442.
Figures