1085
Decoding the Effects of Rhythm on Hemodynamics in Patients with Atrial Fibrillation Using a 5D Flow Framework1Department of Radiology, Northwestern University, Feinberg School of Medicine, Chicago, IL, United States, 2Department of Biomedical Engineering, Northwestern University, Evanston, IL, United States, 3Department of Radiology, Lausanne University Hospital (CHUV) and University of Lausanne (UNIL), Lausanne, Switzerland, 4Siemens Healthcare, Lausanne, Switzerland, 5Department of Medicine and Preventive Medicine, Northwestern University, Feinberg School of Medicine, Chicago, IL, United States
Synopsis
Atrial fibrillation (AF) is the most common cardiac arrhythmia and is associated with increased risk of ischemic stroke. Arrhythmic heartbeats in AF may alter atrial flow characteristics and the influence of differences in heart rates on LA 3D hemodynamics has not yet been systematically investigated. Recently, a fully self-gated free-running 5D flow (4D flow+respiration) framework was introduced and validated. The purpose of this study was to expand the 5D flow framework to explore the influence of heart rates on thrombogenic hemodynamic parameters in AF patients.
Introduction
Atrial fibrillation (AF) is the most common cardiac arrhythmia and is associated with increased risk of ischemic stroke. Prior 4D flow studies have found that patients in AF at the time of imaging have significantly increased left atrial (LA) stasis and decreased peak velocities, factors associated with increased a propensity for thrombogenesis and thus risk for stroke, compared to AF patients in sinus rhythm.1 While these findings demonstrate the potential of 4D flow in AF management and stroke risk assessment, current techniques are limited by lengthy data acquisitions over many cardiac cycles, which assume uniform heart rates. However, arrhythmic heartbeats in AF may alter atrial flow characteristics. Moreover, the influence of differences in heart rates on LA 3D hemodynamics has not yet been systematically investigated. Recently, a fully self-gated free-running 5D flow (4D flow+respiration) framework was introduced and validated.2,3 The purpose of this study was to expand the 5D flow framework to explore the influence of heart rates on thrombogenic hemodynamic parameters in AF patients.Methods: 5D flow acquisition and reconstruction
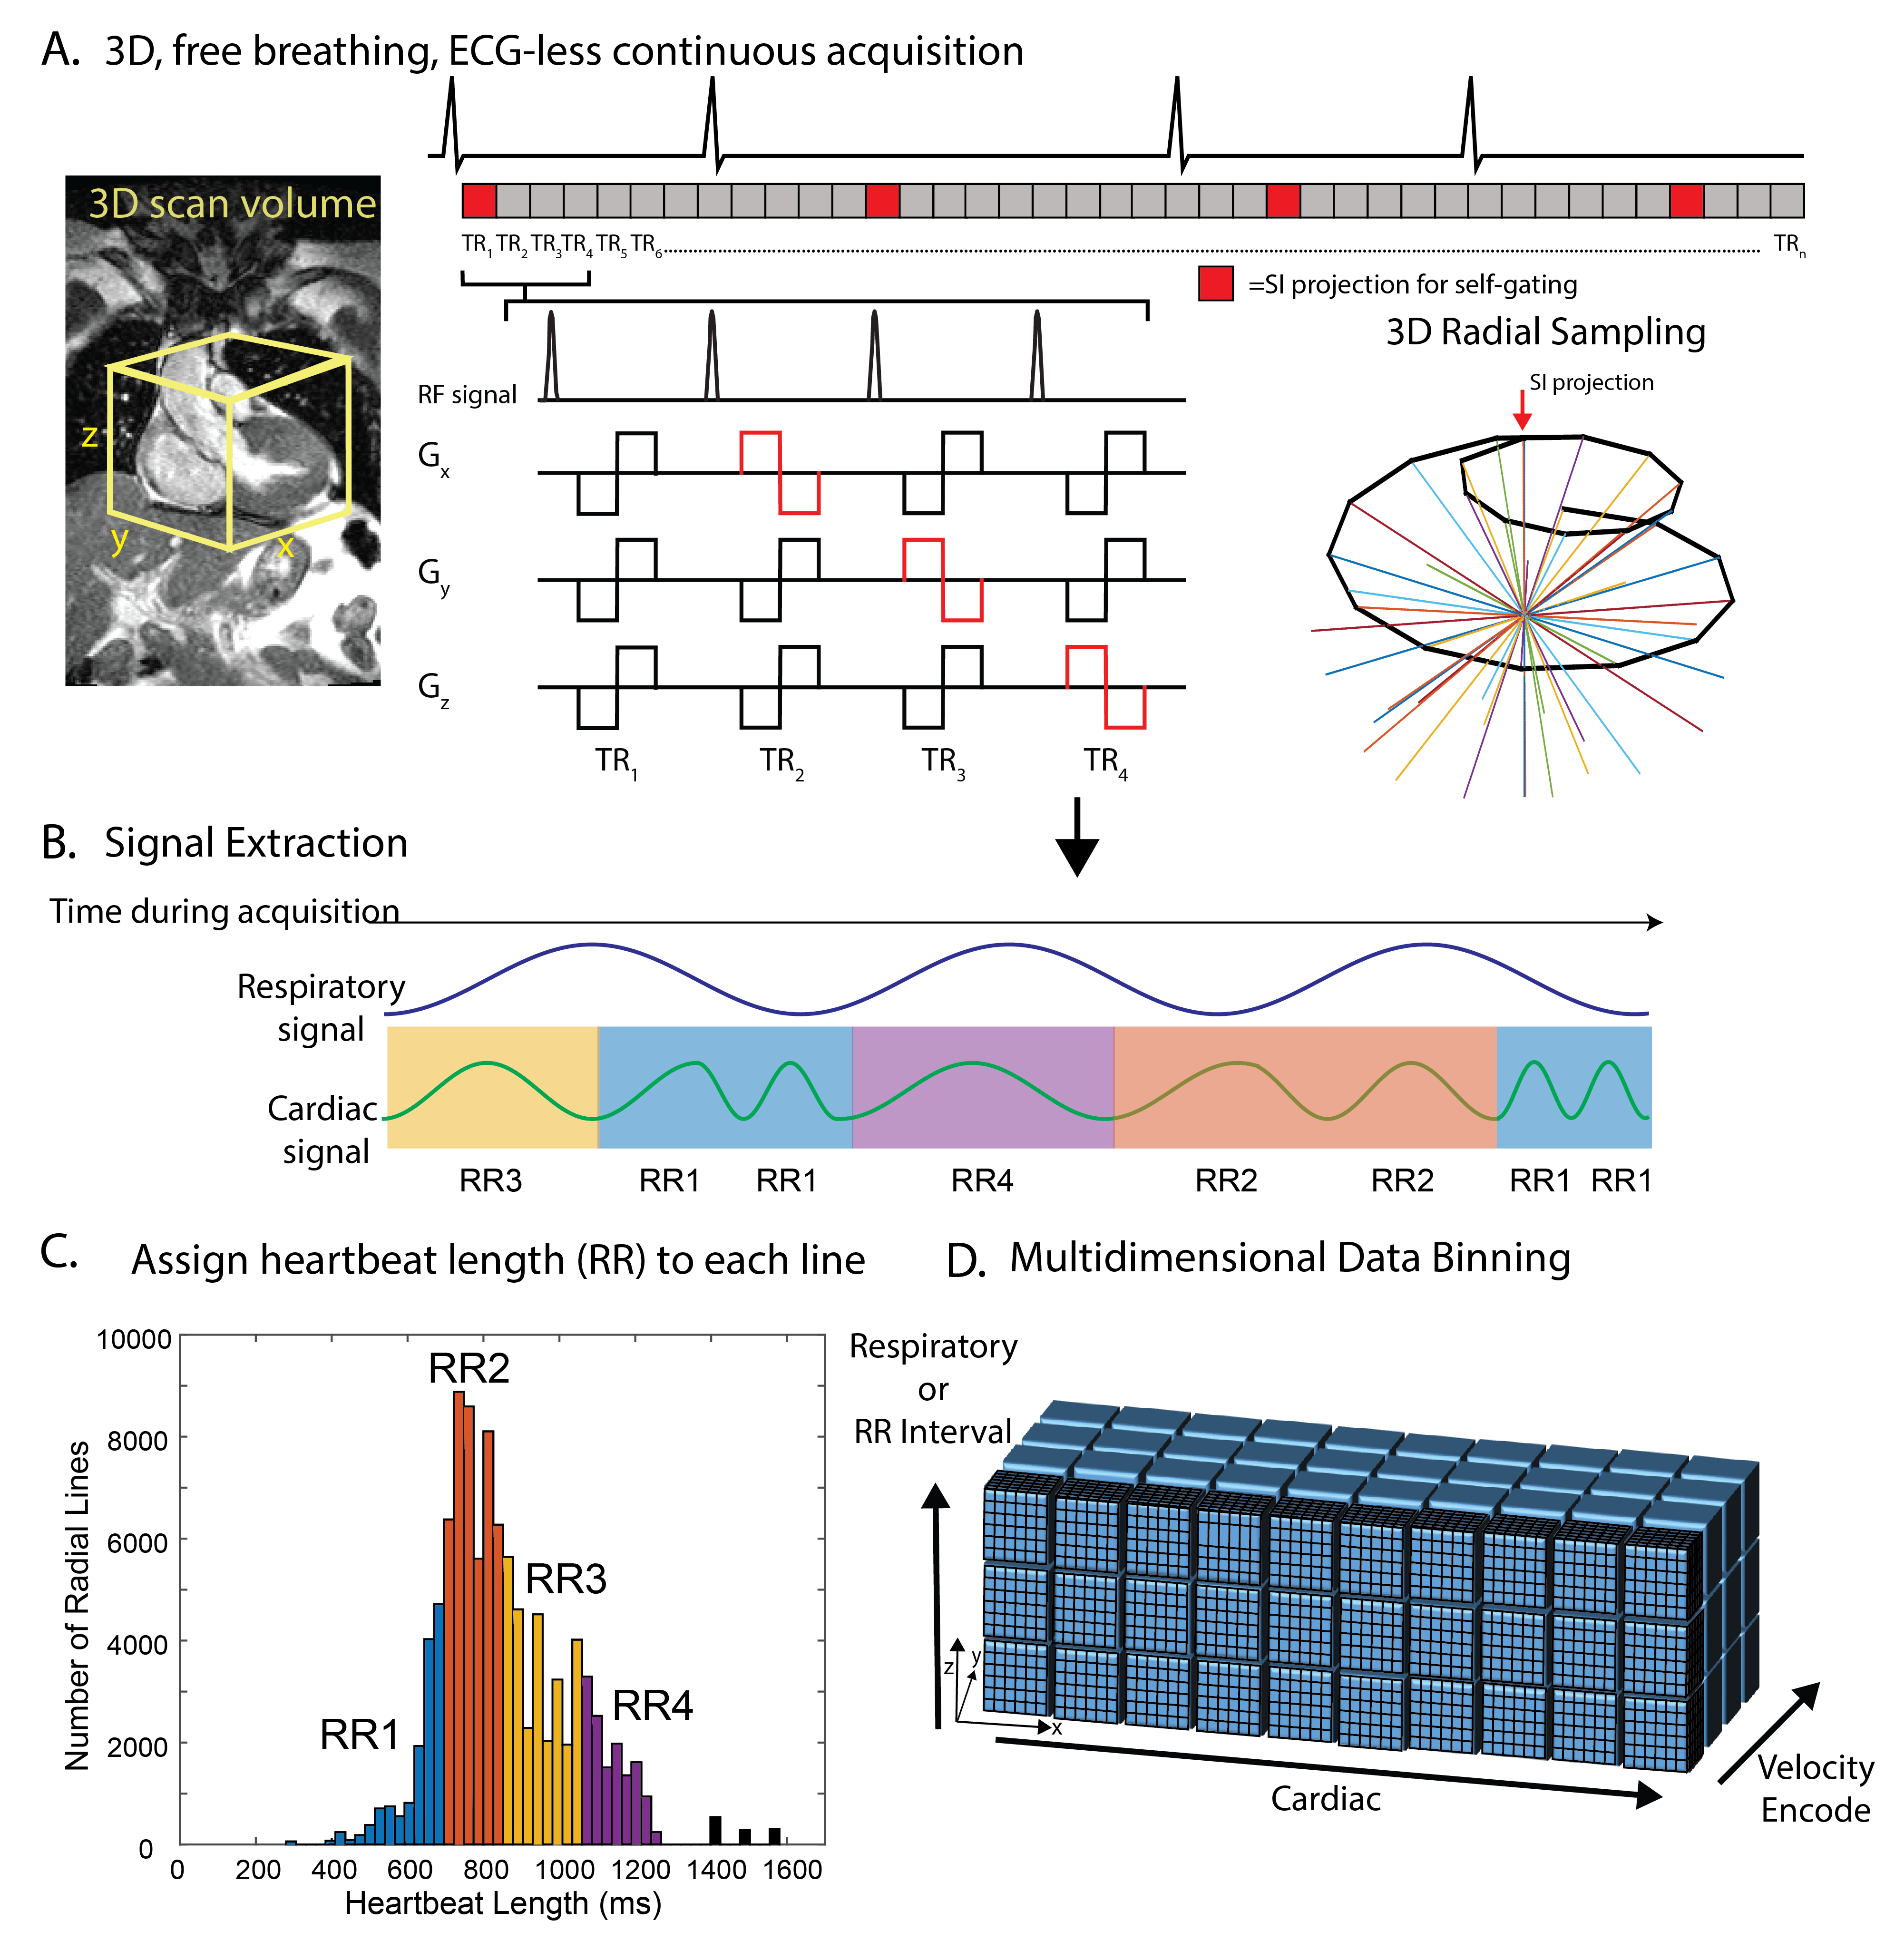
A prototype free-running 5D flow sequence was implemented with balanced 4-point velocity encoding. 3D radial sampling pattern4 was interspersed with superior-inferior projections, which were retrospectively used for cardiac and respiratory self-gating (Figure 1A,B). Using a user-defined temporal resolution of ~40 ms, cardiac signals were used to bin the acquired k-space lines into the appropriate cardiac phase, and additionally to tag each line with the length of the heartbeat within which it was acquired. Though self-gating based on cardiac motion, not the ECG, was used for binning, heartbeat length will hereafter be referred to as “RR-interval” for simplicity. All data were binned into a standard 5D flow dataset (kx-ky-kz-cardiac-respiratory) with 4 respiratory bins, and AF data were additionally binned into a respiratory-averaged, RR-interval-resolved 5D datasets (kx-ky-kz-cardiac-RR interval) with 4 RR-interval bins. RR-interval bin widths were determined for each patient by examining all unique heartbeat lengths and dividing the bins such that the same number of RRs was in each bin (Figure 1C). Because the temporal resolution was kept constant between bins, the last phase of shorter RR bins (RR1-3) was repeated so that all RR bins had the same number of cardiac timepoints as the longest bin (RR4). All data were reconstructed using the previously described 5D flow framework by solving the following optimization problem:[1] $$$m=\underset{\mathbf{m}}{\text{arg min}} \left|\left|FCm-s\right|\right|_2^2+\lambda_c\left|\left|\nabla_cm\right|\right|_1+\lambda_{r\ }\left|\left|\nabla_{r\ }m\right|\right|_1+\lambda_\sigma\left|\left|\nabla_\sigma m\right|\right|_1$$$,
where m is the reconstructed 5D flow dataset, F is the non-uniform Fast Fourier Transform operator, s the acquired radial data, $$$\lambda_c$$$, $$$\lambda_r$$$ and $$$\lambda_\sigma$$$ the regularization weights along the cardiac, respiratory, and spatial (x,y,z) dimensions, and $$$\nabla$$$ the total variation sparsifying operator. Patients in AF during imaging were additionally reconstructed with an RR-interval dimension and averaged respiration, where [2]$$$m=\underset{\mathbf{m}}{\text{arg min}} \left|\left|FCm-s\right|\right|_2^2+\lambda_c\left|\left|\nabla_cm\right|\right|_1+\mathbf{\lambda}_{\mathbf{rr}} \left|\left|\mathbf{\nabla}_{\mathbf{rr}}\mathbf{m}\right|\right|_\mathbf{1}+\lambda_\sigma\left|\left|\nabla_\sigma m\right|\right|_1$$$, and $$$\lambda_{rr}$$$ is the RR-interval regularization weight.
Methods: In vivo AF cohort
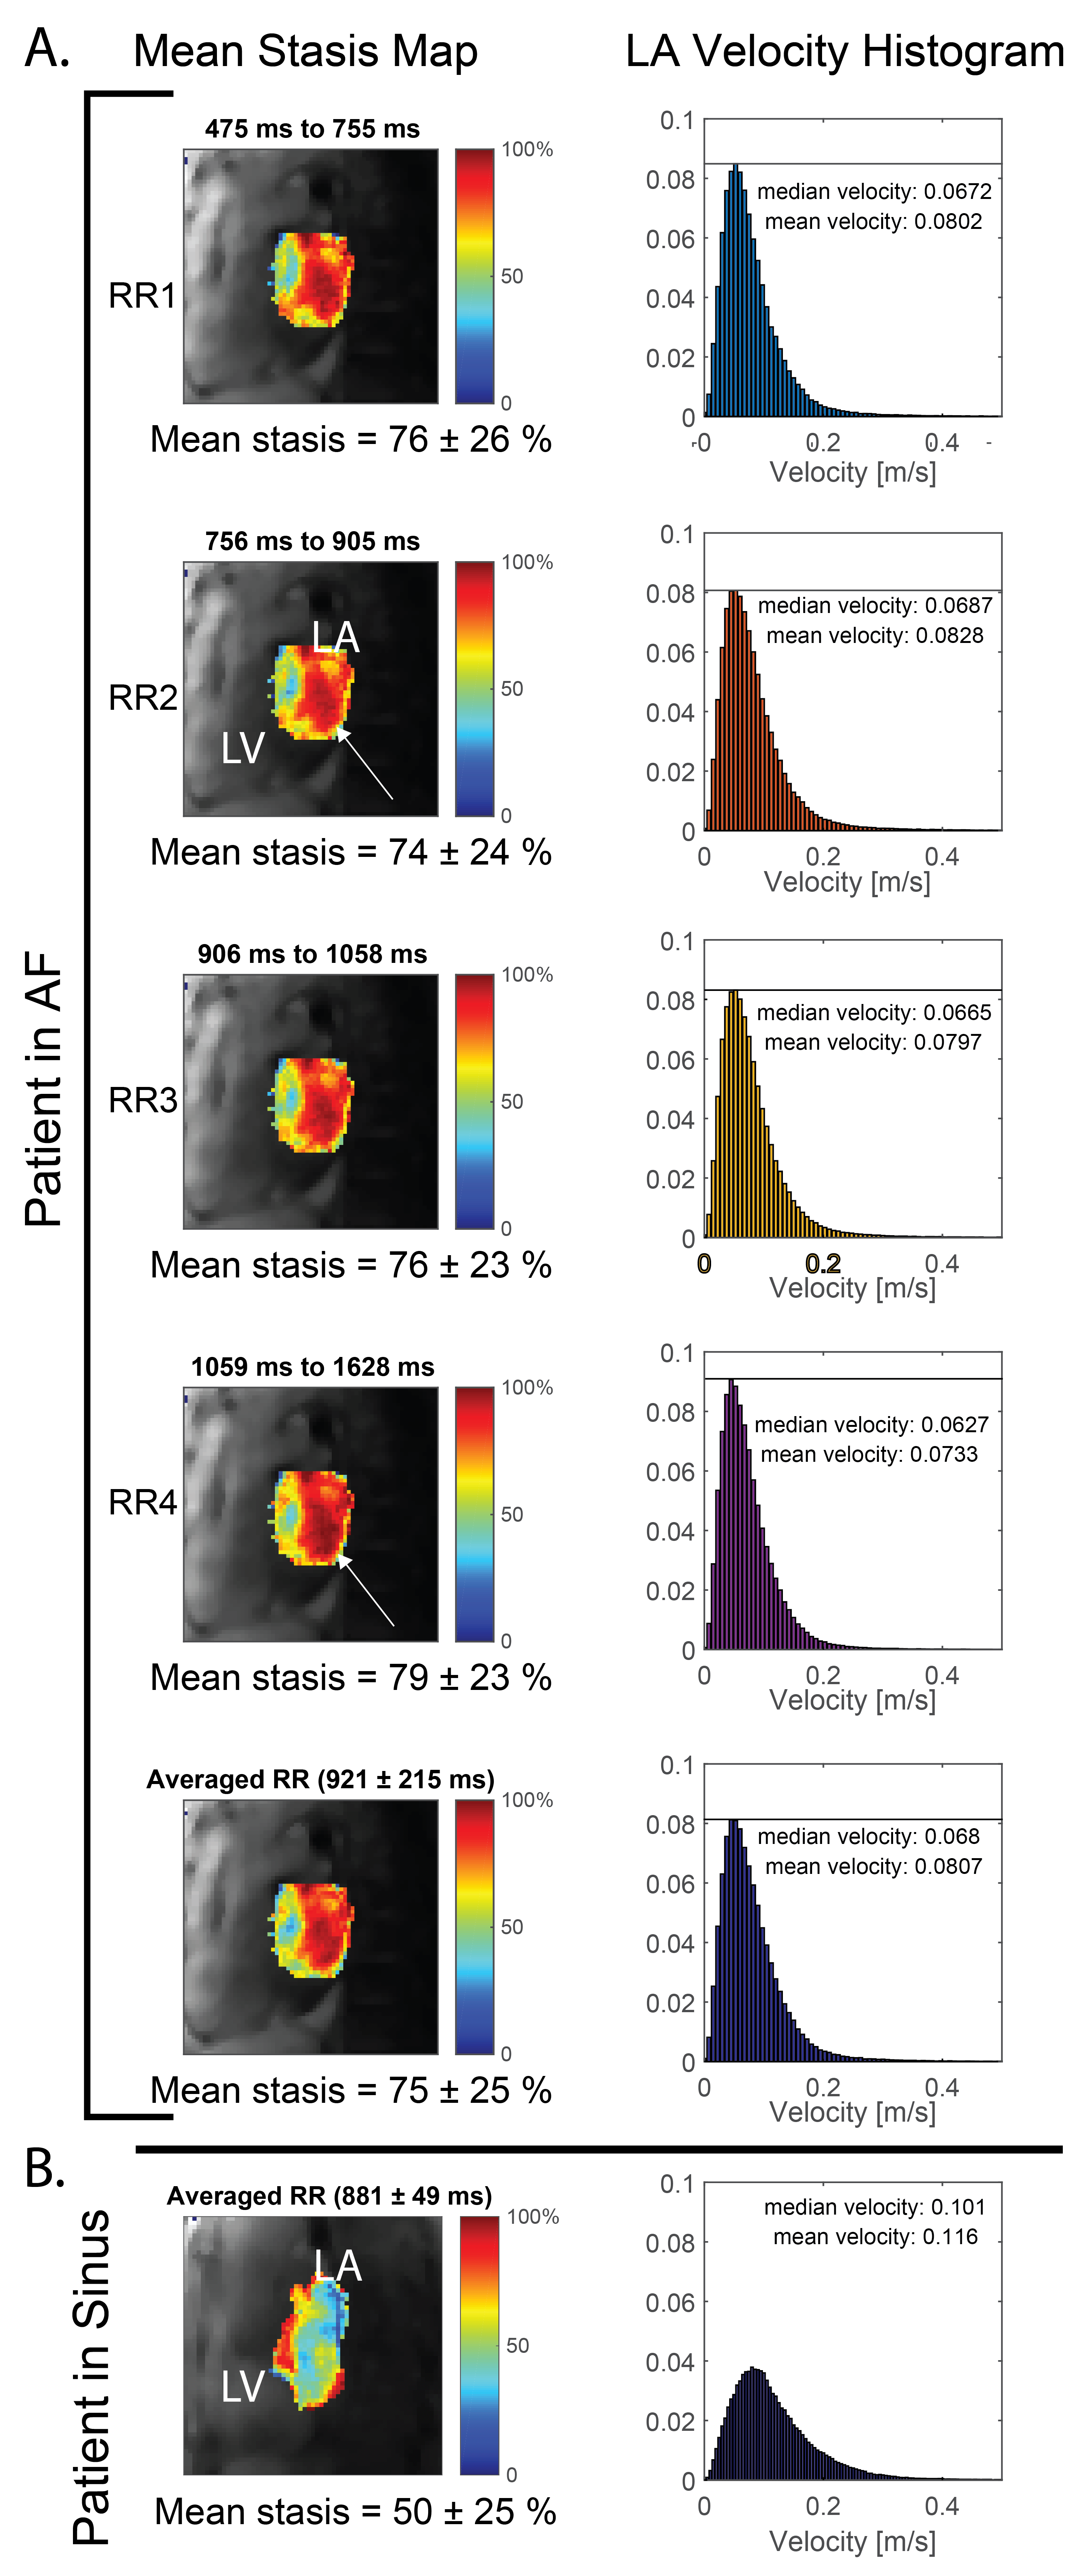
Whole-heart 5D flow imaging was performed on a 1.5 T MAGENTOM Aera (Siemens Healthcare AG, Erlangen, Germany) in 12 patients with a history of AF, with two patients returning for a rescan, resulting in 14 total MRIs (1F, age=66.9±8.6y, Venc=100-150 cm/s, TE/TR/FA=2.03-3.47ms/4.7-5.2ms/7°, spatial resolution=2.3-2.5 mm3, temporal resolution=37.6-41.7 ms, non-contrast). All studies were reconstructed with the “standard 5D” pipeline (eqn. 1) representing averaging of all heart rates, and end-expiration was used for all calculations. 9/14 scans included patients in AF at the time of imaging, and thus were additionally reconstructed with the RR-interval-resolved pipeline (eqn. 2). 3D segmentation of the LA was used to calculate the LA averaged top 5% of velocities (peak velocity, PV), mean stasis (% cardiac cycle where voxel velocities<0.1 m/s)1,8, and to derive LA stasis maps and velocity histograms.Results
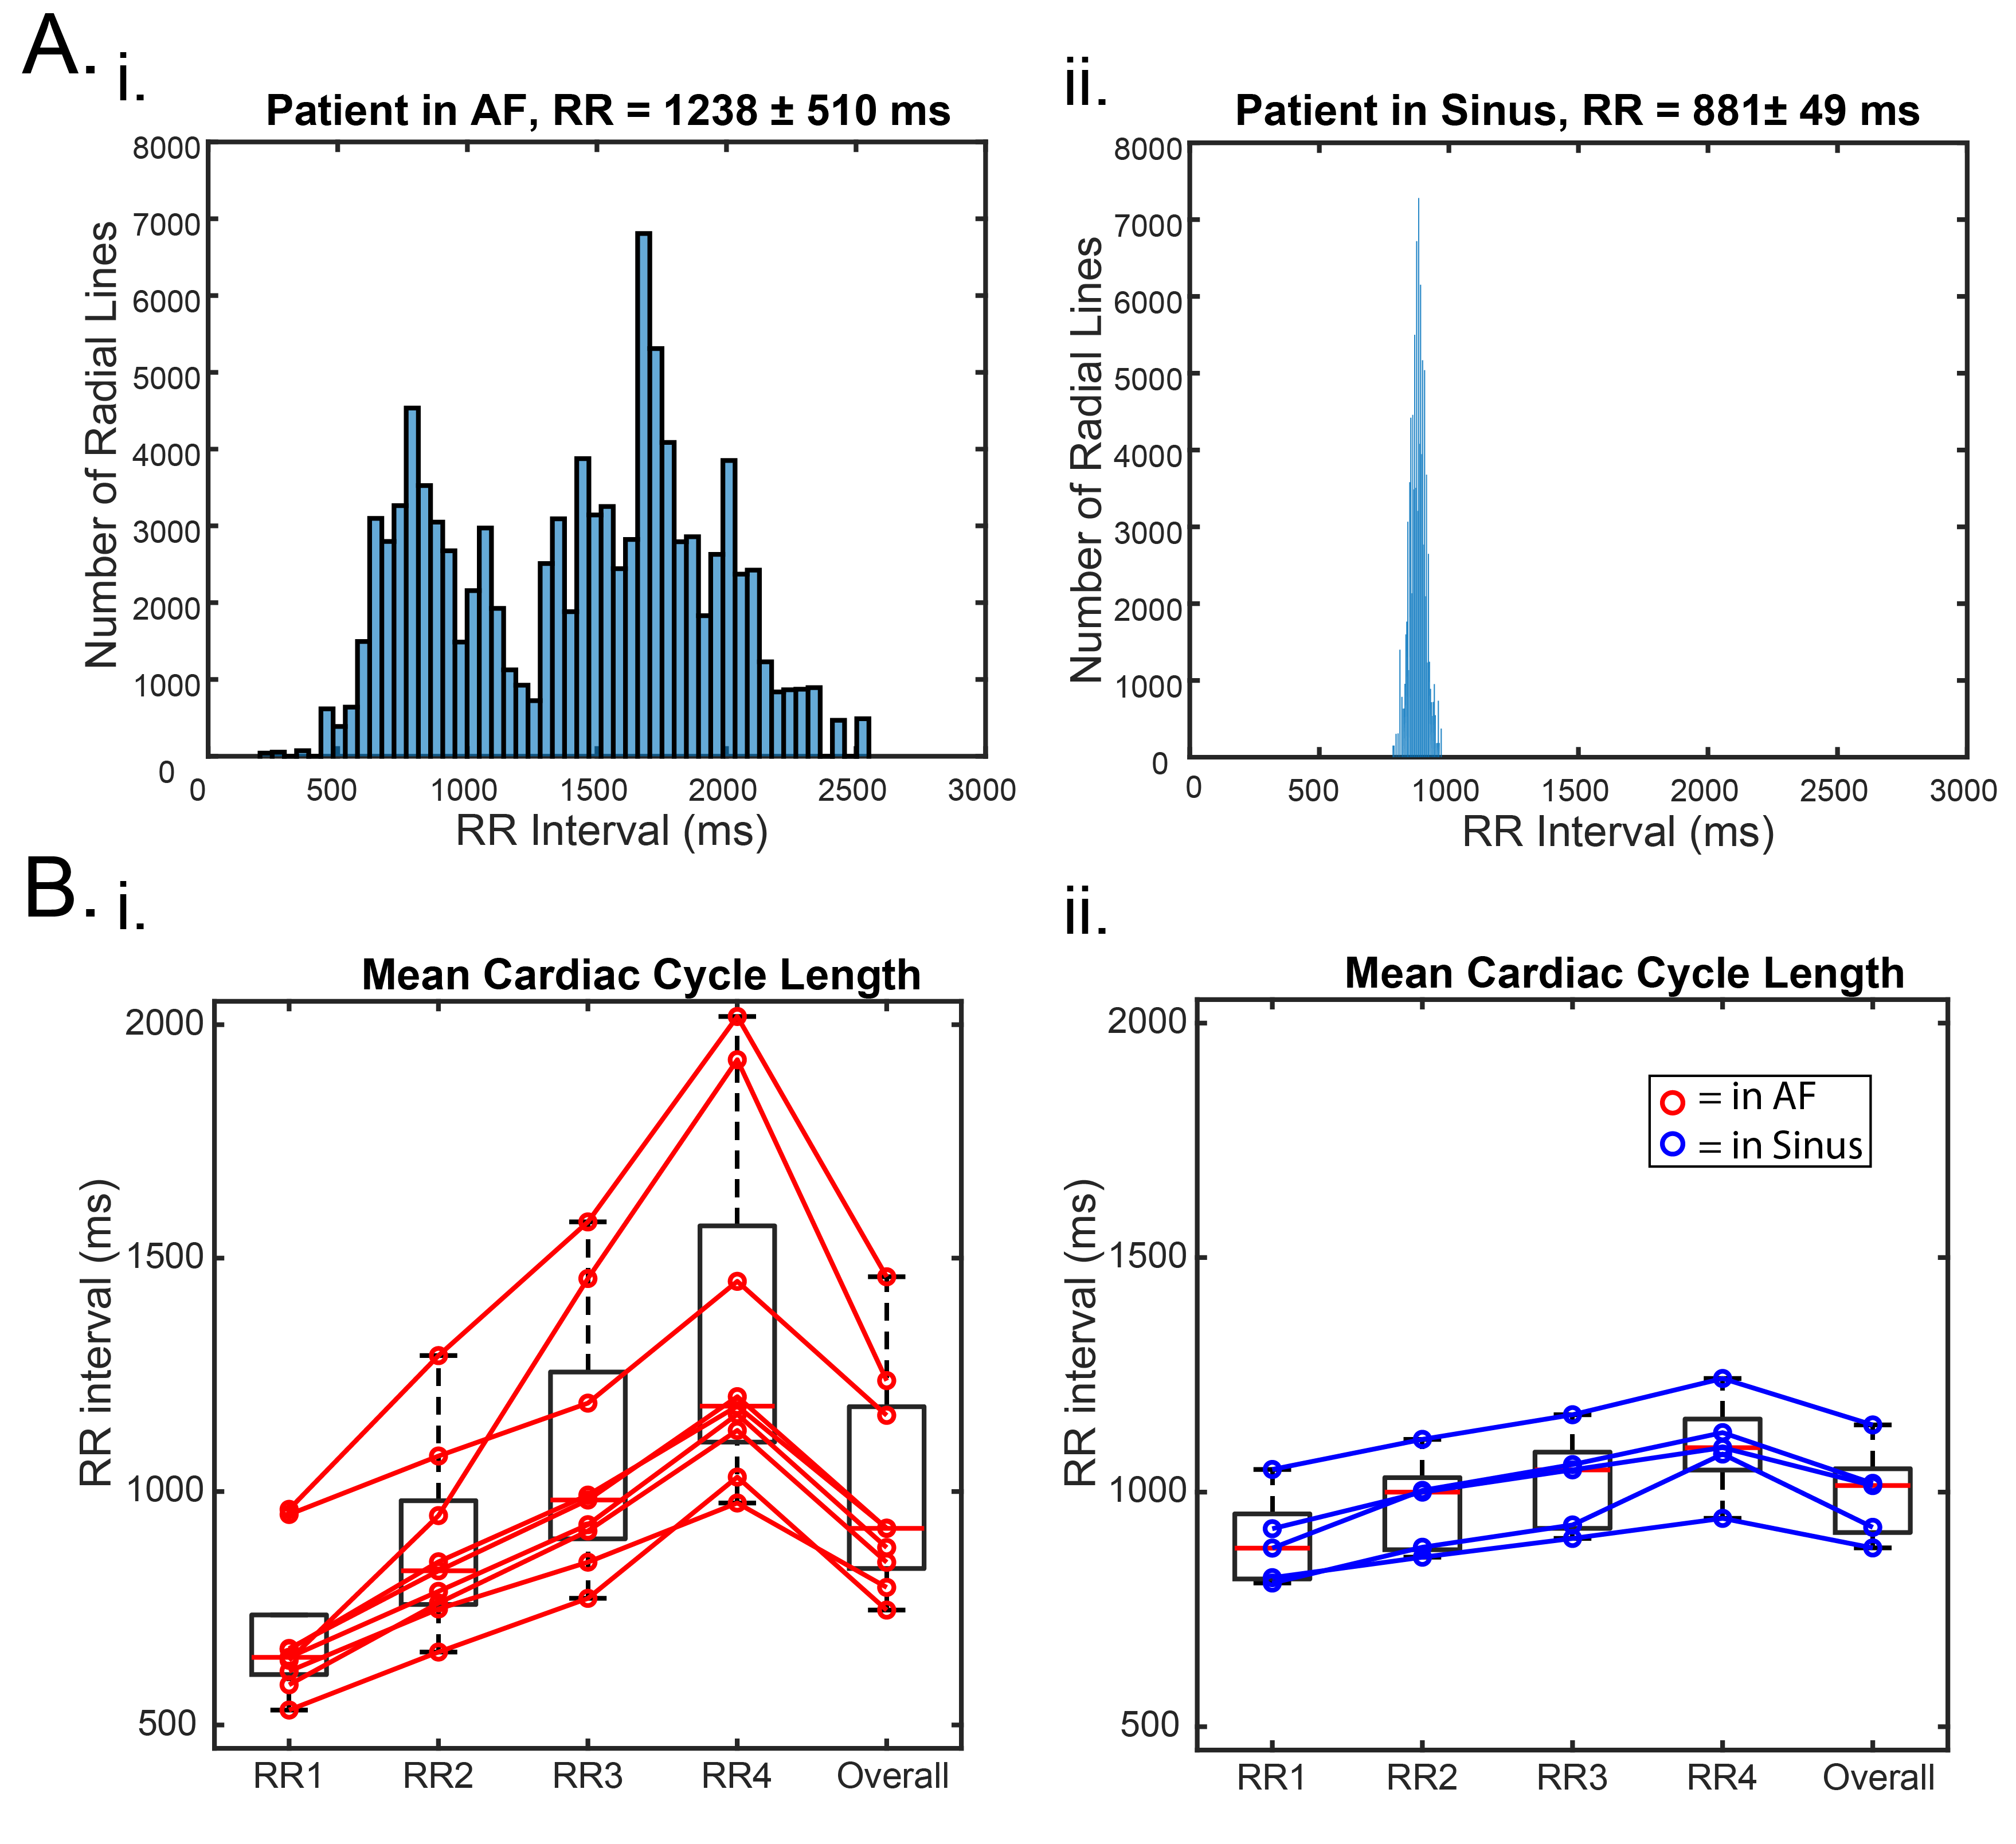
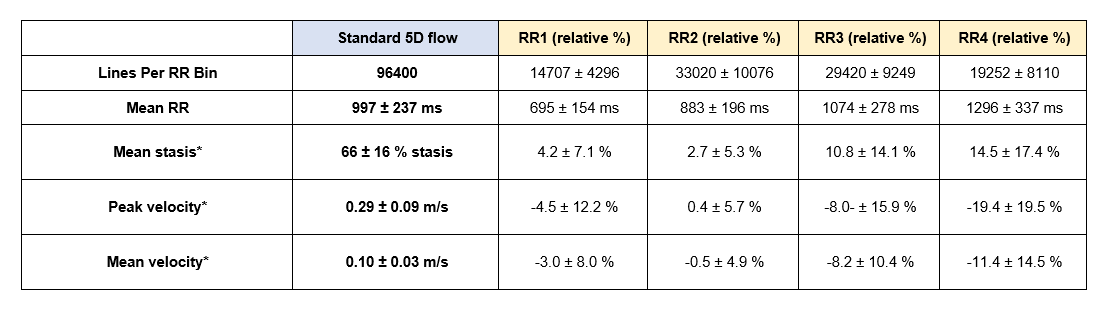
5D flow data were successfully acquired in 7:55-8:48 minutes and reconstructed for all patients. As expected, mean RR-interval of the shortest (RR1) and longest (RR4) bins were much closer in sinus than AF patients (RR4 was 15-28% [sinus] vs. 81-201% [AF] longer than RR1, Figure 2). Mean stasis was significantly higher in RR4 in AF compared to sinus patients (RR4: 78%±13% vs. sinus: 59%±10%, p=0.01, Figure 3). PV and mean velocity were significantly lower in RR4 in AF patients (PV: RR4=0.20±0.05 m/s vs. sinus=0.31±0.05 p=0.007, mean velocity: RR4: 0.07±0.02 m/s vs. sinus=0.10±0.02 m/s p=0.007). Figure 4 demonstrates similar hemodynamics in all RR-resolved bins in an AF patient, but increased stasis and leftward narrowing of the histogram with increasing RR. Table 1 includes data from all AF scans (n=9), and RR2 demonstrates the closest agreement to RR-averaged standard 5D flow reconstruction, while RR3 and RR4 show increasing severity of hemodynamics associated with stroke risk.Discussion and Conclusions
To our knowledge, this is the first study to use RR-binning to investigate the effects of irregular rhythm on 3D hemodynamics. The findings of this study suggest that RR-averaged acquisitions, as used in previous AF studies, provide a good estimate of metrics of hemodynamics in patients with AF, but may be missing some of the potentially thrombogenic hemodynamics (increased stasis, decreased velocities) of long heartbeats. This study was limited by a small sample size and by reconstruction of either the respiratory-resolved or RR-resolved dimension. Future studies will explore higher dimensional reconstructions, larger sample sizes, as well as longitudinal studies to investigate clinical effects of irregular heartbeats in AF.Acknowledgements
Grant support by NIHLBI R01HL115828, NIHLBI F30HL137279, SNF 320030-173129References
1. Markl M, Lee DC, Ng J, Carr M, Carr J and Goldberger JJ. Left Atrial 4D Flow MRI: Stasis and Velocity Mapping in Patients with Atrial Fibrillation. Investigative radiology. 2016;51:147.
2. Di Sopra L, Piccini D, Coppo S, Stuber M and Yerly J. An automated approach to fully self‐gated free‐running cardiac and respiratory motion‐resolved 5D whole‐heart MRI. Magnetic resonance in medicine. 2019.
3. Ma L, Yerly J, Di Sopra L, Piccini D, Kim D, Stuber M and Markl M. 5D flow MRI: A Free-running, fully self-gated, radial imaging framework for cardiac and respiratory motion-resolved assessment of 3D blood flow dynamics. Proc Intl Soc Mag Reson Med (27) 2019.
4. Piccini D, Littmann A, Nielles‐Vallespin S and Zenge MO. Spiral phyllotaxis: the natural way to construct a 3D radial trajectory in MRI. Magnetic resonance in medicine. 2011;66:1049-1056.
5. Di Sopra L, Piccini D, Coppo S, Stuber M and Yerly J. An automated approach to fully self‐gated free‐running cardiac and respiratory motion‐resolved 5D whole‐heart MRI. Magnetic resonance in medicine. 2019;82:2118-2132.
6. Feng L, Axel L, Chandarana H, Block KT, Sodickson DK and Otazo R. XD‐GRASP: golden‐angle radial MRI with reconstruction of extra motion‐state dimensions using compressed sensing. Magnetic resonance in medicine. 2016;75:775-788.
7. Feng L, Coppo S, Piccini D, Yerly J, Lim RP, Masci PG, Stuber M, Sodickson DK and Otazo R. 5D whole‐heart sparse MRI. Magnetic resonance in medicine. 2018;79:826-838.
8. Markl M, Lee DC, Furiasse N, Carr M, Foucar C, Ng J, Carr J and Goldberger JJ. Left atrial and left atrial appendage 4D blood flow dynamics in atrial fibrillation. Circulation: Cardiovascular Imaging. 2016;9:e004984.
Figures