1084
B1 Inhomogeneity at 3T causes spatially non-reproducible and inaccurate cardiac creatine CEST-contrast in healthy controls1Bioengineering, University of California Berkeley, Berkeley, CA, United States, 2Siemens Healthineers, Concord, CA, United States, 3Siemens Healthineers, Durham, NC, United States
Synopsis
CEST-MRI is an emerging molecular imaging method for non-invasive assessment of cardiomyocyte metabolites. In cardiac CEST-MRI, spatial B1 inhomogeneity across the myocardium significantly reduces the accuracy of measured CEST contrasts. Deviation from the prescribed B1 leads to altered creatine CEST contrast due to both reduced labeling efficiency and heightened magnetization transfer and direct water direct saturation across the heart. The final impact is measurement of falsely and substantially reduced creatine CEST contrast in the healthy heart.
Introduction
Chemical exchange saturation transfer (CEST) MRI is an emerging molecular imaging method for non-invasive assessment of cardiomyocyte metabolites including creatine, and has been used to assess changes in the setting of obesity or myocardial infarction. 1–3 While correction for spatial B0 inhomogeneity is routinely performed in cardiac CEST, the impact of spatially varying B1 fields, which can vary 40% across the left ventricle (LV), 4 is generally overlooked. Importantly, the CEST contrast generated for any metabolite, magnitudes of magnetization transfer (MT) and direct water saturation are a non-linear function of saturation power used during CEST preparation. Subsequently, measured CEST contrasts reflect a combination of underlying substrate concentrations and spatially specific saturation power. In this study, we test the impact of spatial B1 inhomogeneity across the healthy heart upon assessment of creatine CEST and MT contrasts.Methods
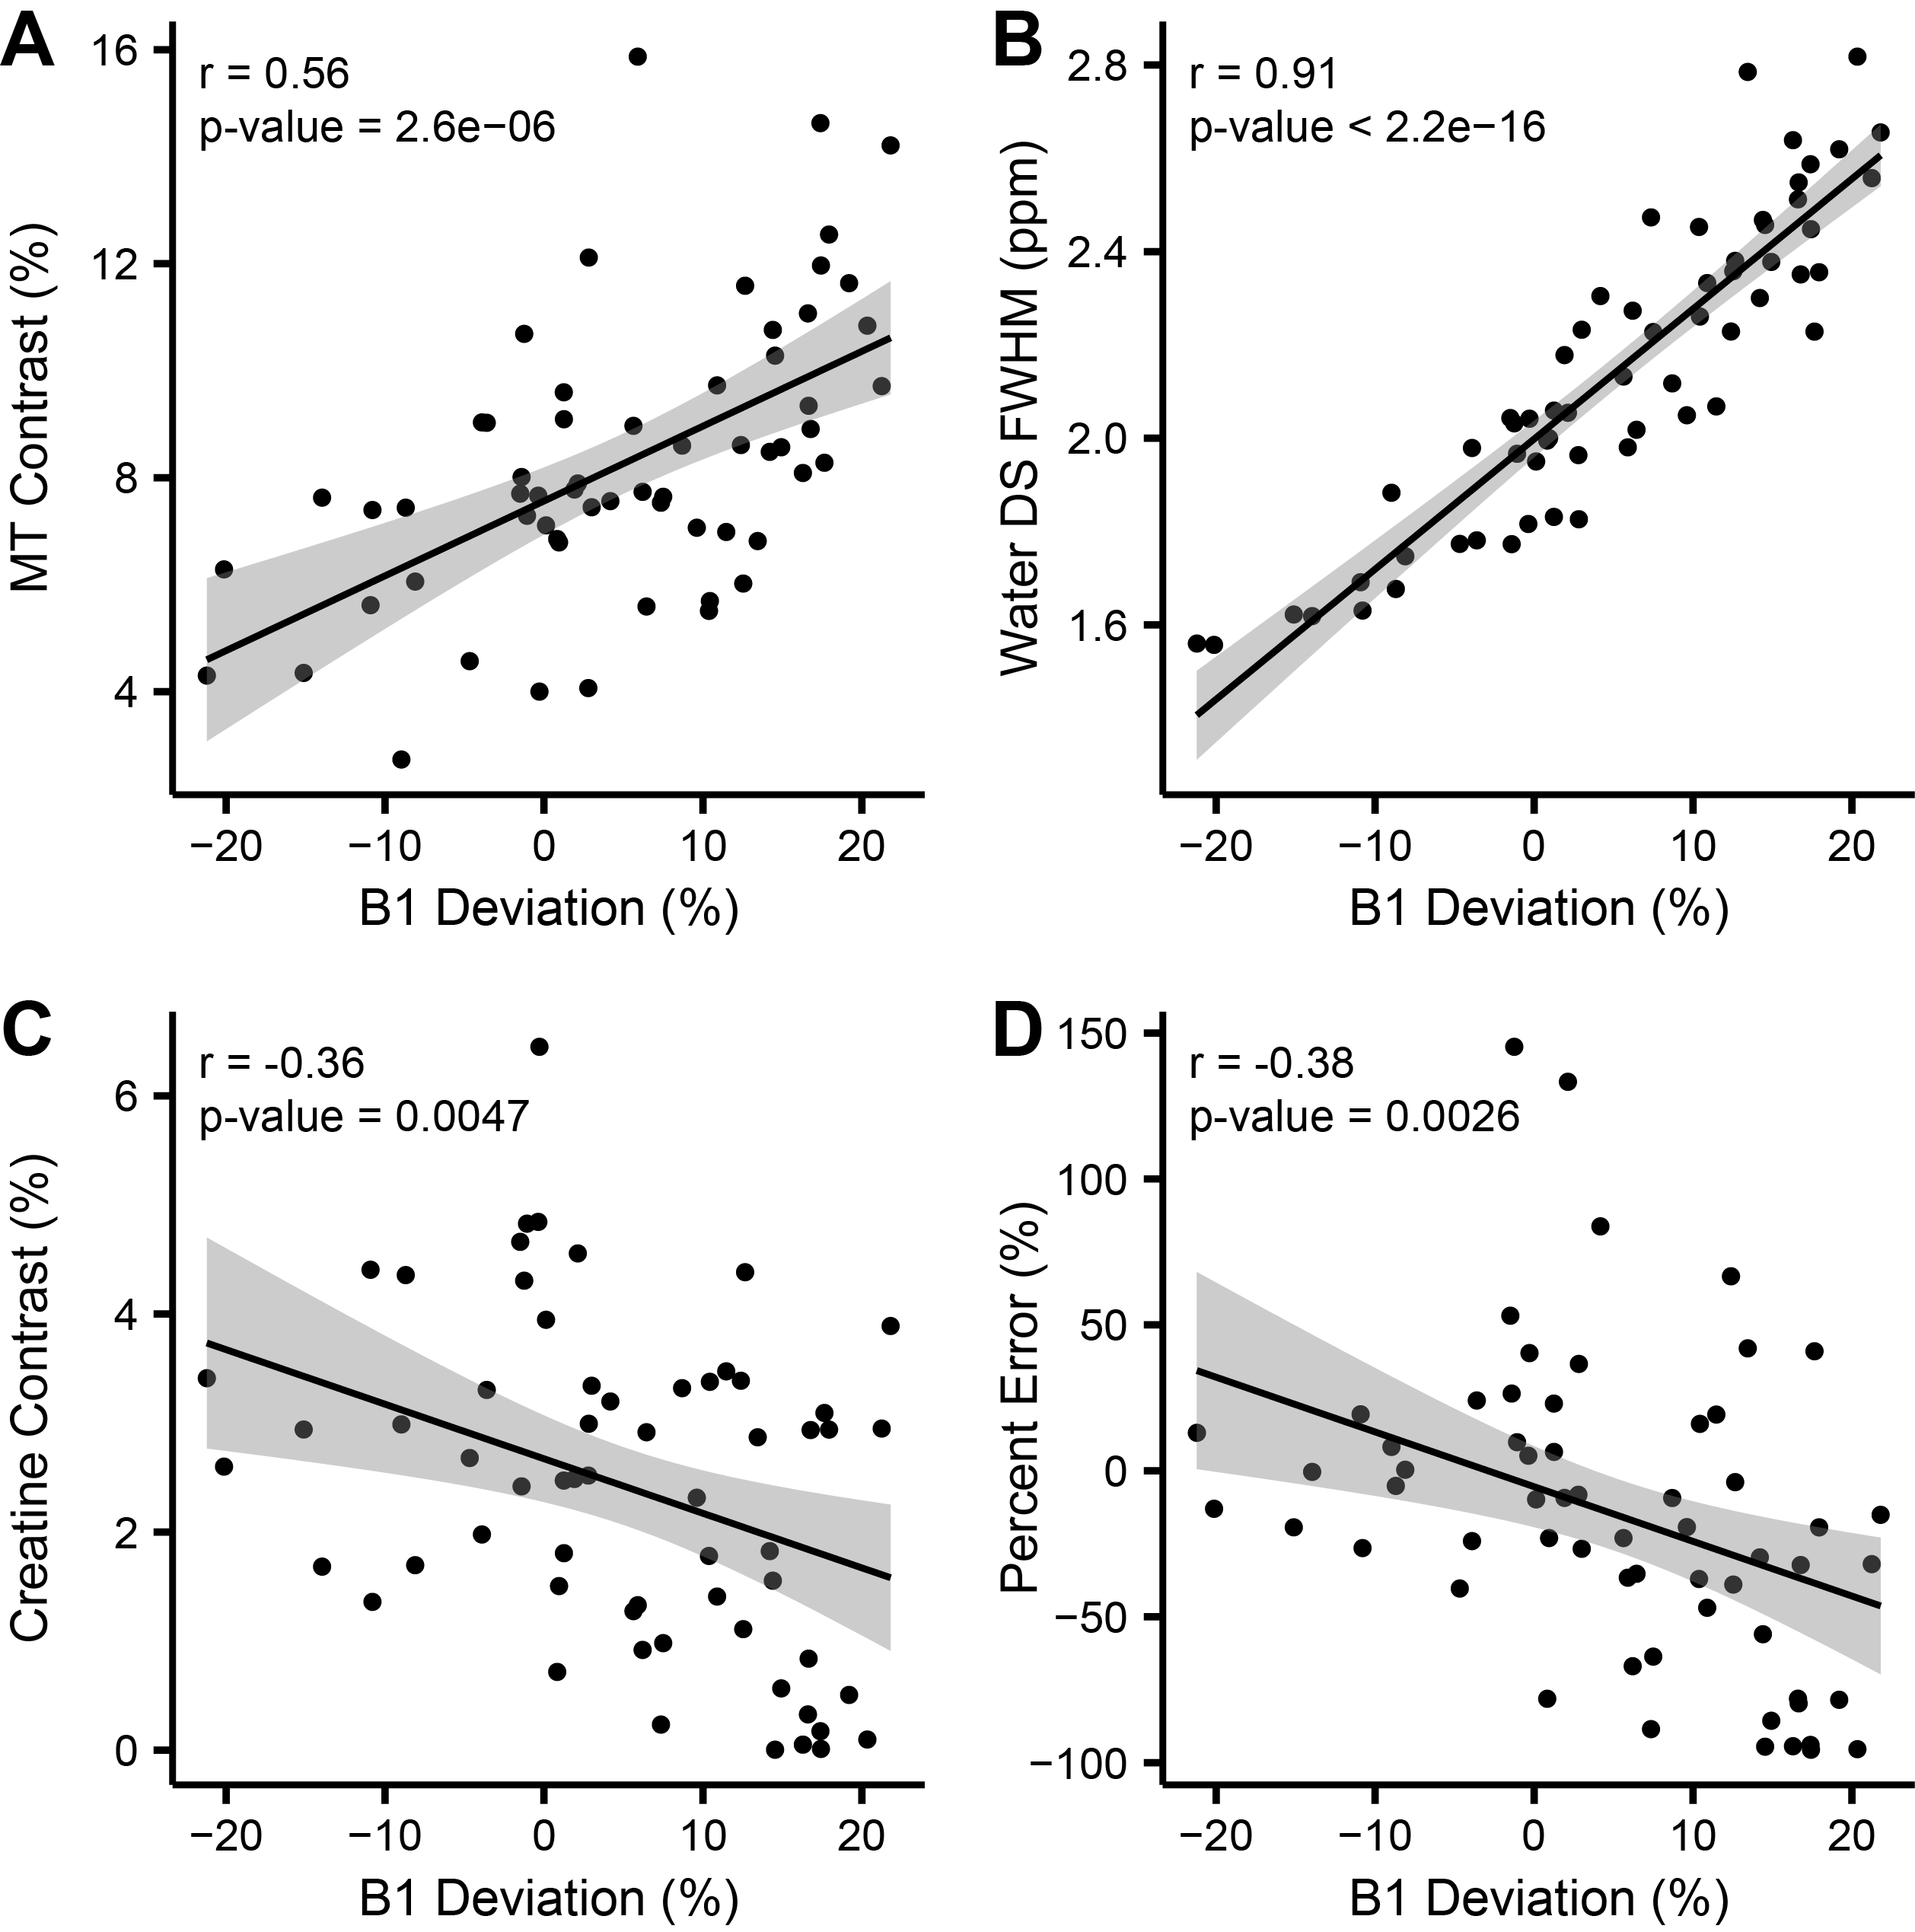
12 healthy volunteers with no history of cardiovascular disease, diabetes, or smoking aged 20–37 were recruited. Cardiac MRI was performed on a 3T Siemens Trio scanner (Siemens Medical Systems, Erlangen, Germany). B0 and B1 field maps were acquired in one midventricular short-axis slice. For CEST imaging, saturation offsets ranged from -10ppm to +10ppm using a 1311ms train of gaussian saturation pulses (pulse duration = 36ms, duty cycle = 0.63, and peak B1 = 1.2µT), followed by a segmented echo planar imaging gradient echo readout (FOV = 300 x 253mm, spatial resolution = 1.56 x 1.56mm, slice thickness = 8mm, TR = 4.7ms, TE = 2.59ms, and FA = 25°) timed to end-diastole. Z-spectra were generated in six anatomical segments of the LV and fit with a multi-pool Lorentzian algorithm 5 to quantify creatine and APT contrasts, nuclear Overhauser effect, MT and direct saturation of water (Figure 1). The goodness of Lorentzian fit was assessed using normalized mean square error (NMSE) of the raw data to the generated Lorentzian fit.6 Segments with noticeable susceptibility artifacts and an NMSE value < 0.998 were excluded from the analysis. In-vitro studies were performed in two phantoms with sub-phantoms containing creatine concentrations of 0 to 30mM dissolved in (a) phosphate buffer solution (PBS) or (b) 10% cross-linked bovine serum albumin (BSA).7 For each participant, ‘true’ creatine concentrations were calculated from the application of septal CEST contrasts to the regression from 10% BSA + creatine phantoms. For each individual, segmental creatine concentrations were calculated from the same regression, and the accuracy determined based on the percent error in each segment compared to each individual’s ‘true’ value.Results
Representative images (Figure 2) and Z-spectra (Figure 1) highlight the impact of B1 inhomogeneity upon CEST/MT contrasts. The average magnitude of spatial B1 variation across the six LV segments was 22.03 ± 8.2%, with consistently higher peak B1 observed in the lateral wall segments (Figure 3). Spatial B1 inhomogeneity resulted in significantly elevated MT and direct water saturation, and significantly reduced creatine CEST contrast in lateral wall segments compared to septal segments (Figure 3). The impact of B1 variation on CEST contrast generated by a fixed creatine concentration can be estimated using a two-pool stimulation (Figure 4). However, measured creatine CEST contrasts are significantly lower in the presence of MT (Figure 4). Significant correlations existed between the magnitude of B1 deviation and all measured CEST contrasts (Figure 5). Similarly, the accuracy of in vivo quantification of creatine content was significantly and inversely correlated with the magnitude of B1 deviation (Figure 5).Discussion
Generation of creatine CEST contrast requires that the correct peak B1 saturation power be spatially consistent across the heart. Spatial B1 inhomogeneity generates inconsistent creatine CEST labeling and further complicates the detection of creatine via increased MT, direct saturation, and spillover from APT labeling. Two-pool simulations demonstrate that a 20% shift in B1 from prescribed amplitude will reduce CEST contrast in the presence of consistent underlying creatine concentration. However, phantom and in vivo data reveal that the combined impact of increased MT and reduced labeling efficiency further abrogate creatine CEST contrast to a level consistent with infarcted tissue despite normal underlying concentrations in the hearts of healthy individuals.Conclusion
These results in this study implies that cardiac CEST-MRI requires both more advanced design of saturation pulses to maximize spatial uniformity, and analysis methods that account for B1 inhomogeneity in quantification of underlying metabolite contrasts.Acknowledgements
No acknowledgement found.References
1. AlGhuraibawi W, Stromp T, Holtkamp R, et al. CEST MRI reveals a correlation between visceral fat mass and reduced myocardial creatine in obese individuals despite preserved ventricular structure and function. NMR Biomed. 2019;32(7):1-10.
2. Haris M, Singh A, Cai K, et al. A technique for in vivo mapping of myocardial creatine kinase metabolism. Nat Med. 2014;20(2):209-214.
3. Zhou Z, Nguyen C, Chen Y, et al. Optimized CEST cardiovascular magnetic resonance for assessment of metabolic activity in the heart. J Cardiovasc Magn Reson. 2017;19(1):95.
4. Sung K, Nayak KS. Measurement and characterization of RF nonuniformity over the heart at 3T using body coil transmission. J Magn Reson Imaging. 2008;27(3):643-648.
5. Deshmane A, Zaiss M, Lindig T, et al. 3D gradient echo snapshot CEST MRI with low power saturation for human studies at 3T. Magn Reson Med. 2019;81(4):2412-2423.
6. Chen L, Barker PB, Weiss RG, van Zijl PCM, Xu J. Creatine and phosphocreatine mapping of mouse skeletal muscle by a polynomial and Lorentzian line-shape fitting CEST method. Magn Reson Med. 2019;81(1):69-78.
7. Xu J, Yadav NN, Bar-Shir A, et al. Variable delay multi-pulse train for fast chemical exchange saturation transfer and relayed-nuclear overhauser enhancement MRI. Magn Reson Med. 2014;71(5):1798-1812.
Figures