1081
MR Multitasking based Multi-dimensional Assessment of Cardiovascular System (MT-MACS) Technique: Feasibility on the Thoracic Aorta1Biomedical Imaging Research Institute, Cedars-Sinai Medical Center, Los Angeles, CA, United States, 2Bioengineering Department, University of California, Los Angeles, Los Angeles, CA, United States, 3Department of Neurology, Cedars-Sinai Medical Center, Los Angeles, CA, United States, 4Department of Imaging, Cedars-Sinai Medical Center, Los Angeles, CA, United States, 5Department of Rheumatology, Cedars-Sinai Medical Center, Los Angeles, CA, United States, 6Siemens Healthineers, Los Angeles, CA, United States, 7Department of Medicine, University of California, Los Angeles, Los Angeles, CA, United States
Synopsis
Thoracic aortic diseases are one of the most common causes of cardiovascular morbidity and mortality, where imaging plays a central role in diagnosis. As a noninvasive technique, MR imaging has the potential to provide a comprehensive evaluation of the thoracic aorta from various aspects. However, clinical adoption of this modality is hindered by several limitations, i.e. long scan time and cumbersome setup for accommodating motion during data acquisition. In this work, we present an MR MultiTasking based 3D Multi-dimensional Assessment of Cardiovascular System (MT-MACS) technique that allows for ECG- and navigator-free thoracic aortic imaging within 6 minutes.
Introduction
Thoracic aortic diseases are one of the most common causes of cardiovascular morbidity and mortality1. Unfortunately, unless complications occur, patients with aortic diseases usually have no signs or symptoms and are unaware of the pathological changes in their aortas2. Thus, diagnosis and follow-up of aortic abnormalities depend exclusively on diagnostic imaging3. As a noninvasive technique, MR imaging has the potential to provide a comprehensive evaluation of the thoracic aorta from various aspects, such as bright-blood imaging for luminal stenosis detection4, dark-blood or gray-blood imaging for vessel wall assessment5 and cine imaging for detecting abnormal strain. However, clinical adoption of the modality is hindered by several limitations including long scan time for achieving large spatial coverage and high spatial resolution, nontrivial imaging setup for addressing cardiac and respiratory motion during data acquisition, and a lengthy imaging protocol to incorporate multiple scans. In this work, we propose an MR MultiTasking based 3D Multi-dimensional Assessment of Cardiovascular System (MT-MACS) technique that allows for ECG- and navigator-free thoracic aortic imaging within 6 minutes.Methods
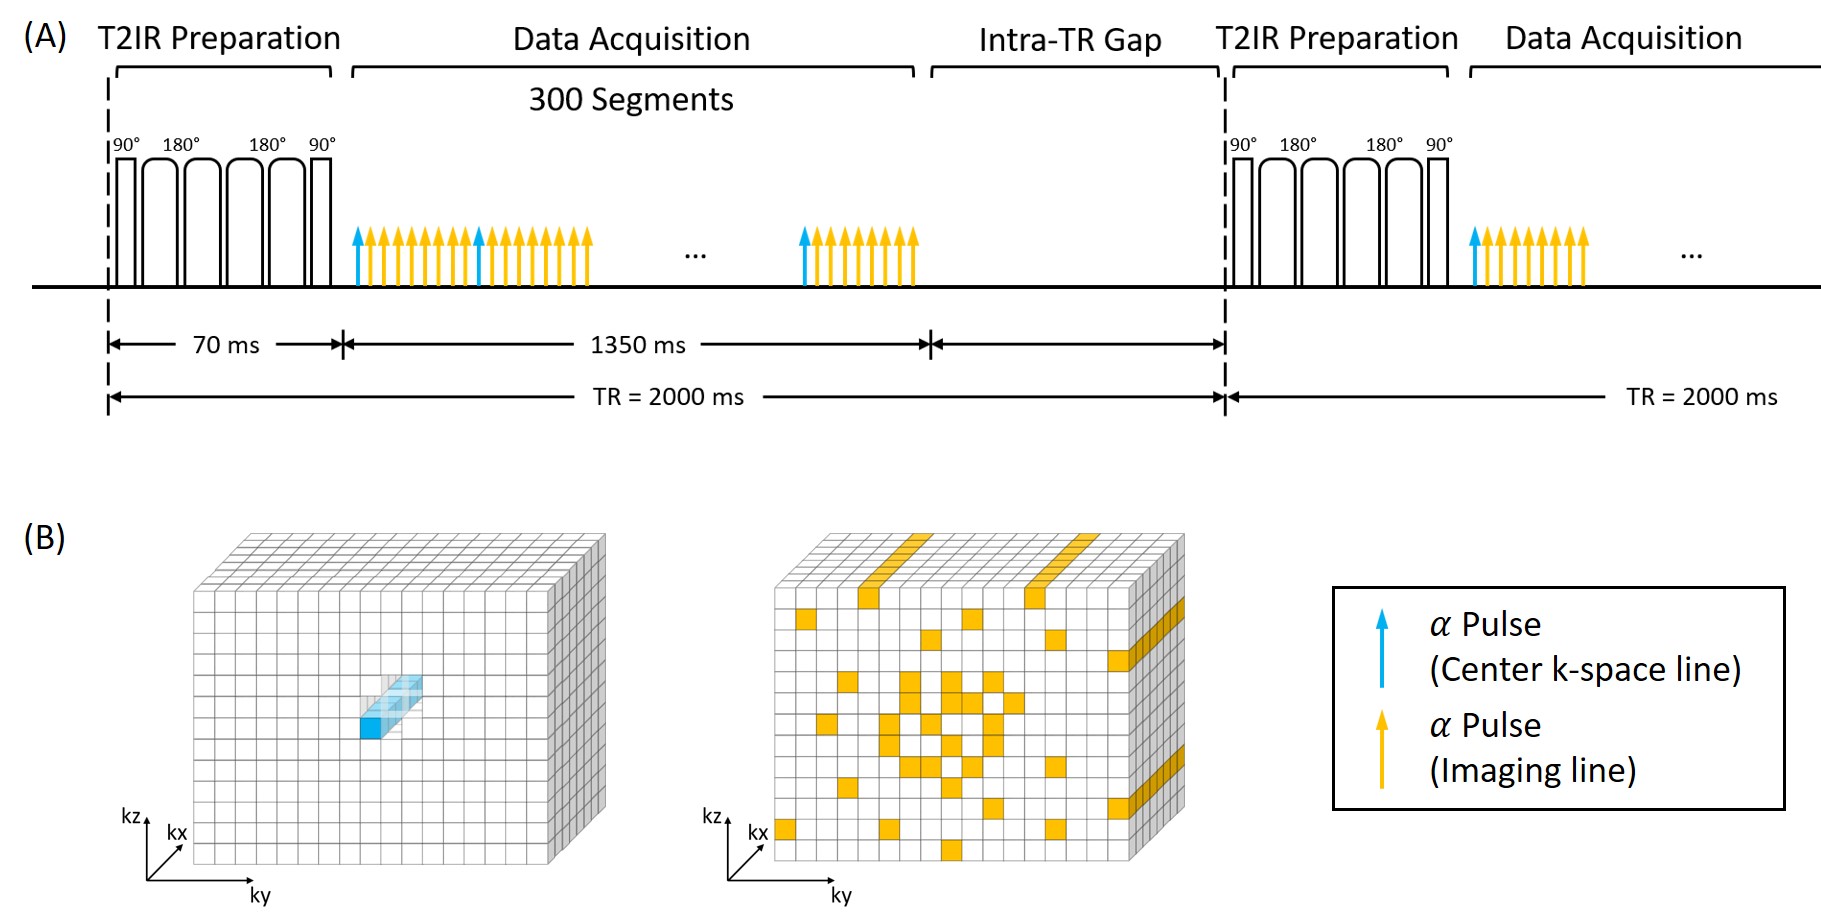
Imaging Model and Pulse Sequence DesignThe proposed MT-MACS method used a low-rank tensor (LRT) imaging model6 with a cardiac time dimension for phase-resolved cine imaging, a respiratory time dimension for free-breathing imaging, and a T1 recovery dimension for multi-contrast assessment. The model represents aortic images as $$$U{\Phi}$$$, where the temporal basis functions $$${\Phi}$$$ are first determined from auxiliary data (center k-space lines), and where the spatial coefficients $$$U$$$ are recovered by fitting $$${\Phi}$$$ to imaging data acquired with Gaussian-distributed randomized Cartesian undersampling. The sequence was implemented based on a continuous FLASH acquisition combined intermittently with a T2-IR magnetization preparation (Figure 1), which was used to (a) increase the contrast between the vessel wall and blood, and (b) create multiple image contrasts.
Simulation
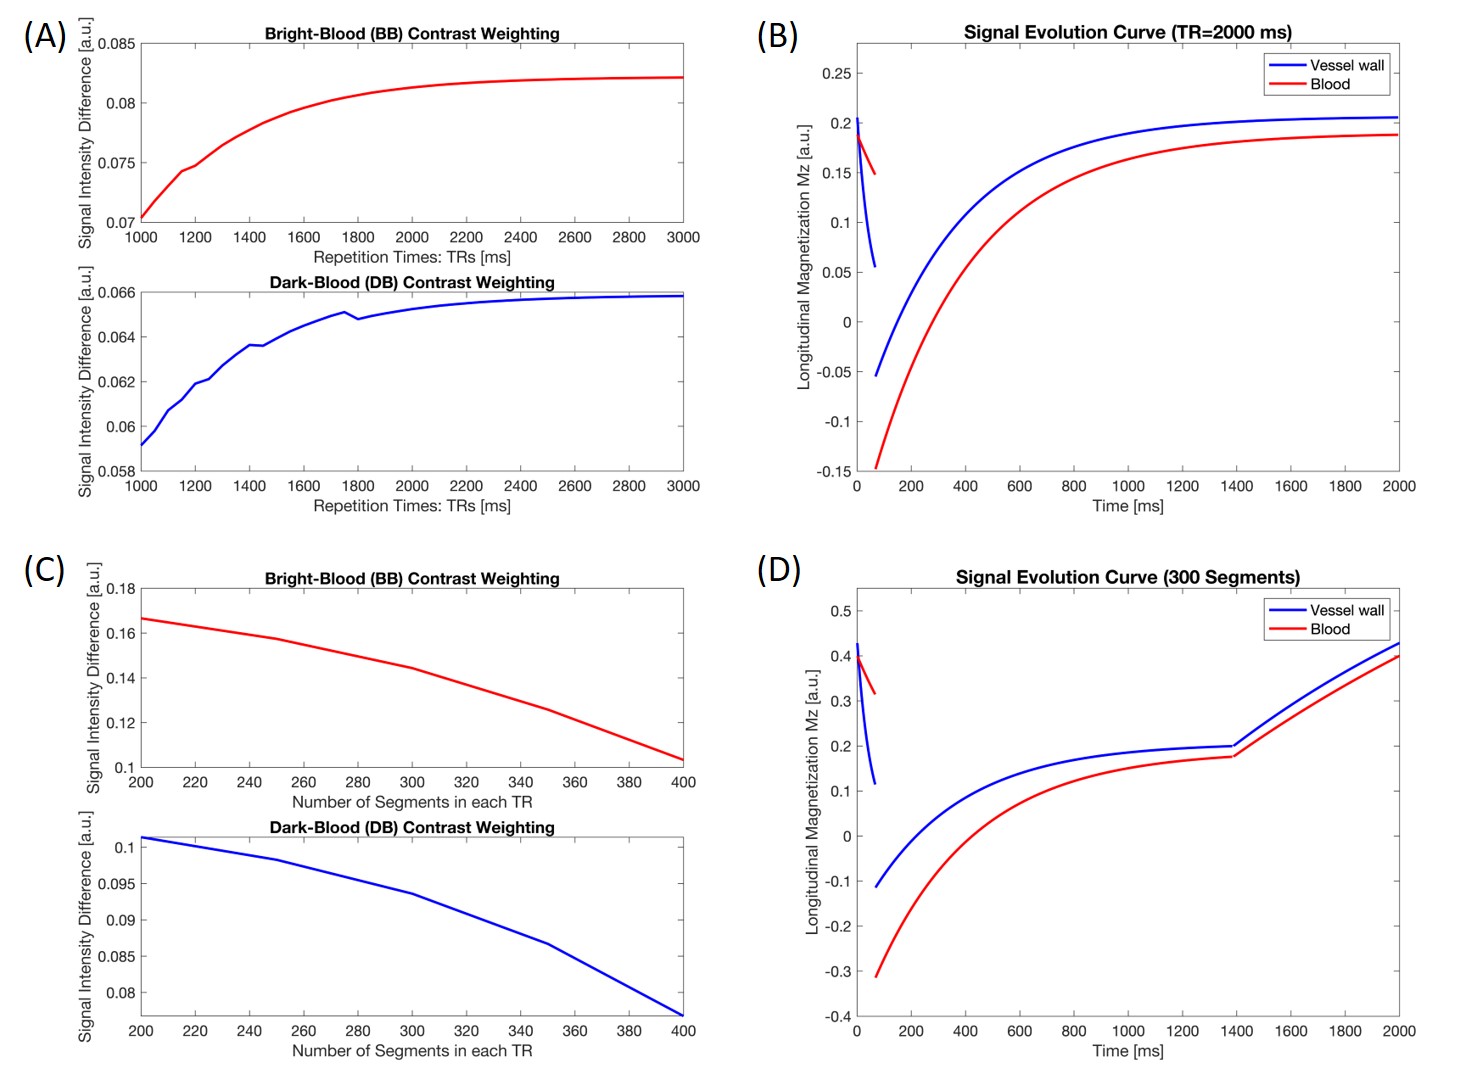
To maximize the lumen-wall contrast, a simulation study was performed to optimize two parameters: (a) repetition time (TR), which is the time interval between two consecutive T2-IR preparation pulses; (b) the number of readout segments continuously acquired during each TR. Based on the curve of lumen-wall contrast as a function of TR (Figure 2A), a 2000-ms TR was empirically chosen (Figure 2B) as a compromise between achievable lumen-wall contrast and scan efficiency. With the TR fixed, Figure 2C illustrates the lumen-wall contrast as a function of the number of segments in each TR. Based on simulations and several pilot in-vivo experiments, we used 300 readout segments (approximately 1400 ms) followed by a gap during the remaining 600-ms in each TR (Figure 2D). The relevant imaging parameters used in simulations were: flip angle = 8°, echo spacing = 4.5 ms, duration of T2-IR preparation module = 60 ms.
In vivo study
12 healthy subjects (aged 18-63 years, 7 female) and 5 patients (aged 38-74 years, 3 female) with thoracic aortic diseases were recruited for the study. All imaging studies were performed on a 3T MR scanner (MAGNETOM Skyra; Siemens Healthineers, Erlangen, Germany) with a standard 18-channel body coil. Major imaging parameters included: FOV 275×220×72 mm, spatial resolution 1.38 mm isotropic, scan time fixed at 10 min with the goal of truncating data retrospectively for scan time optimization. Multidimensional aortic images were reconstructed offline to generate the bright-blood (BB), dark-blood (DB) and gray-blood (GB) phases as well as cine series. Qualitative (image quality score 0-3) and quantitative (CNR between lumen and wall, lumen and wall area, aortic strain) analysis were performed in all healthy subjects.
Results
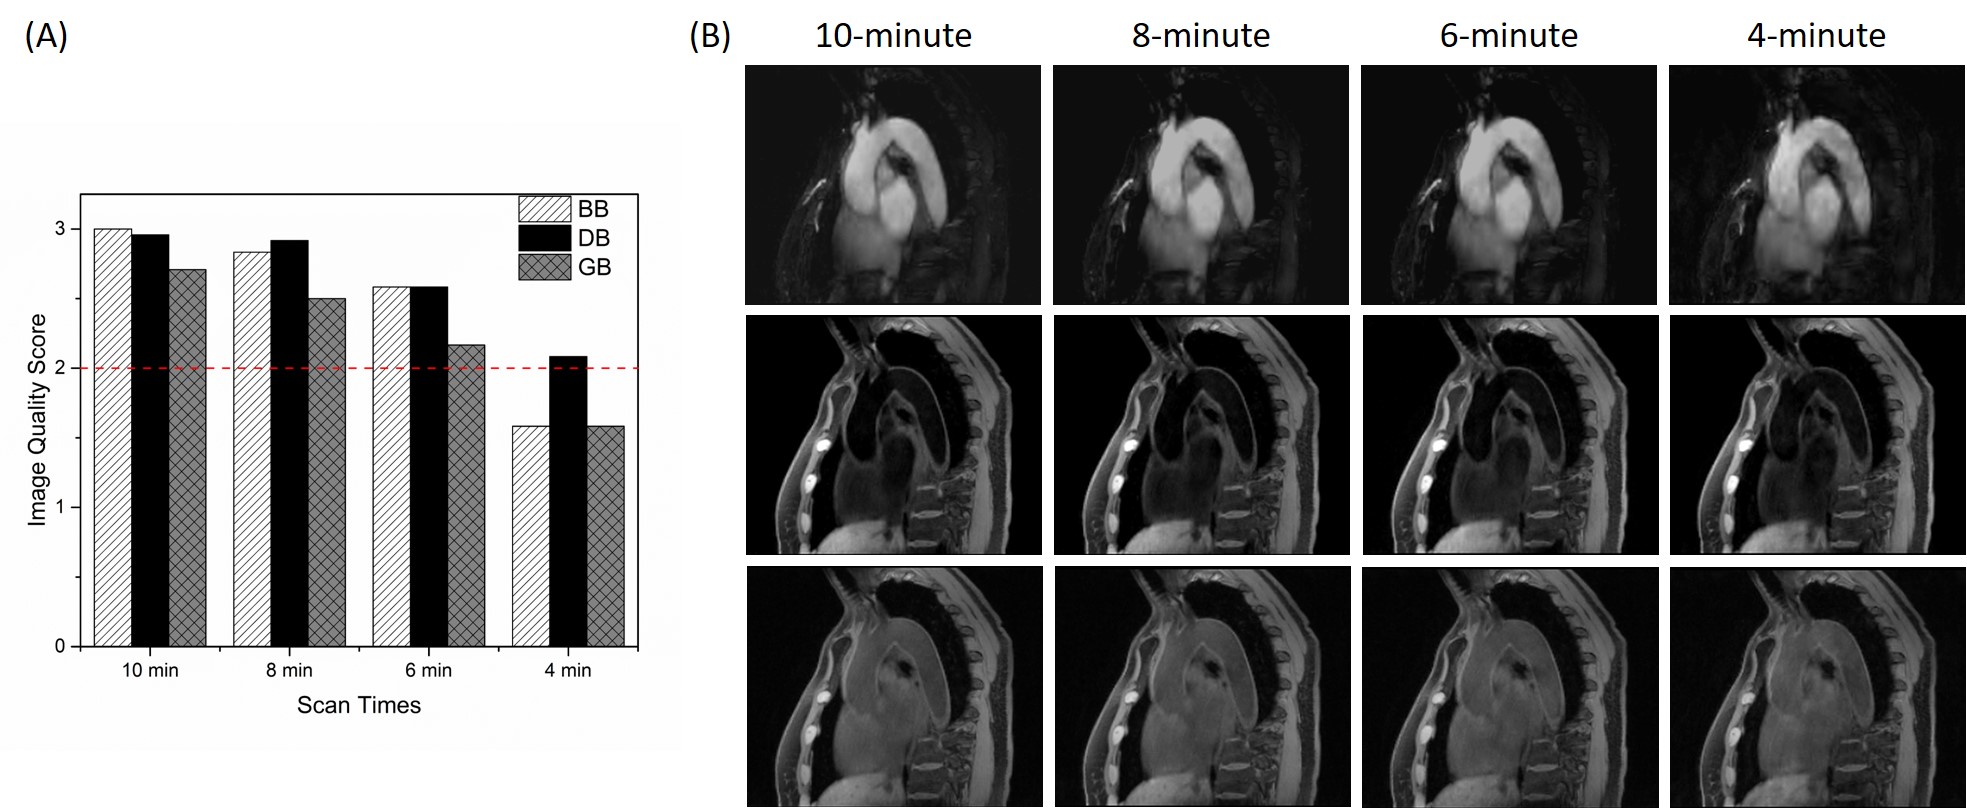
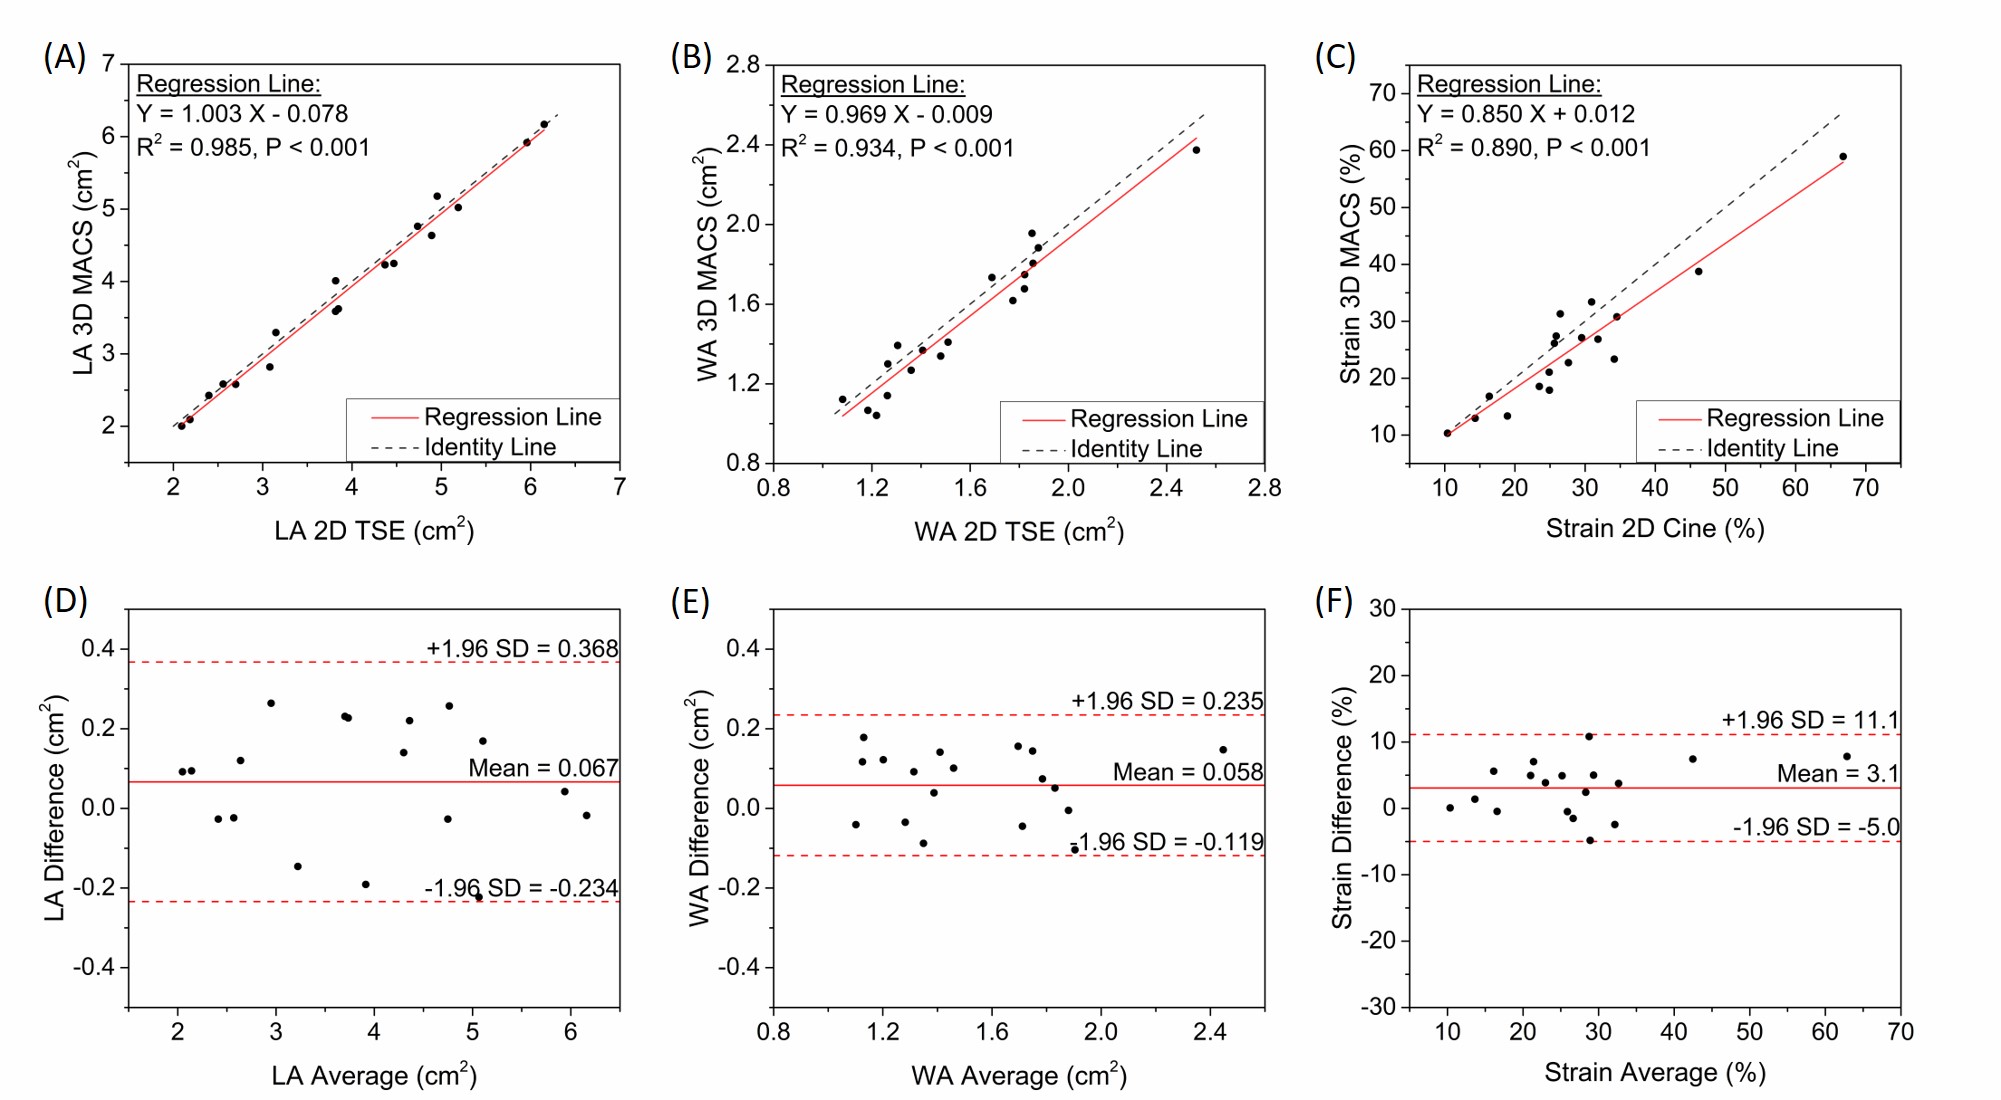
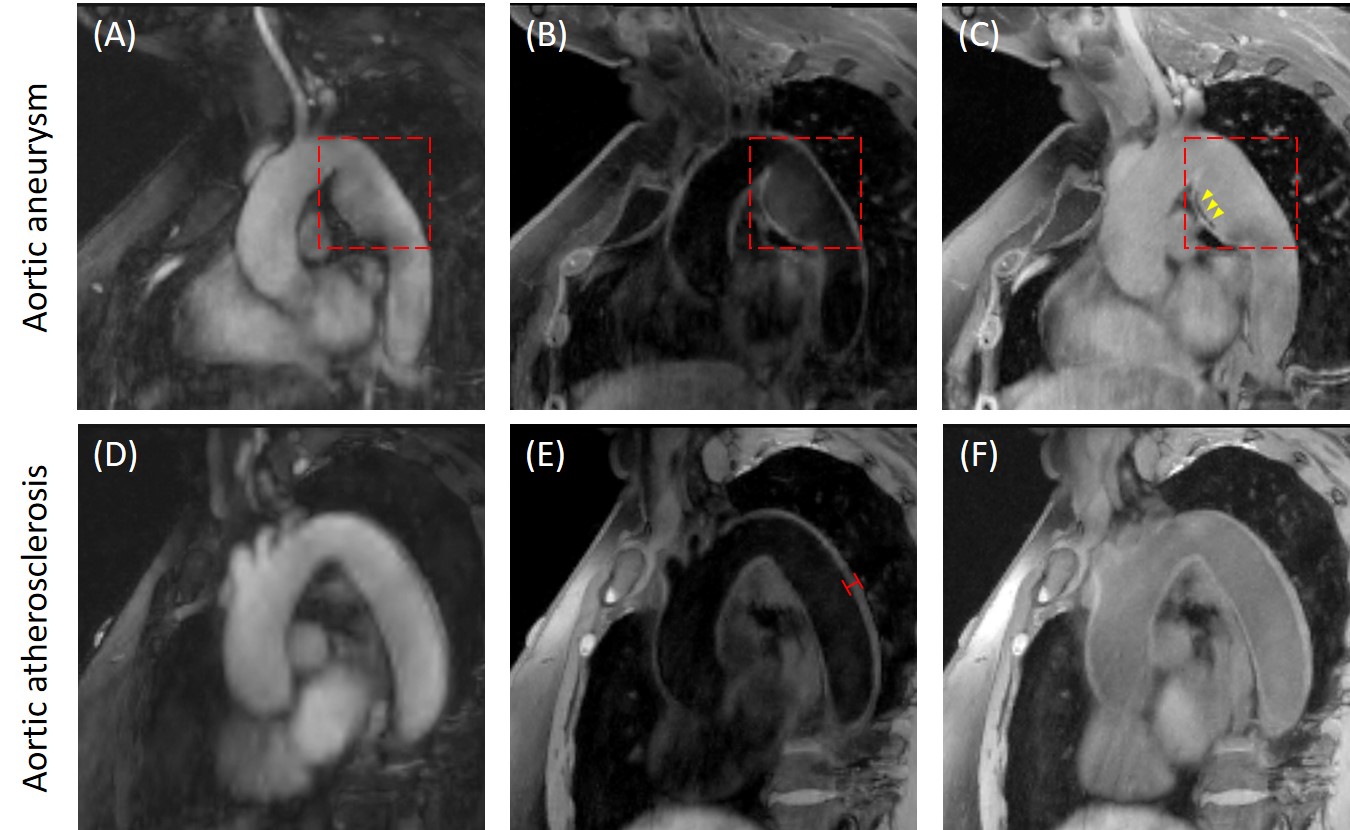
MT-MACS images reconstructed with as short as 6-minute acquisition demonstrated good or excellent image quality in all three contrast weightings: BB (2.58±0.46), DB (2.58±0.50) and GB (2.17±0.53) contrasts, respectively (Figure 3). Thus, the 6-minute image sets were chosen for the following quantitative analysis. The CNR measurements for BB, DB and GB contrast weightings are 49.2±12.8, 20.0±5.8, and 2.8±1.8, respectively, which are in line with the values published in literatures (7-9). Figure 4 shows good agreement in the measurement for several morphological parameters, including the lumen and wall area and aortic strain, between MT-MACS and conventional 2D sequences (2D bSSFP and 2D TSE). Typical 6-min MT-MACS from patients with aortic aneurysm and atherosclerosis are displayed in Figure 5.Discussion
MT-MACS can achieve high spatial resolution with complete thoracic aorta coverage, and more importantly, provide a comprehensive assessment of the thoracic aorta with ECG- and navigator-free, all within a single 6-minute scan. Specifically, by adopting MR multitasking framework, the aortocardiac image is modeled as a low-rank multidimensional array, which contains a cardiac pulsation and an inversion recovery time dimension for aortic functional phase-resolved cardiac imaging and morphological multi-contrast assessment, respectively. Furthermore, by performing continuous data acquisition instead of conventional motion-removal strategies, MT-MACS eliminates the need for ECG triggering, respiratory navigators or breath-holds, which can greatly simplify the acquisition workflow and potentially improve interpretation accuracy.Conclusion
We presented an MR MultiTasking based ECG- and navigator-free 3D Multi-dimensional Assessment of Cardiovascular System (MT-MACS) technique and demonstrate its feasibility on the thoracic aorta. Further clinical validations in various thoracic aortic diseases are underway.Acknowledgements
No acknowledgement found.References
1. Stanger O, Pepper JR. Surgical Management of Aortic Pathology: Current Fundamentals for the Clinical Management of Aortic Disease: Springer; 2018.
2. Loebe M, Ren D, Rodriguez L, La Francesca S, Bismuth J, Lumsden A. Acute and chronic thoracic aortic disease: surgical considerations. HSR proceedings in intensive care & cardiovascular anesthesia 2012;4(4):243.
3. Dudzinski DM, Isselbacher EM. Diagnosis and management of thoracic aortic disease. Current cardiology reports 2015;17(12):106.
4. Krishnam MS, Tomasian A, Malik S, Desphande V, Laub G, Ruehm SG. Image quality and diagnostic accuracy of unenhanced SSFP MR angiography compared with conventional contrast-enhanced MR angiography for the assessment of thoracic aortic diseases. European radiology 2010;20(6):1311-1320.
5. Wehrum T, Dragonu I, Strecker C, Hennig J, Harloff A. Multi-contrast and three-dimensional assessment of the aortic wall using 3 T MRI. European journal of radiology 2017;91:148-154.
6. Christodoulou AG, Shaw JL, Nguyen C, Yang Q, Xie Y, Wang N, Li D. Magnetic resonance multitasking for motion-resolved quantitative cardiovascular imaging. Nature biomedical engineering 2018;2(4):215.
7. Roes SD, Westenberg JJ, Doornbos J, Van Der Geest RJ, Angelié E, De Roos A, Stuber M. Aortic vessel wall magnetic resonance imaging at 3.0 Tesla: A reproducibility study of respiratory navigator gated free‐breathing 3D black blood magnetic resonance imaging. Magnetic Resonance in Medicine: An Official Journal of the International Society for Magnetic Resonance in Medicine 2009;61(1):35-44.
8. Amano Y, Takahama K, Kumita S. Non–contrast‐enhanced MR angiography of the thoracic aorta using cardiac and navigator‐gated magnetization‐prepared three‐dimensional steady‐state free precession. Journal of Magnetic Resonance Imaging: An Official Journal of the International Society for Magnetic Resonance in Medicine 2008;27(3):504-509.
9. Koktzoglou I. Gray blood magnetic resonance for carotid wall imaging and visualization of deep‐seated and superficial vascular calcifications. Magnetic resonance in medicine 2013;70(1):75-85.
Figures