1079
Three Dimensional Vortex Identification and Characterization in Small Intracranial Aneurysms based on Sub-millimetric 4D Flow MRI at 7 Tesla1Center for Magnetic Resonance Research, University of Minnesota, Minneapolis, MN, United States, 2Department of Neurosurgery, University of Minnesota, Minneapolis, MN, United States, 3Department of Radiology, University of Minnesota, Minneapolis, MN, United States, 4Department of Neurology, University of Minnesota, Minneapolis, MN, United States
Synopsis
Asymptomatic small intracranial aneurysms affect about 1 in 50 people and are often considered at a low risk of rupture. There are no effective hemodynamic parameters accurately predicting the evolution of small aneurysms. Three dimensional vortex motion is observed in aneurysms which reflects the hemodynamic environment and potentially impact the development of small aneurysms. We propose an approach to describe the three dimensional main vortex motion as a whole inside small aneurysms based on 4D Flow MRI at 7 Tesla. This approach defines the high vortex motion region and gives the direction of the main vortex motion and its center.
Introduction
There is little data to inform physicians about the risk of growth and spontaneous rupture of small (<7mm) intracranial aneurysms (IAs), more effort is needed to be put into exploration to propose an effective biomarker that could predict the evolution and possible rupture risk associated with small aneurysms. One of the factors involved in the lack of usable metrics to predict IA growth or rupture may lie in the nature of the parameters derived from MRV data. When we investigated the spatial stationarity in velocity streamlines1, we noticed that in each of the small IAs the stationary pattern included a clearly visible vortex. Spatial stationarity in the 3D rotational flow pattern may have relevant implications on the physiopathology of aneurysm development, thus it is desirable to have a robust characterization method. Multiple metrics have been proposed to quantify vortices in fluid dynamics. However, majority of these are in CFD simulations2, involving turbulence at a scale too small for MRV detection. Also, in most cases vortical metrics are calculated either within an axial plane arbitrarily chosen in the 3D vortex, which implies some dependence on user’s intervention or for each 3D spatial point that only reflects the local rotational strength. We observed in our 4D Flow MRI patients’ data that the overall 3D vortex pattern was always organized around a dominant rotational axis, and here we introduce an approach that not depends on the arbitrary choice of a 2D plane by user to account for the 3D vortex structure as a whole with determining the main axis of its rotation and its rotation center.Methods
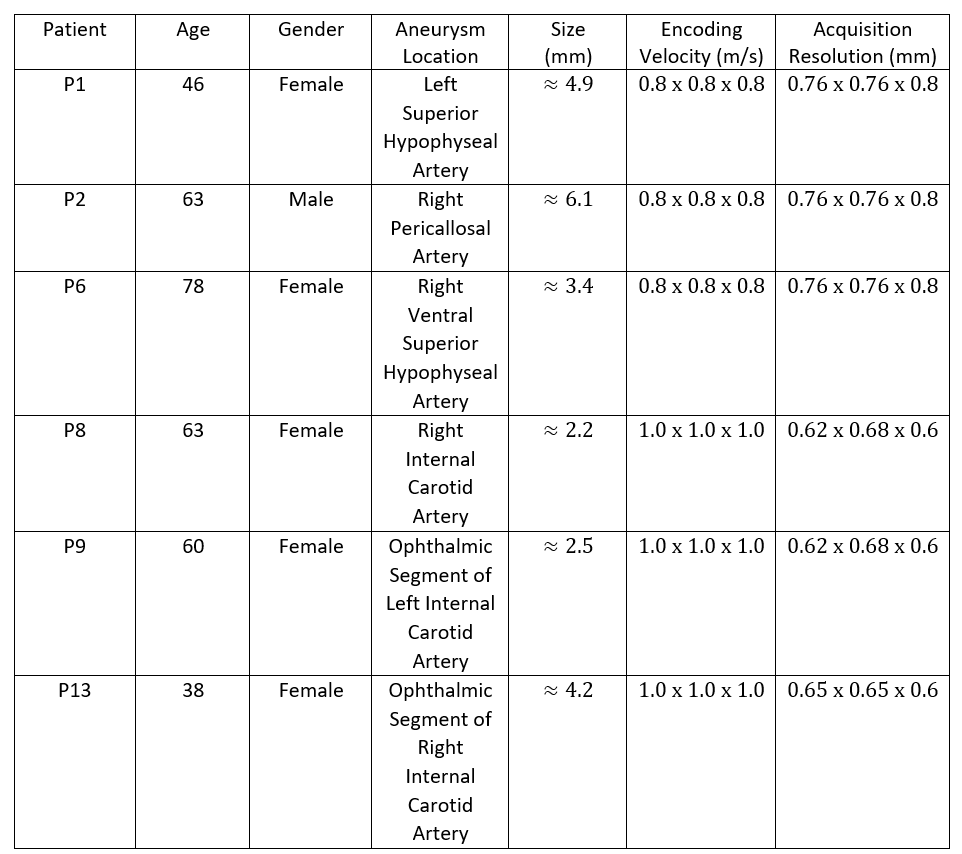
4D Flow MRI3 velocity vector data from 6 subjects obtained at 7 Tesla (Siemens, Erlangen, Germany) (Figure 1) were averaged over all cardiac phases individually to generate the cycle-averaged stationary velocity vector with increasing SNR, which were used to apply our vortex identification approach. Figure 2 shows the stationary streamlines pattern and explicit vortex structure of 6 subjects. The computations were conducted in Python and MatlabTM, while the visualization was realized in TecplotTM. We extended the previously proposed scalar $$$\Gamma_{2}$$$4 that only identifies the rotational motion in a two dimensional plane to the vector $$$\overrightarrow{\Gamma_{2}}$$$ that works for a three dimensional flow field.Method1: $$$\overrightarrow{\Gamma_{2}}$$$ identifies the region dominated by the rotational flow over the shear flow.
Method2: $$$\Omega$$$ and $$$\overrightarrow{\omega}$$$ capture the region where the vorticity overtakes the deformation5.
Approach: $$$\overrightarrow{\Gamma_{2}}$$$ and $$$\Omega$$$ were respectively computed for each spatial point in the blood flow domain defined by the aneurysm mask. The values of the magnitude of $$$\overrightarrow{\Gamma_{2}}$$$ or $$$\Omega$$$ (over a threshold) were used to define a high vortex motion region with the region growing. The spatial average of these identification vectors over the defined high vortex motion region were used to yield two vector candidates to define the main vortex motion direction. $$$\overrightarrow{\Gamma_{1}}$$$ is a vortex center identification method that we separately apply based on each of the two previously obtained averaged vortex motion directions. The resulting main vortex motion center was then assigned the corresponding averaged vortex identification vectors.
Results
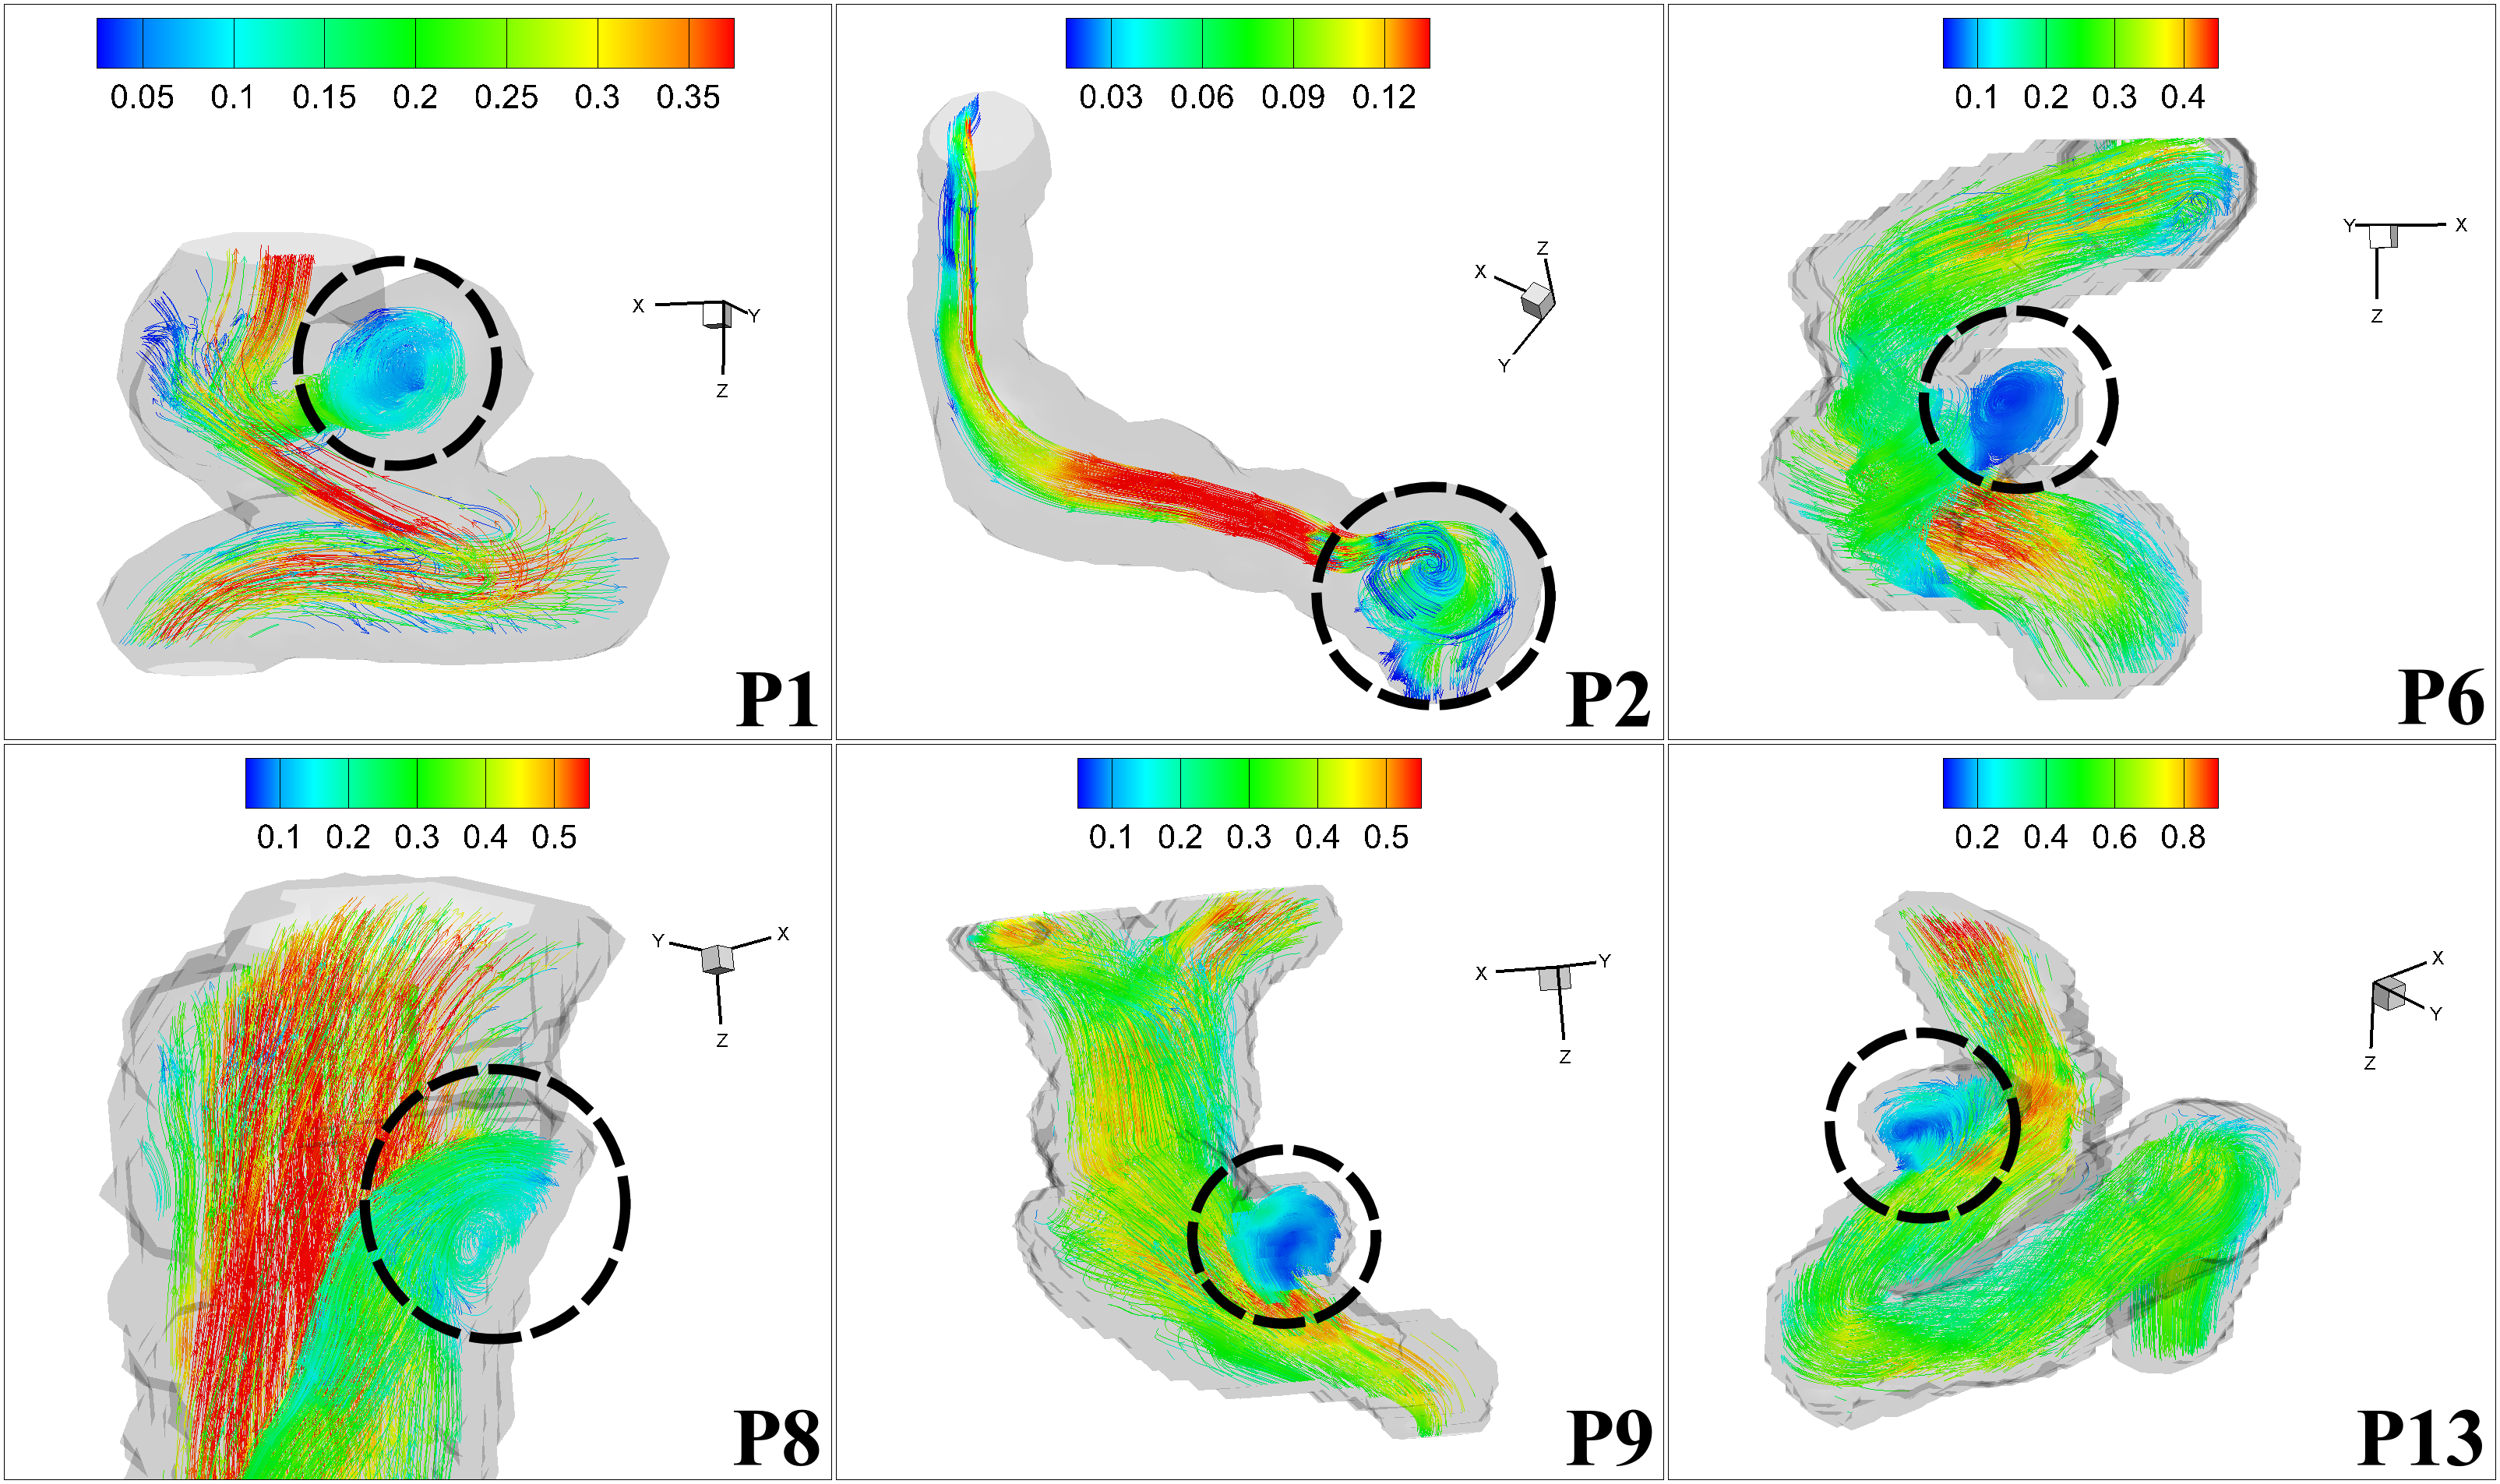
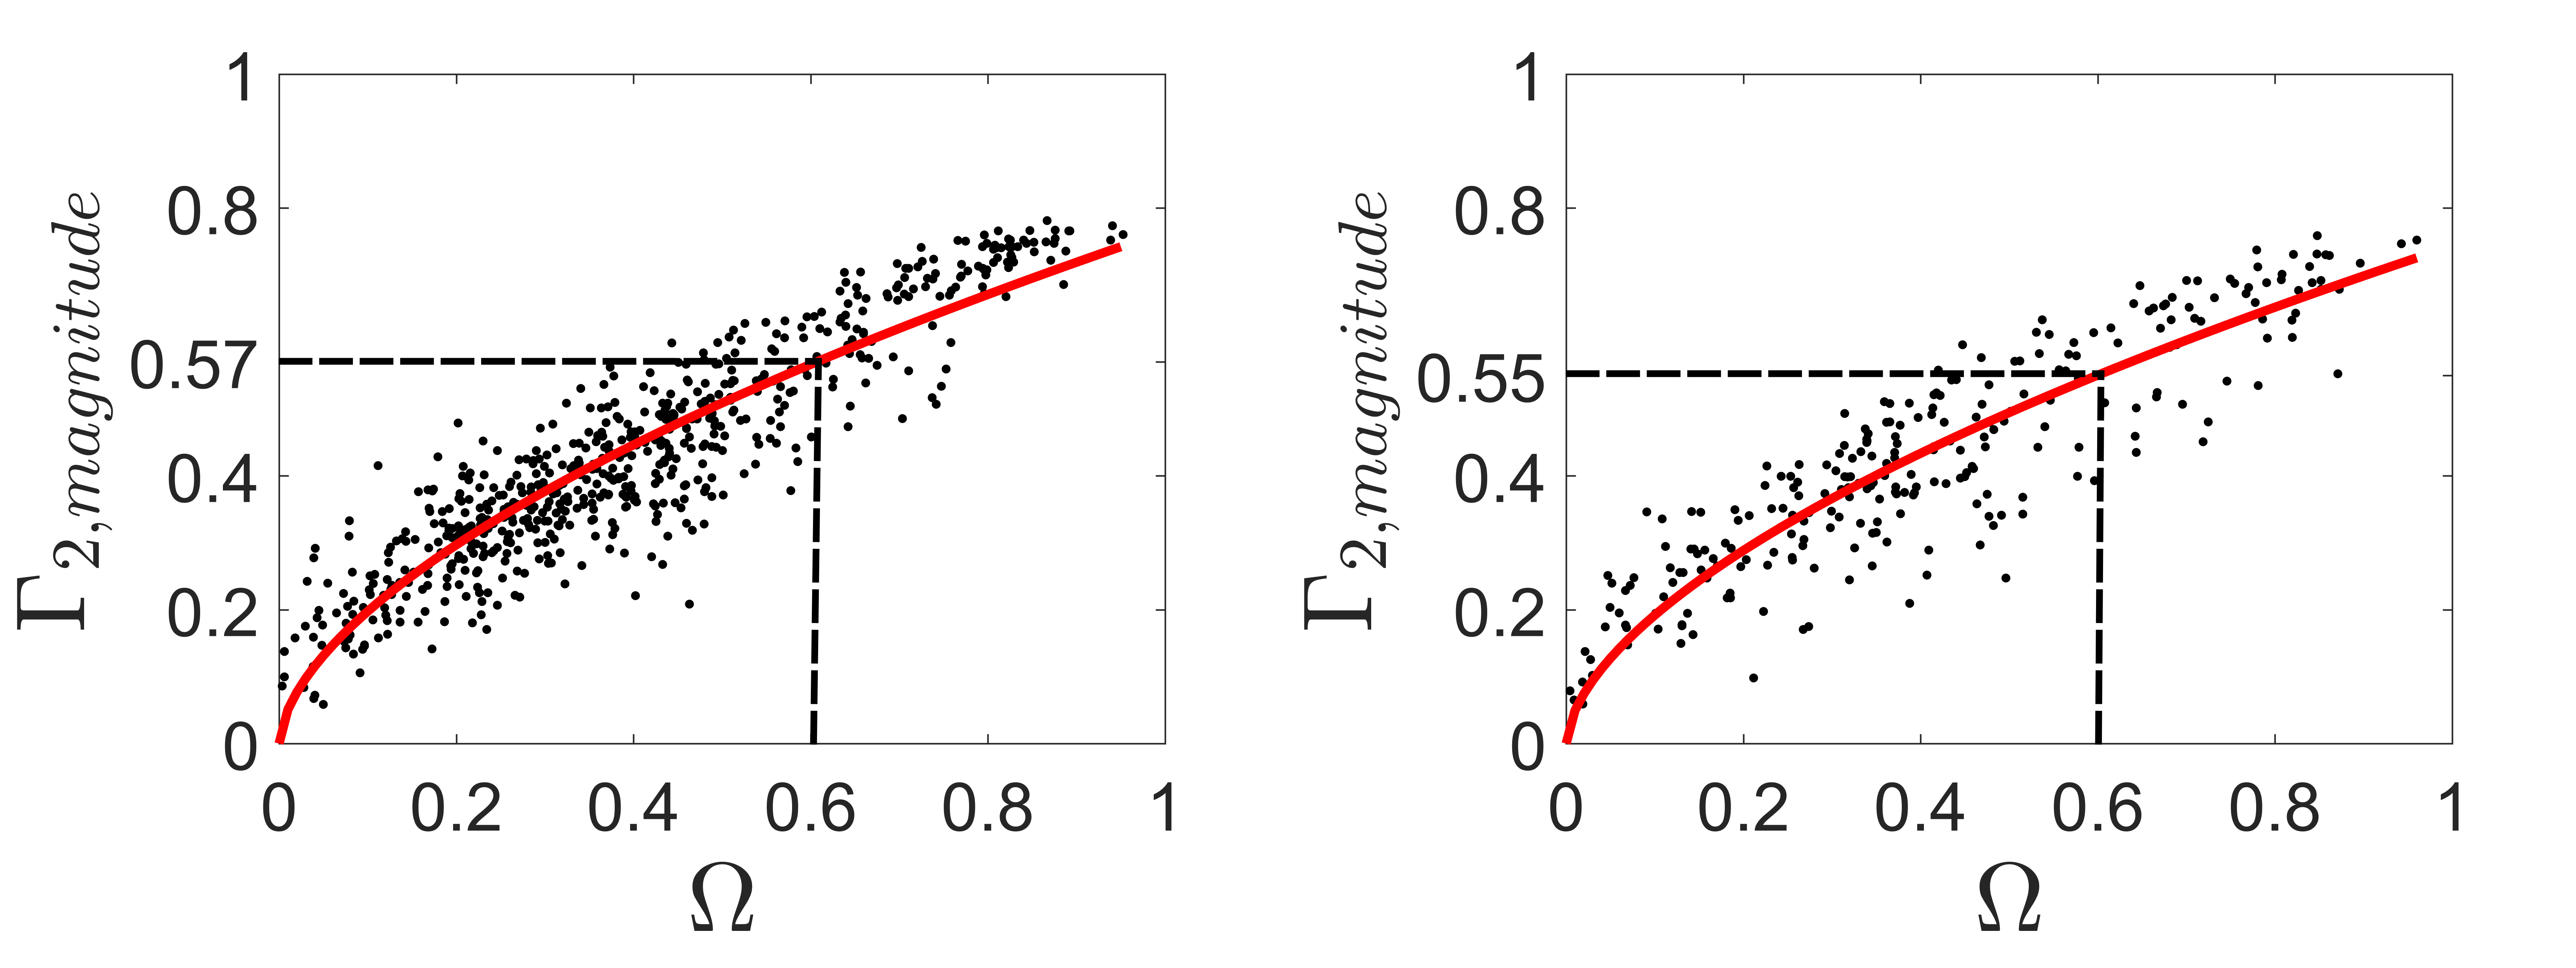
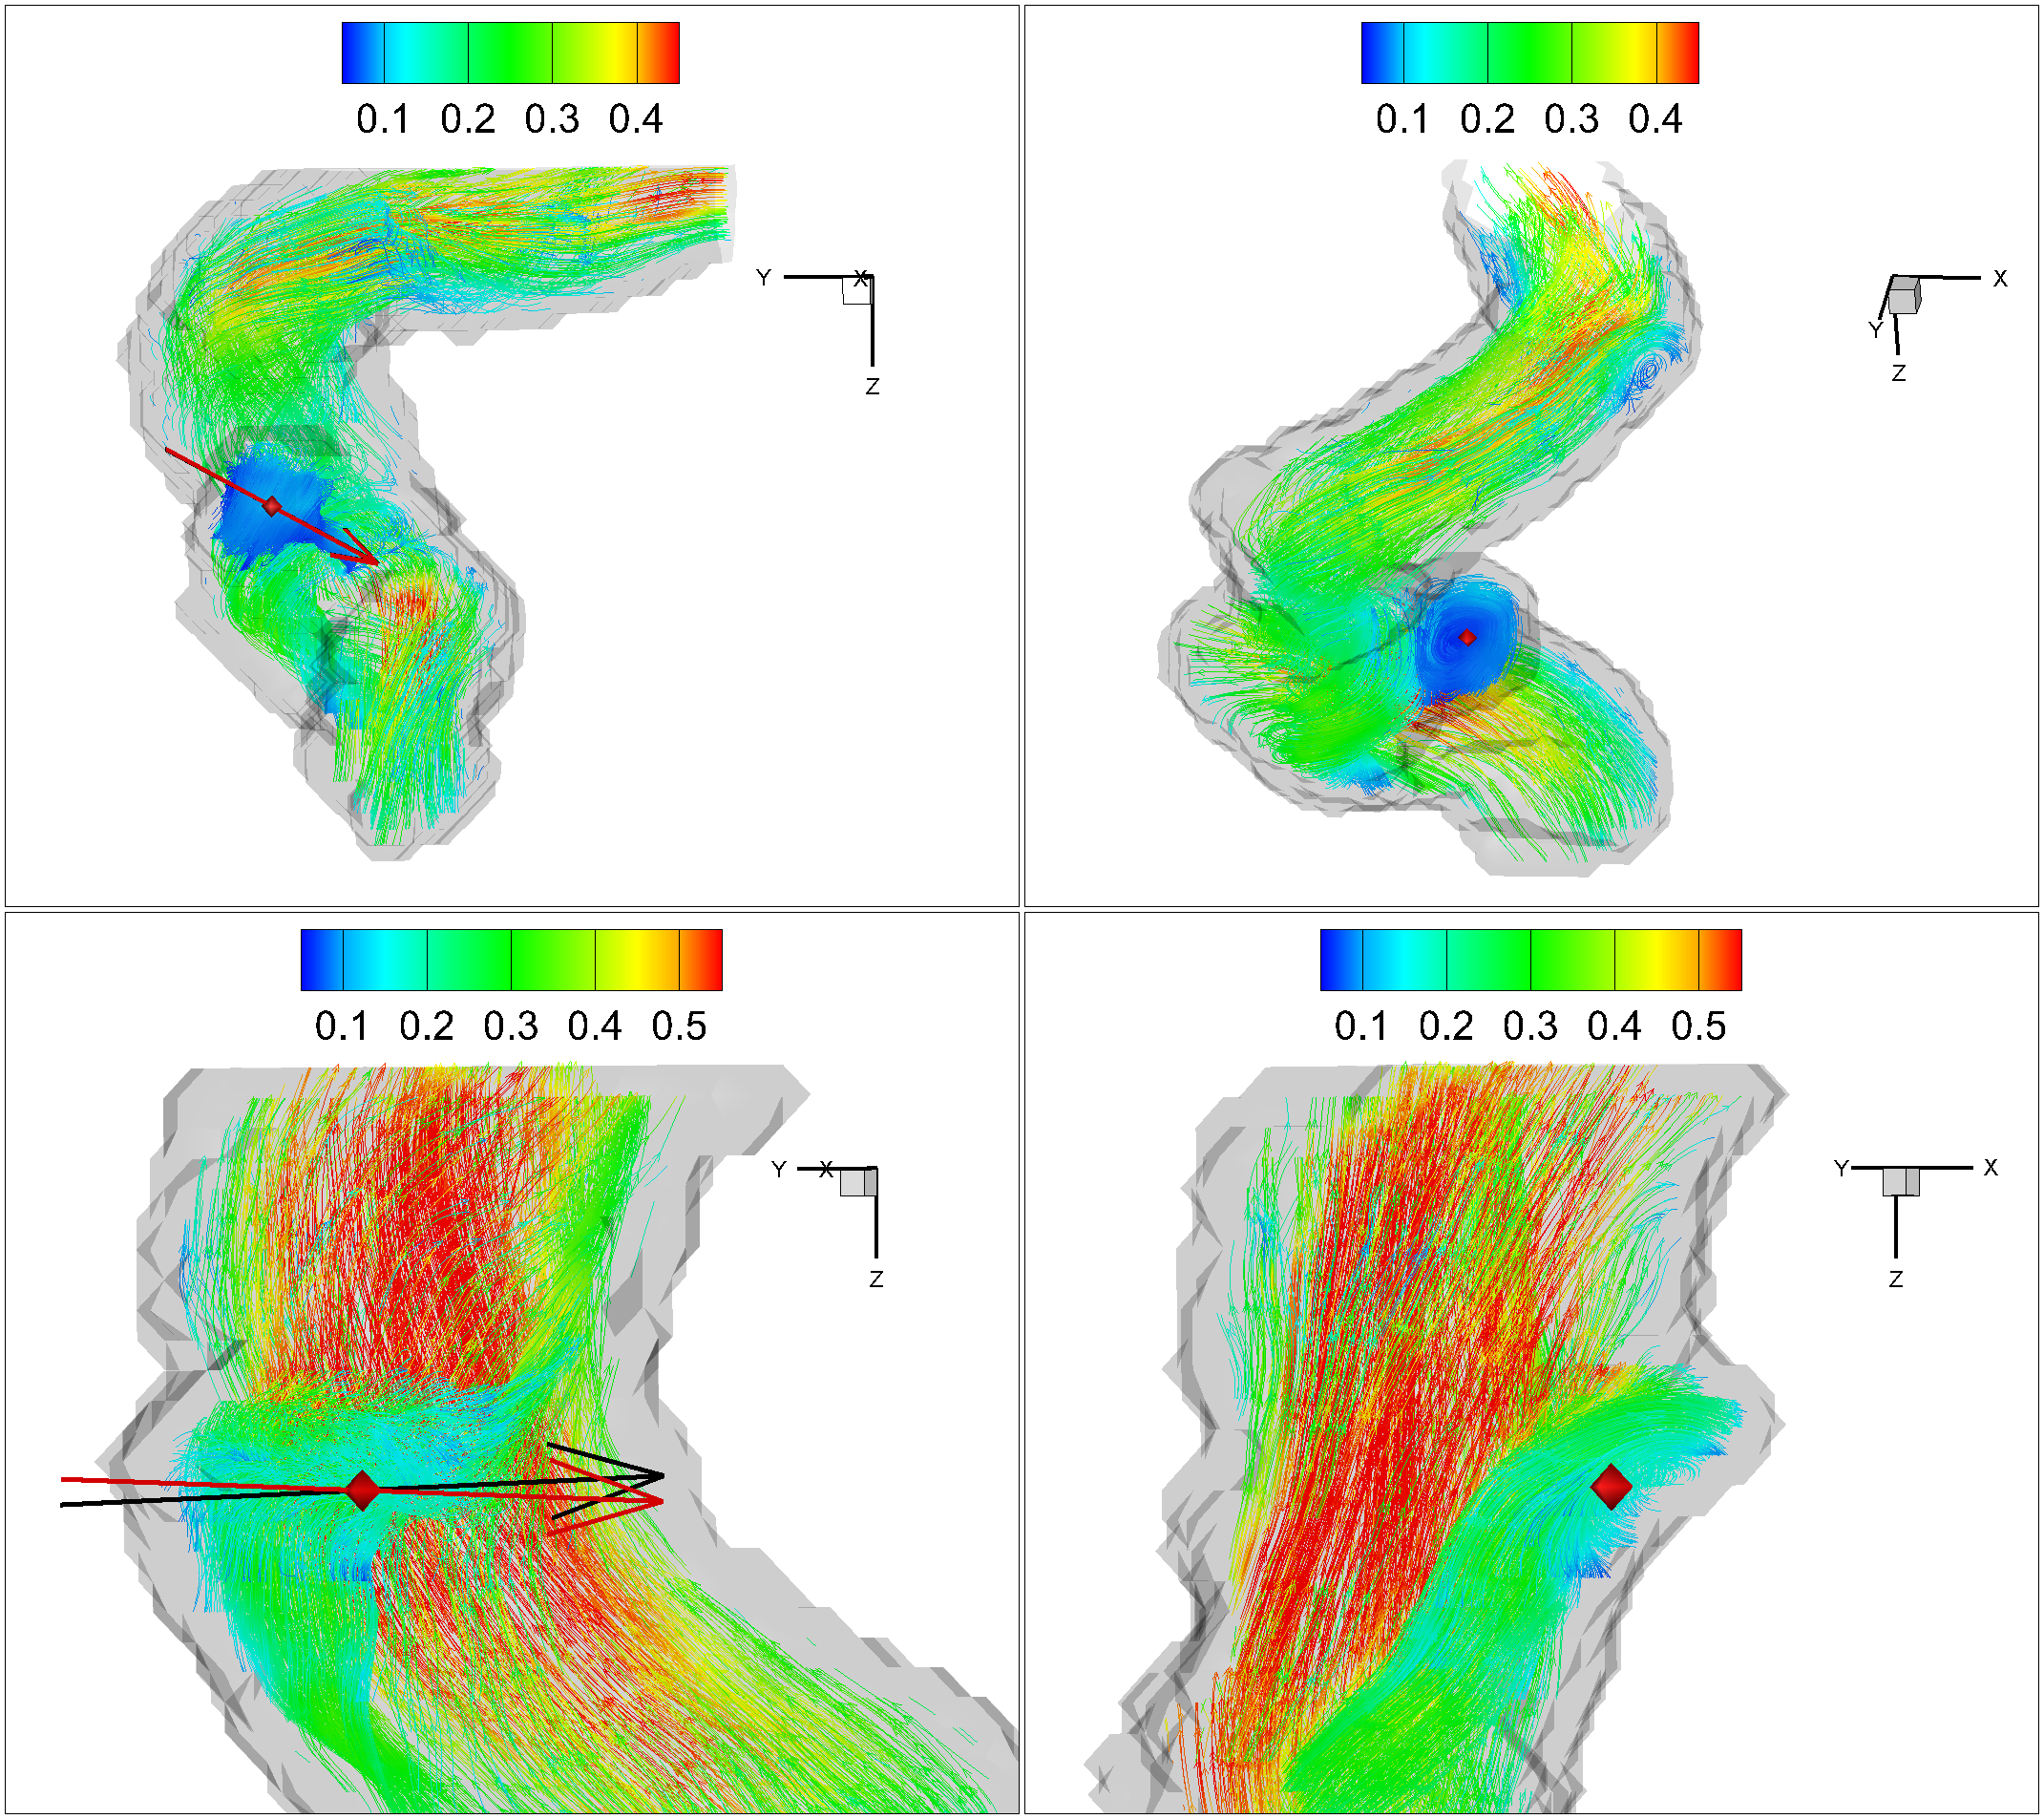
Figure 3 shows the scatter plot of the magnitude $$$\Gamma_{2,magnitude}$$$ and $$$\Omega$$$ inside aneurysm sac for two representative cases P6 and P8. The threshold used for $$$\Omega$$$ is chosen as $$$0.6$$$ to determine the threshold of $$$\Gamma_{2,magnitude}$$$. The determined threshold of $$$\Gamma_{2,magnitude}$$$ by the nonlinear regression model varies through cases but all are over $$$0.5$$$. The corresponding defined high $$$\Gamma_{2,magnitude}$$$ and $$$\Omega$$$ regions are shown in Figure 4. The volume ratio of the defined high $$$\Gamma_{2,magnitude}$$$ region to high $$$\Omega$$$ region is around $$$1$$$. (P6: $$$1.13$$$; P8: $$$1.12$$$). Figure 5 shows the results of the proposed vortex identification approach applied to these two aneurysm cases. For each case, the two different methods generate different main vortex directions ($$$\overrightarrow{\Gamma_{2}}$$$: black arrow, $$$\overrightarrow{\omega}$$$: red arrow), but both of them locate the same main vortex center based on $$$\overrightarrow{\Gamma_{1}}$$$, which is denoted by the red diamond. The respective positions of the three dimensional vortex center in both cases are well located with this approach. We can see in first case, these two main vortex vectors are fairly indistinguishable from each other, while also the angle between these two vectors in second case are small. This minute discrepancy indicates that the magnitude of $$$\overrightarrow{\Gamma_{2}}$$$ is a feasible scalar to capture the high vortex motion, and the three dimensional main vortex identification approach based on proposed $$$\overrightarrow{\Gamma_{2}}$$$ vector method is comparable to the $$$\Omega/\overrightarrow{\omega}$$$ method.Discussion/Conclusion
Our proposed approach based on two different methods ($$$\overrightarrow{\Gamma_{2}}$$$ and $$$\Omega/\overrightarrow{\omega}$$$) is an effective way to quantify the strong vortex motion and gives the dominant axis around which the three dimensional main vortex motion rotates as a whole as well as its center. The magnitude of the new defined three dimensional $$$\overrightarrow{\Gamma_{2}}$$$ vector can be used as a good parameter to define the high vortex motion region. The fact that the angle between the two different main vortex vectors varies through cases is potentially associated with the existence of different flow hemodynamic environment and flow property inside the aneurysm sac, which may play as a key biomarker in determining the evolution of small aneurysms.Acknowledgements
NIH grants: P41 EB027061, P30 NS076408.References
1. Zhou A, Amili O, Moen S, Toloui M, Grande A, Coletti F, Jagadeesan B and Van de Moortele PF. Toward a new Aneurysm Classification Framework: Initial Report on Stationary Spatial Blood Flow Pattern in Small Intracranial Aneurysms based on Submillimetric 4D Flow MRA at 7Tesla. ISMRM 27th Annual Meeting & Exhibition, 11-16 May 2019, Montréal, QC, Canada.
2. Poelma C, Watton PN, Ventikos Y. Transitional flow in aneurysms and the computation of haemodynamic parameters. Journal of The Royal Society Interface. 2015;12 (105):20141394.
3. Markl M, Frydrychowicz A, Kozerke S, Hope M, Wieben O. 4D flow MRI. Journal of Magnetic Resonance Imaging. 2012;36 (5):1015-36.
4. Graftieaux L, Michard M, Grosjean N. Combining PIV, POD and vortex identification algorithms for the study of unsteady turbulent swirling flows. Measurement Science and technology. 2001;12 (9):1422.
5. Liu C, Wang Y, Yang Y, Duan Z. New omega vortex identification method. Science China Physics, Mechanics & Astronomy. 2016;59 (8):684711.
Figures