1077
Heat Maps of Abnormal Intracranial Hemodynamics in Intracranial Atherosclerotic Disease using 4D Flow MRI
Yue Ma1,2, Maria Aristova1, Sameer Ansari1,3,4, Ann Ragin1, Michael Markl1, and Susanne Schnell1
1Radiology, Northwestern University, Chicago, IL, United States, 2Radiology, Shengjing Hospital of China Medical University, Shenyang, China, 3Neurology, Northwestern University, Chicago, IL, United States, 4Neurosurgery, Northwestern University, Chicago, IL, United States
1Radiology, Northwestern University, Chicago, IL, United States, 2Radiology, Shengjing Hospital of China Medical University, Shenyang, China, 3Neurology, Northwestern University, Chicago, IL, United States, 4Neurosurgery, Northwestern University, Chicago, IL, United States
Synopsis
Symptomatic intracranial atherosclerotic disease (ICAD) patients who present with stenosis and hemodynamic abnormalities are at higher risk of recurrent stroke. We propose a methodology that creates patient-specific ‘heat maps’ of abnormal hemodynamic parameters, based on intracranial dual-venc 4D flow MRI. The heat maps were created by detecting and highlighting outlier measurements from 95% confidence interval of normative parameter estimates in healthy controls. Elevated peak velocity (PV) was found in 75% of patients and 58.3% of them with abnormal PV in the uninvolved hemisphere. This novel approach to characterize intracranial hemodynamic impact may allow making patient-specific risk stratification and treatment strategies.
INTRODUCTION
Intracranial atherosclerotic disease (ICAD) is a well-established etiology of ischemic stroke.1 While stenosis severity has long been considered the primary basis for treatment decisions,2 there is increasing recognition for a potentially critical role of abnormal intracranial hemodynamics in ischemic stroke recurrence.3 Hemodynamic abnormalities in ICAD patients have been associated with increased risk of recurrent ischemic stroke within one year despite optimal medical treatment .4 We have proposed an approach using dual-venc 4D flow MRI for generating patient-specific ‘heat maps’ that facilitate individualized assessment of intracranial hemodynamic abnormalities.METHODS
Intracranial dual-venc 4D flow MRI5 was acquired in 16 ICAD patients (12M, 62±14Y) with mild (<50%), moderate (50%-69%), or severe (>70%) intracranial stenosis and 59 age-matched healthy subjects (32M, 48±14Y) on a 3T scanner (Skyra or Prisma, Siemens, Germany). Sequence parameters are presented in Figure 1. 4D flow MRI data were corrected for noise, velocity aliasing, and phase offset errors, and a 3D phase-contrast MR angiogram (PC-MRA) of cerebral vessels was calculated using home-built Matlab software (MathWorks, MA, USA).6 An in-house Matlab tool (MathWorks, MA, USA) was used to segment cerebral vessels in the PC-MRA and quantify hemodynamic parameters (including peak velocity (PV), net flow and flow rate(FR)) in each artery of circle of Willis (COW).7 Flow values in major intracranial arteries were normalized using total cerebral blood flow (sum of left and right intracranial carotid and vertebral arteries). Hemodynamic measures from the healthy controls were used to derive normative parameter estimates using polynomial fit as a function of age for males and females separately. An individualized hemodynamic heat map was created on the basis of an intracranial vascular diagram by detecting outlier measurements from the 95% confidence interval (CI) of the normative values in healthy controls (Figure 2). Vessels were PV or FR for the individual ICAD patient was higher than the 95% CI of normative values were highlighted in red. Vessels were PV or FR for the individual ICAD patient was lower than the 95% CI of normative values were highlighted in blue. The cut-off value for the individualized analysis of 95% CI was chosen to represent hemodynamic parameter values outside of the normative parameter estimates using a polynomial fit of age. Vessels that were within the normal range were delineated in gray. Furthermore, the percent difference of net flow, FR and PV in each COW artery compared to reference values were also displayed in the heat map.RESULTS
Figure 3 shows results for ICAD patients. 6.2% of stenotic arteries and 31.25% of patients showed abnormal FR. 62.5% of stenotic arteries (median increase 7.82%, IQR: 21.91%) and 75% of patients showed abnormal PV. This data was visualized by the heat maps in Figure 4. Patients generally showed elevated PV in at least one artery. Whereas all patients expressed elevated PV in the stenotic hemisphere, in 58.3% this was also evident in uninvolved hemispheric arteries. Among three patients with compensatory collateral circulation, two patients had more than three intracranial arteries with elevated PV in non-stenotic vessels.DISCUSSION
This study presents proof of concept for standardized heat map visualization of abnormal intracranial hemodynamics in ICAD patients. Heat maps were obtained by comparing hemodynamic parameters of intracranial arteries with normative parameter estimates using the polynomial fit of each parameter relative to age in healthy controls. Results for 16 ICAD patients showed that less than 10% of stenotic arteries had abnormal FR, which was due to compensation for reduced flow by COW anastomosis. PV was a more effective and sensitive marker than FR, consistent with previous results7. 75% of ICAD patients had elevated PV in intracranial vessels, and 90% had elevated PV in more than one artery, including non-stenotic vessels. When severe stenosis was accompanied by collateral circulation, up to 6 vessels showed elevated PV. This suggests that stenosis in ICAD patients not only causes hemodynamic changes in the stenotic vessels, but also in intracranial non-stenotic vessels. These findings underscore the clinical imperative of conducting a comprehensive assessment of intracranial hemodynamics in ICAD patients.8 These findings support the potential diagnostic utility of presenting 4D flow MRI results in individual patients using heat maps. These maps, which reflect hemodynamic parameters and patterns of abnormality in specific vessels, facilitate clinical interpretation. Further work will include detailed analysis of sensitivity and specificity for varying thresholds in larger ICAD studies.CONCLUSION
This pilot study presents a methodology to create heat maps for visualization and quantification of abnormal intracranial hemodynamic parameters in individual ICAD patients. This novel approach to characterize intracranial hemodynamics allows clinicians to immediately understand the hemodynamic impact of the stenosis and to gain unique insights regarding the heterogeneous expression of ICAD. Heat maps could be leveraged in the future to guide patient-specific risk stratification and treatment strategies for recurrent stroke.Acknowledgements
We gratefully acknowledge the support of the American Heart Association (AHA 16SDG30420005), and the NIH (NIH F30 HL140910, NIH 1R21NS106696-01).References
1. Kasner SE, Chimowitz MI, Lynn MJ, et al. Predictors of ischemic stroke in the territory of a symptomatic intracranial arterial stenosis.Circulation. 2006;113(4):555-63. 2. Uchiyama S, Sakai N, Toi S, et al. Final results of cilostazol-aspirin therapy against recurrent stroke with intracranial artery stenosis (CATHARSIS). Cerebrovascular diseases extra.2015; 5(1): 1-13. 3.Leng X, Lan L, Ip H L, et al. Hemodynamics and stroke risk in intracranial atherosclerotic disease. Annals of neurology.2019;85(5): 752-764. 4. Pu Y, Lan L, Leng X, et al. Intracranial atherosclerosis: from anatomy to pathophysiology. International Journal of Stroke. 2017;12(3): 236-245. 5. Schnell S, Ansari S A, Wu C, et al. Accelerated dual‐venc 4D flow MRI for neurovascular applications. Journal of Magnetic Resonance Imaging.2017; 46(1): 102-114. 6. Bock J, Kreher B W, Hennig J, et al. Optimized pre-processing of time-resolved 2D and 3D phase contrast MRI data.Proceedings of the 15th Annual meeting of ISMRM.Berlin, Germany. 2007;3138. 7. Vali A, Aristova M, Vakil P, et al. Semi‐automated analysis of 4D flow MRI to assess the hemodynamic impact of intracranial atherosclerotic disease. Magnetic resonance in medicine. 2019; 82(2): 749-762. 8. Wu C, Schnell S, Vakil P, et al. In vivo assessment of the impact of regional intracranial atherosclerotic lesions on brain arterial 3D hemodynamics. American Journal of Neuroradiology.2017; 38(3): 515-522.Figures
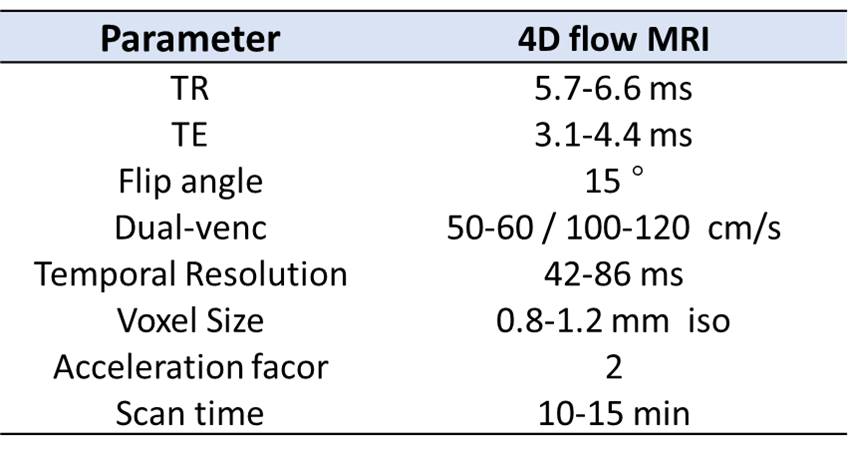
Figure1. 4D flow MRI sequence parameters.
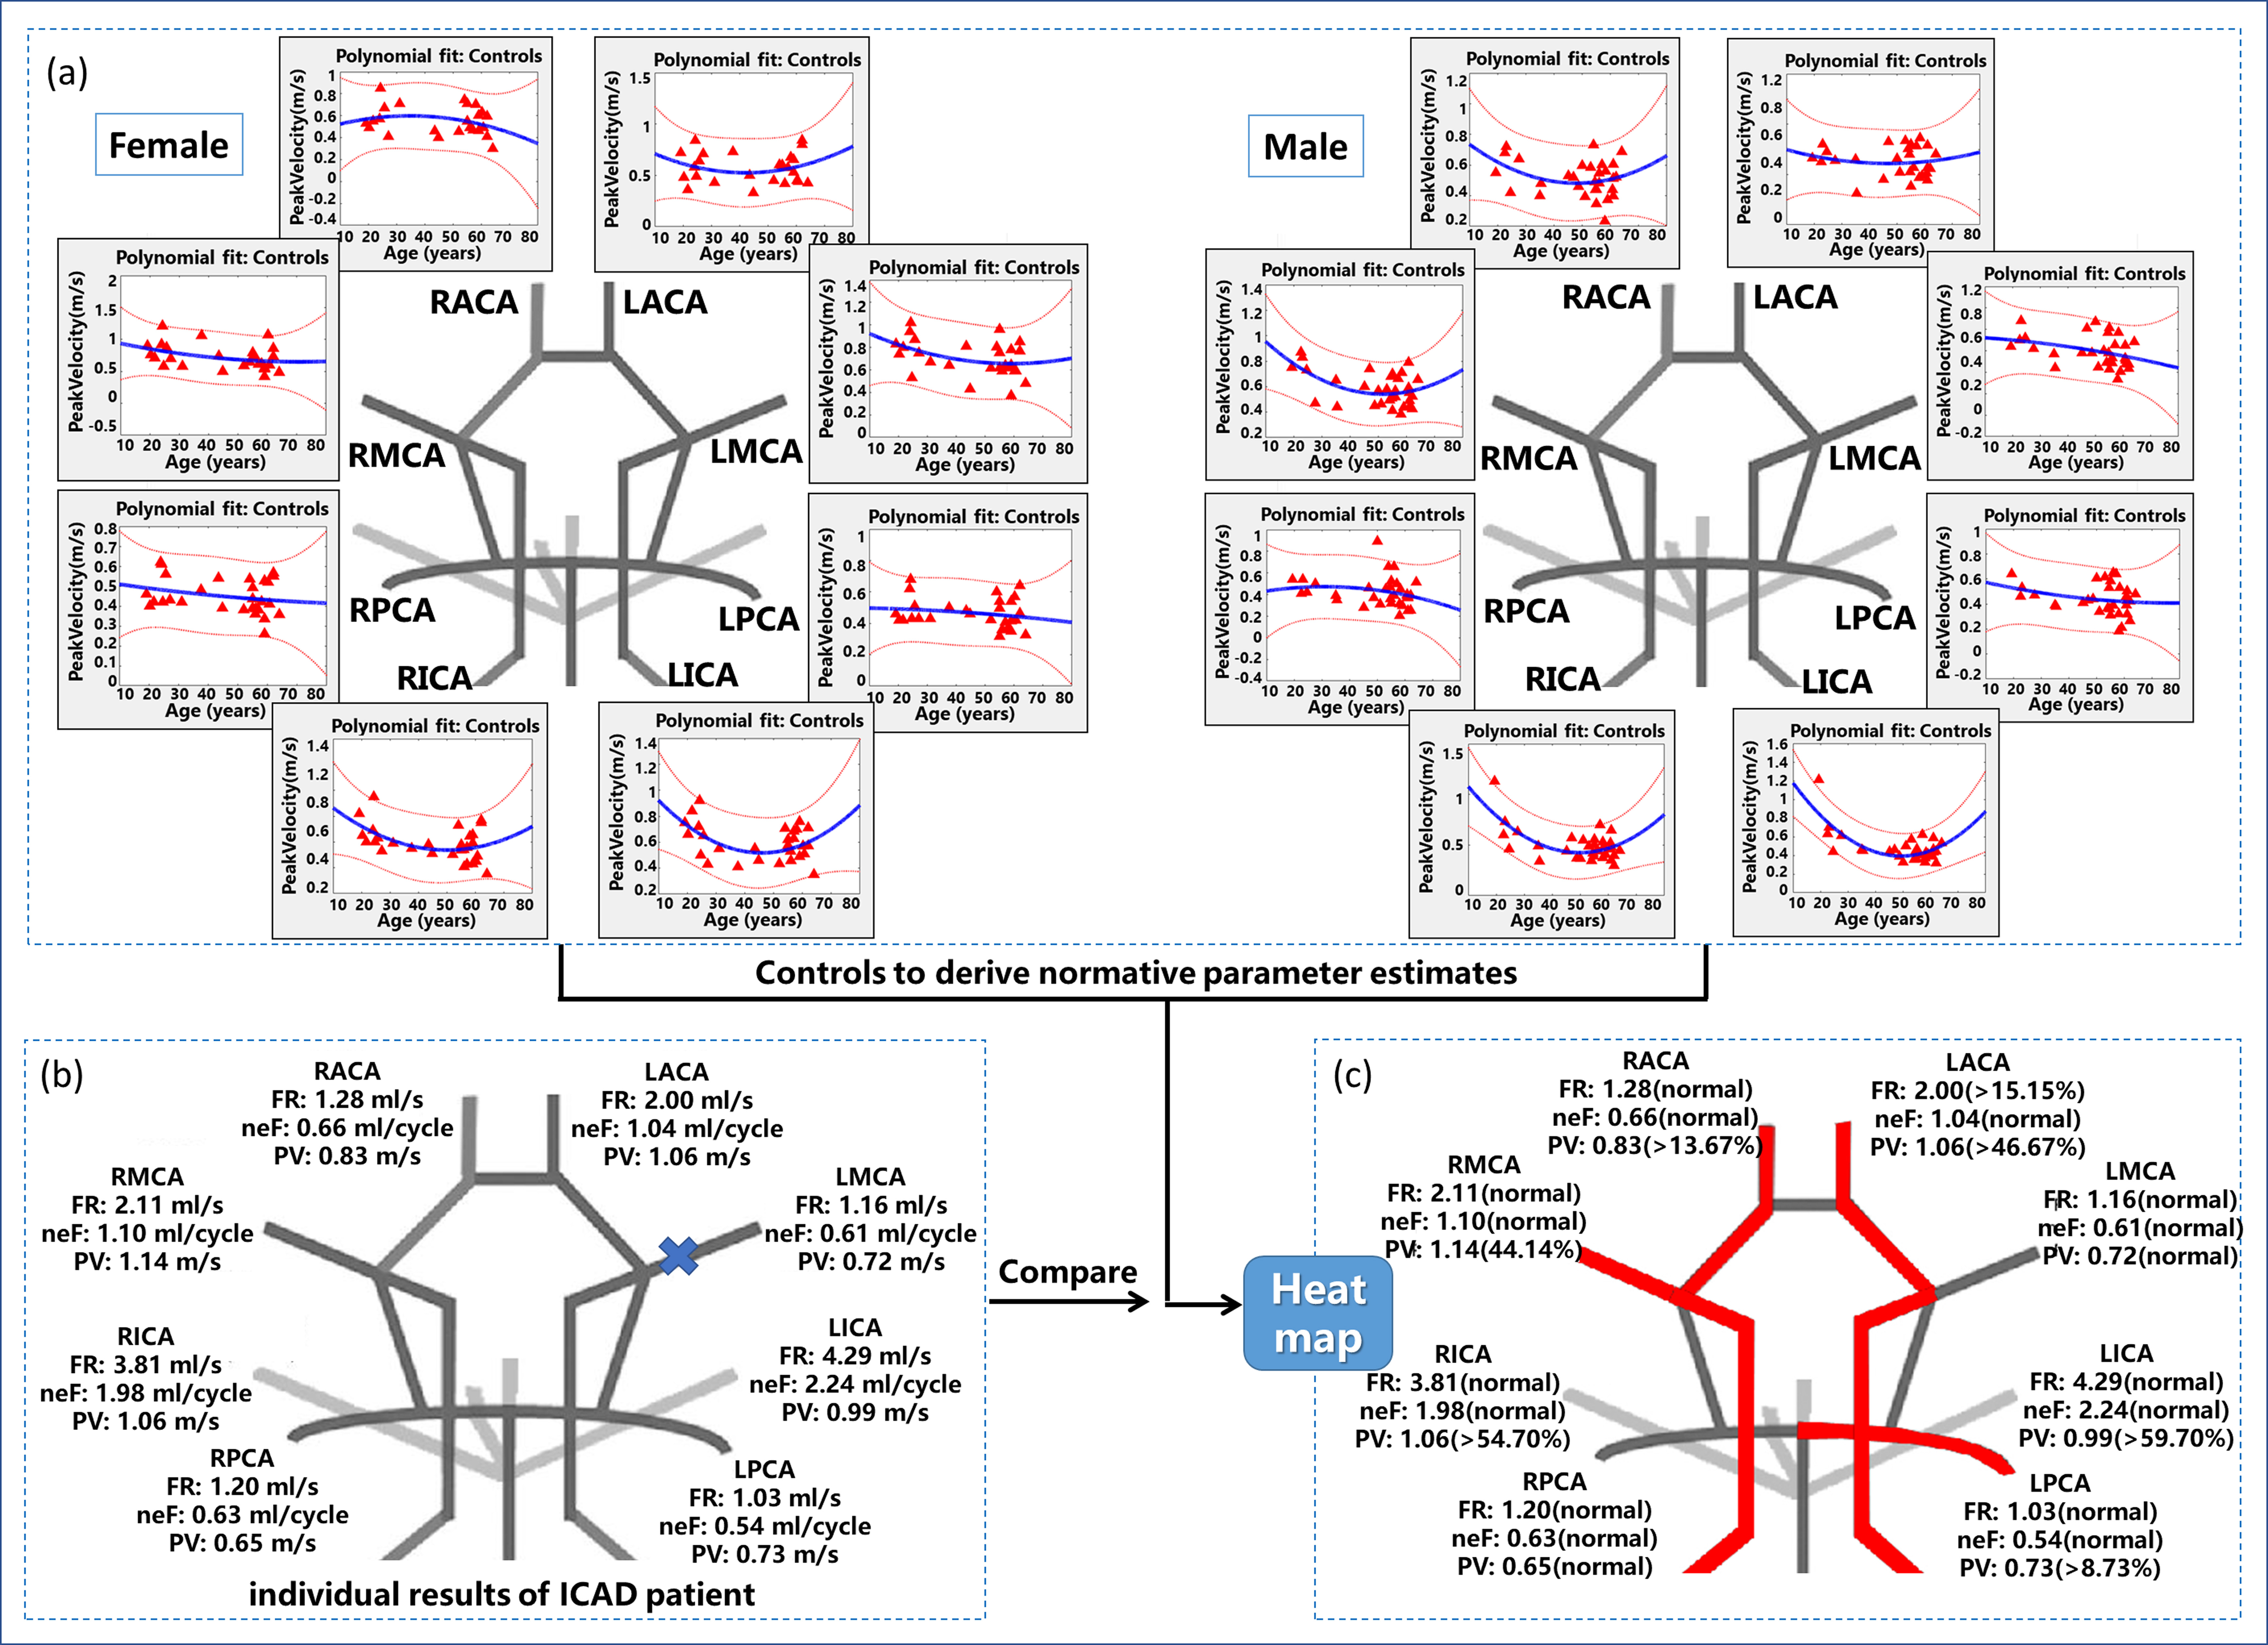
Figure2. Generation of hemodynamic heat maps. Hemodynamic
measures (exemplarily shown for peak velocity) from the healthy controls are
used to derive normative parameter estimates using polynomial fit of age for females
and males (a). The normal range of parameter values (the 95% CI shown in
polynomial fits of age) are shown in gray in a schematic diagram of
intracranial vessels (a). The hemodynamic values of an ICAD patient (b) are compared
with normative values. Results are presented in heat maps
illustrating decreased or elevated hemodynamic values in the individual patient
(c).
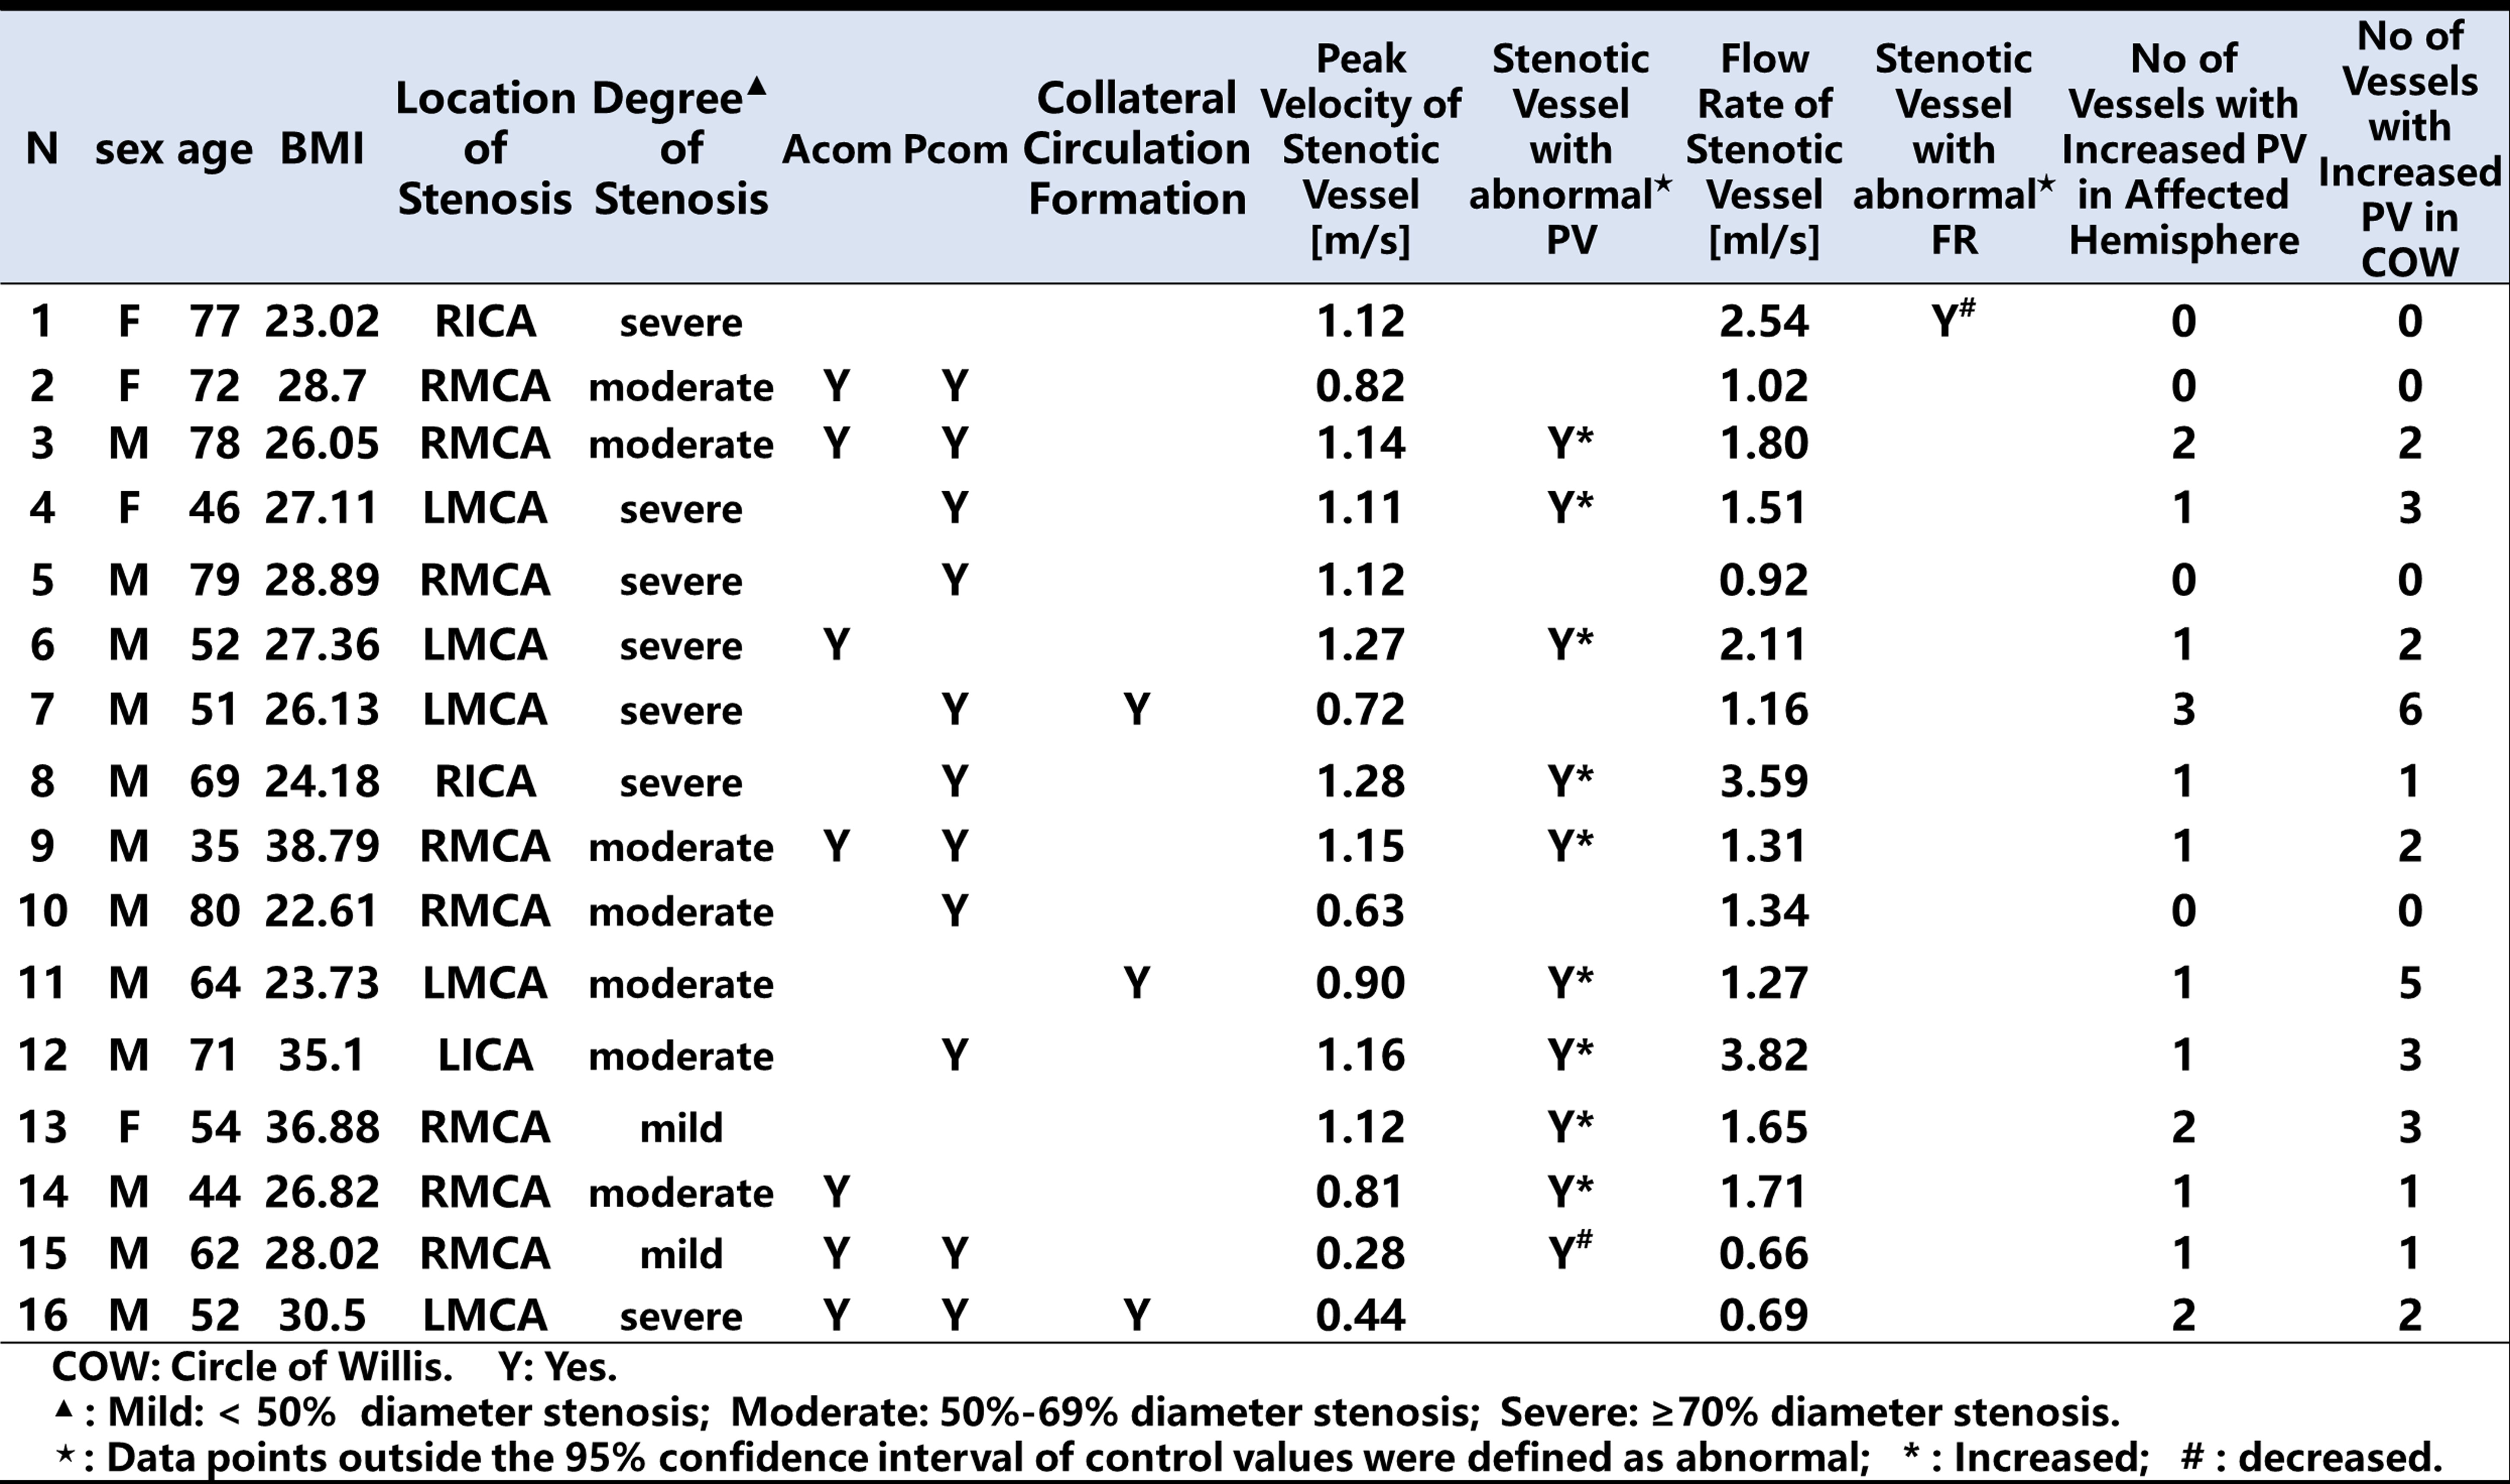
Figure3. The results for individual ICAD patients.
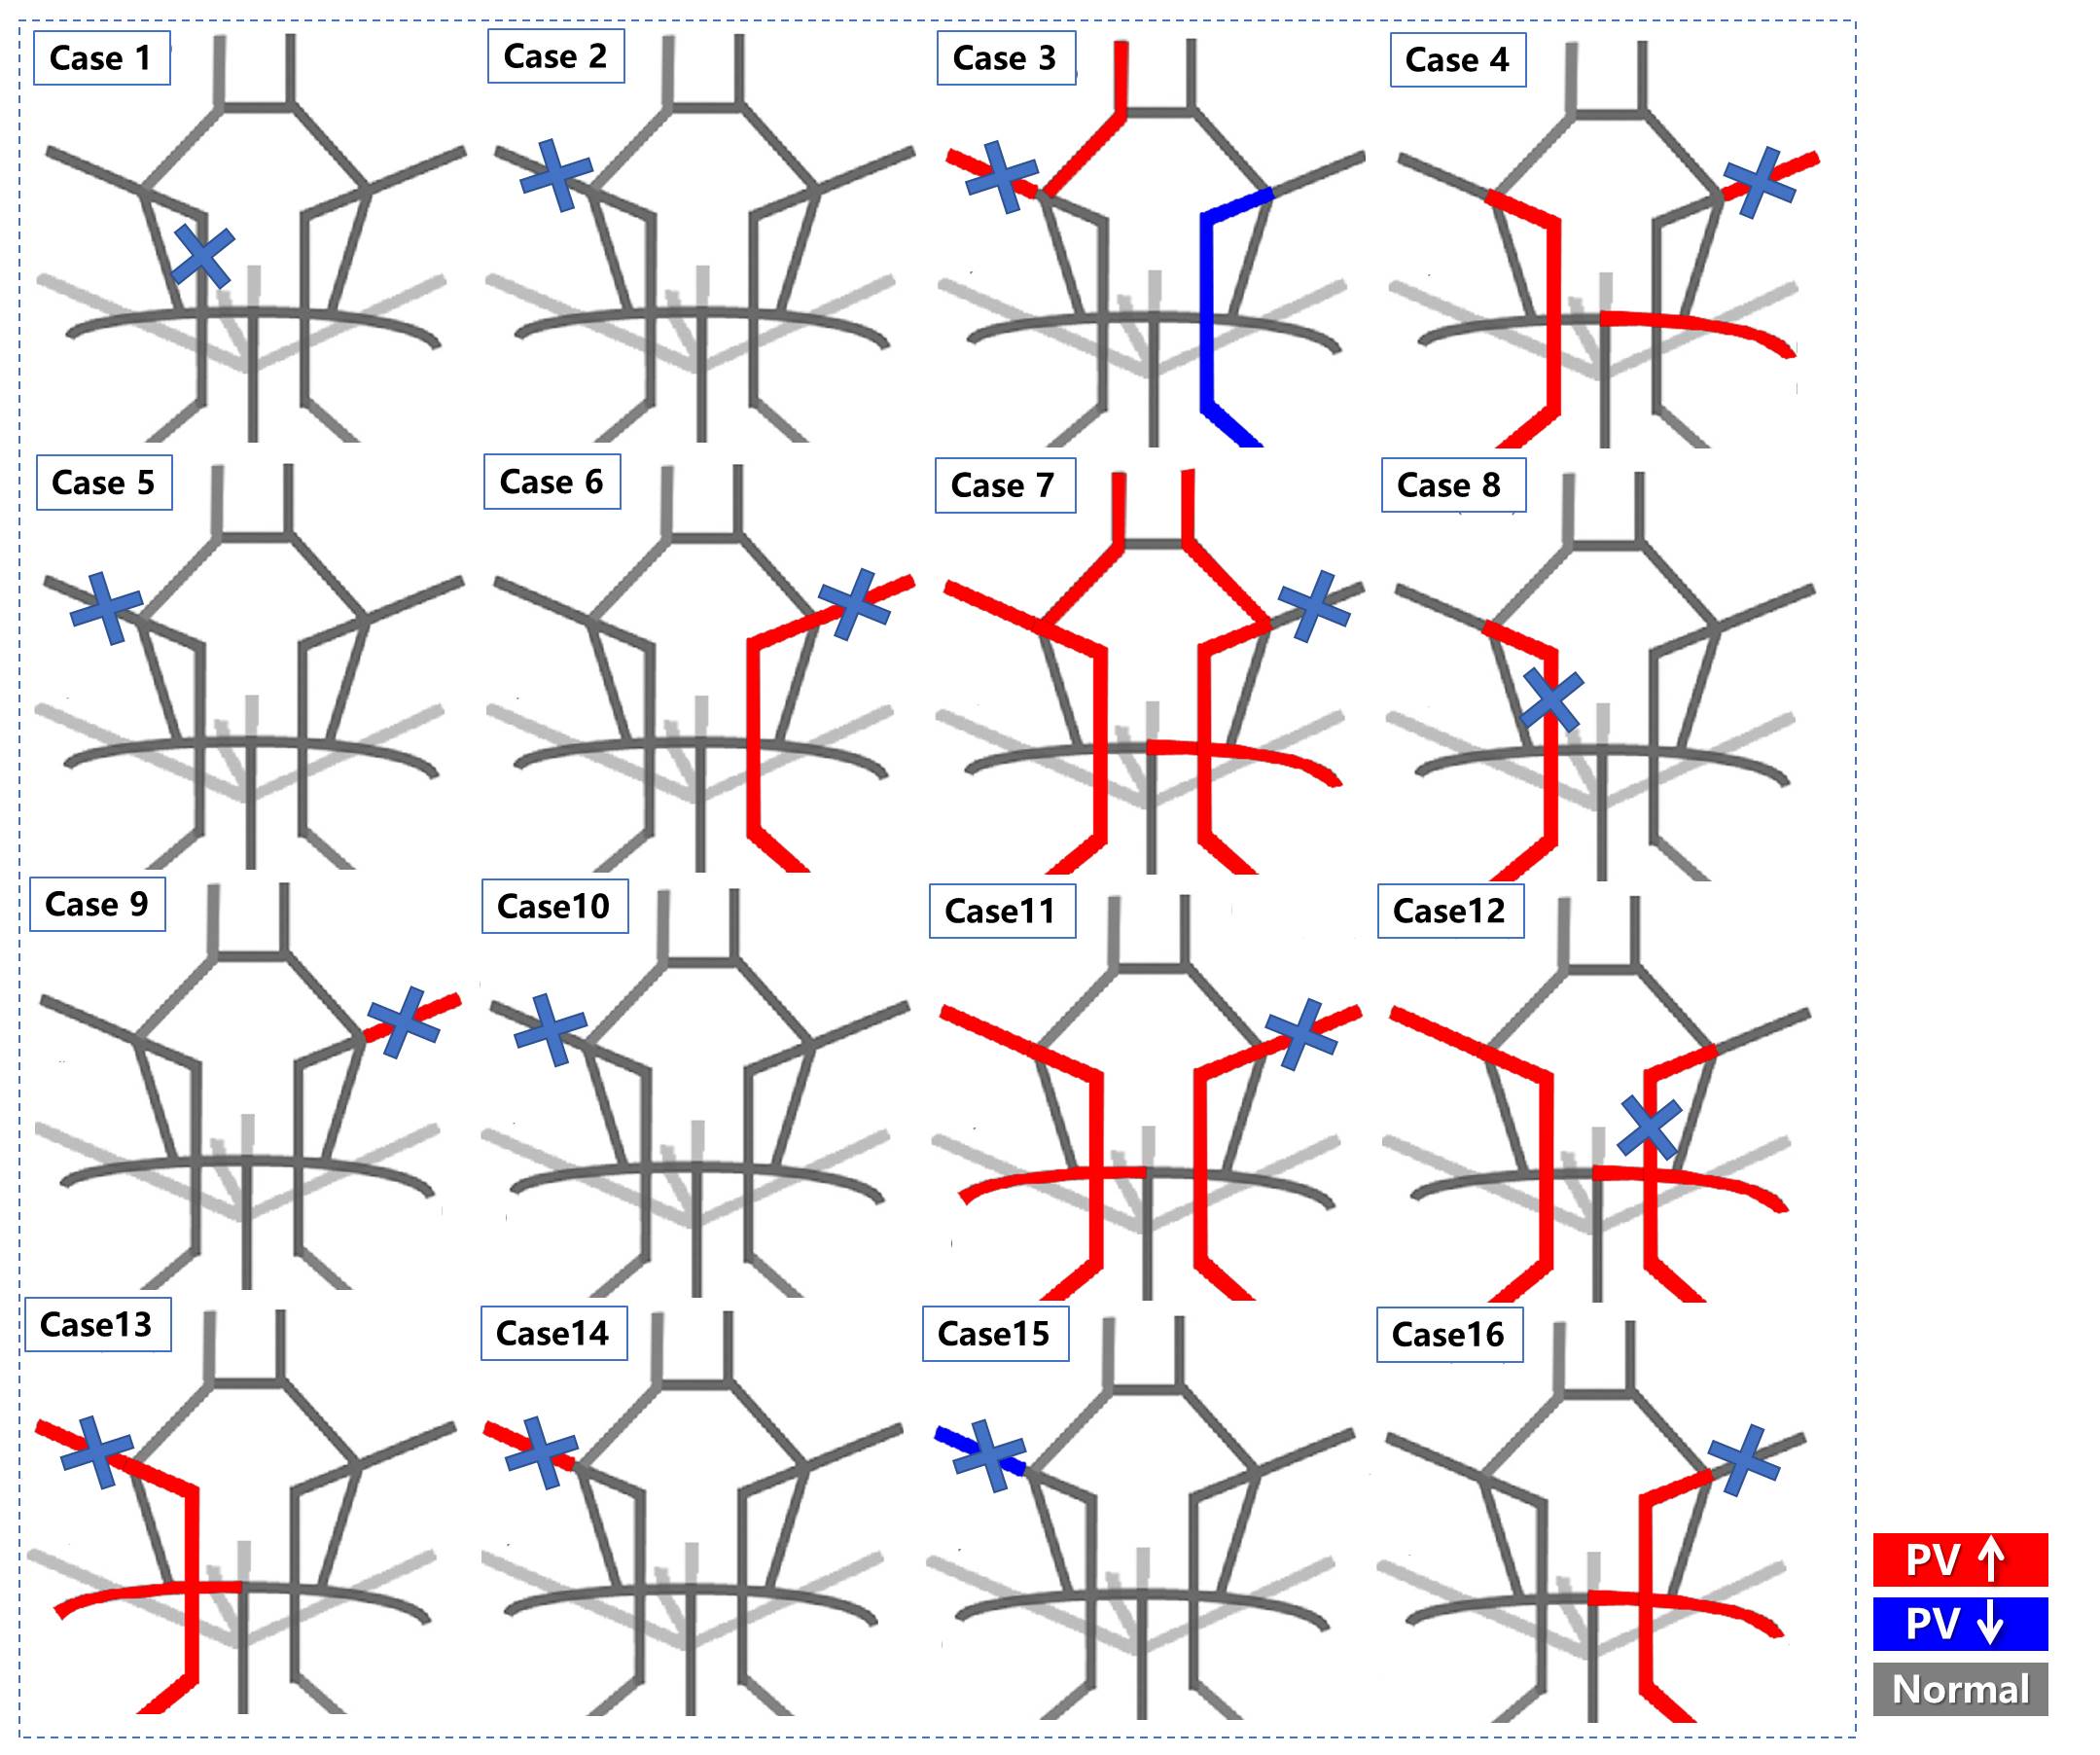
Figure4. Heat maps illustrating abnormally elevated peak velocity (red) and decreased peak velocity (blue) for each individual ICAD patient. The location of the stenosed artery is indicated with a blue cross. It can be seen that the abnormal peak velocity can occur in both affected and unaffected vessels. For the heat maps presented here, peak velocity was chosen expemplary, however heat maps can be created for any hemodynamic parameter that can be determined with 4D flow MRI.