1075
Clinical Evaluation of PETRA-MR Angiography in comparison with 3D-TOF-MRA for improved flow dephasing at 3 Tesla
Qing Fu1, Xiao-yong Zhang2, and Ding-xi Liu1
1Department of Radiology, Union Hospital, Tongji Medical College, Huazhong University of Science and Technology, Wuhan, China, 2MR Collaborations, Siemens Healthcare Ltd., Shenzhen, China
1Department of Radiology, Union Hospital, Tongji Medical College, Huazhong University of Science and Technology, Wuhan, China, 2MR Collaborations, Siemens Healthcare Ltd., Shenzhen, China
Synopsis
This study aimed to demonstrate the image quality and diagnostic performance of subtraction-based pointwise encoding time reduction with radial acquisition (PETRA-MRA) for improved flow dephasing in the intracranial internal carotid artery (ICA) when compared with conventional 3D-TOF-MRA. Our findings showed that image quality and signal homogeneity within the ICA in PETRA-MRA were significantly better than those obtained with TOF-MRA. In conclusion, PETRA-MRA proved to be superior for depicting less flow dephasing artifacts and better image quality in comparison with 3D-TOF-MRA.
Background and Purpose
Three dimensional time-of-flight MR angiography (3D-TOF-MRA) is the preferred non-contrast imaging technique for assessing cerebral vasculature, but is limited to flow dephasing artifacts in the vessel lumen, particularly in the tortuous carotid arteries1,2. Ultrashort echo-time (TE) sequence, e.g., quiet pointwise encoding time reduction with radial acquisition (PETRA) technique and PETRA-MRA can potentially address this issue, as it is inherently immune to flow dephasing3-5. This study sought to evaluate the image quality and diagnostic performance of PETRA-MRA for improved flow dephasing artifacts compared with conventional 3D-TOF-MRA in the ICA on a 3T MR scanner.Materials and methods:
All the IRB-approved MR examinations were performed on a 3Tesla MR scanner (MagnetomSkyra, Siemens Healthcare, Germany), equipped with 45mT/m achievable gradient strength and 200T/m/s maximum slew rate, using a commercially available 20-channel head-neck coil. Sixty healthy participants (33 male, 27female; mean age, 47 years; age range, 24-71 years) were enrolled in this study and underwent PETRA-MRA and 3D-TOF-MRA for intracranial segments of the ICA, without the administration of contrast material.3D TOF-MRA was performed in an axial orientation with the following parameters: FOV=200x200 mm2, TR/TE=20.00/3.43ms, flip angle=18°, imaging matrix = 320x256, acquired voxel size= 0.79x0.63x1.00mm3, bandwidth= 186 Hz/Px, and acquisition time(TA)=3min45sec. For PETRA-MRA in the same section orientation,the parameters were as follows: FOV=256x256 mm2,TR/TE=3.54/0.07ms, flip angle=6°,imaging matrix = 352x352, acquired voxel size= 0.73x0.73x0.73mm3, bandwidth =369Hz/Px, and radial views number=75000. As PETRA-MRA is subtracted from two imaging datasets with and without the slice-selective saturation slab at the bottom of the imaging volume, TA for PETRA-MRA was 4min36sec for data without the saturation band and 7min45sec for data with the saturation band, which was placed at the bottom of the imaging volume.
Two radiologists (with 10 years and 15 years of working experiences in neuroimaging, respectively) independently scored the image quality of PETRA-MRA and TOF-MRA using a four-point scale for depicting the flow dephasing artifacts in the intracranial ICA (1, none, no signal loss; 2, mild, minimal signal loss; 3, moderate, medium signal loss but could meet diagnostic demand; and 4, severe, serious signal loss which could not meet the diagnostic requirement).
To quantitatively depict the homogeneity of the signal intensities within the ICA with the interference of flow dephasing artifacts, an intensity profile was performed by using ImageJ software (http://imagej.nih.gov/ij/index.html). A user-defined line (with line width 1 pixel) was drawn perpendicular to the axis vessel lumen of the cavernous segment (C4) before a plot profile could be obtained by showing a curve (x axis represents the distance (pixel) along the line, and the y axis represents the gray value).The quantitative analysis of the signal intensity homogeneity within the ICA was evaluated by a defined parameter d;d= 2Glow/(Ghigh1+Ghigh2),Glow represented the minimum gray value of the lower peak, Ghigh1 and Ghigh2 represented the maximum gray values of the two higher peaks, and these gray values were listed by the plot values in the ImageJ software. The greater the d value, the better the signal homogeneity in the vessel lumen. If the curve was similar to parabola with no lower peak between two higher peaks on the plot profile, the value of d would be defined as 1.0, representing a toward-zero flow dephasing artifact. The statistical difference in the subjective image quality scores and d values between PETRA-MRA and TOF-MRA were analyzed and compared using Wilcoxon signed rank test. Statistical significance was defined as p < 0.05. The weighted kappa (κ) statistic was calculated to assess inter-observer agreement.
Results:
The image quality of PETRA-MRA with an overall score 1.35± 0.53 (observer A: 1.37±0.55, observer B: 1.33±0.51) was significantly better than 3D-TOF-MRA with an overall score 3.50 ± 0.62 (observer A: 3.52±0.62, observer B: 3.48±0.62)(Z=-9.56, P<0.001).Inter-observer agreement was good for PETRA-MRA (weighted κ: 0.74) and excellent for 3D-TOF-MRA (weighted κ: 0.82). The parameter d value of PETRA-MRA was higher than that of 3D-TOF-MRA (0.93±0.06 vs.0.78 ± 0.14, Z=-6.49, P<0.001)(Fig 1&Fig 2).Discussion and Conclusion:
The ultrashortecho-time PETRA-MRA (TE=0.07ms) can help reduce the flow-related artifacts and improve signal loss in the vessel lumen. Moreover, PETRA comprises a combination of half-projection radial acquisition in the outer k-space and single point-wise on a Cartesian trajectory in the center k-space, which allows for less sensitivity to motion artifacts and flow-related dephasing artifacts with a proper acquisition time. In conclusion, our results demonstrated the superiority of PETRA-MRA to 3D-TOF-MRA for improved flow dephasing artifacts in the intracranial ICA.Acknowledgements
noneReferences
1. Pandey S, Hakky M, KwakE,et al. Application of basic principles of physics to head and neck MR angiography: troubleshooting for artifacts. Radiographics 2013; 33:E113-E123.
2. Patel MR, Klufas RA, Kim D, et al. MR angiography of the carotid bifurcation: artifacts and limitations. AJR Am J Roentgenol 1994; 162:1431-1437.
3. Grodzki DM, Jakob PM, Heismann B. Ultrashort echo time imaging using pointwise encoding time reduction with radial acquisition (PETRA). Magn Reson Med 2012; 67:510-518.
4. Natsuaki Y, Bi X, Grodzki DM, et al. PETRA qMRA: Towards Zero-Flow Dephasing Intracranial Non-Contrast MR Angiography. In:Proc. Intl. Soc. Mag. Reson. Med., 2015.
5. Natsuaki Y, Grimm R, Bi X, et al. PETRA quiet MRA: Improved Robustness with 3D Elastic Cross-Registration. In:Proc. Intl. Soc. Mag. Reson. Med., 2016.
Figures
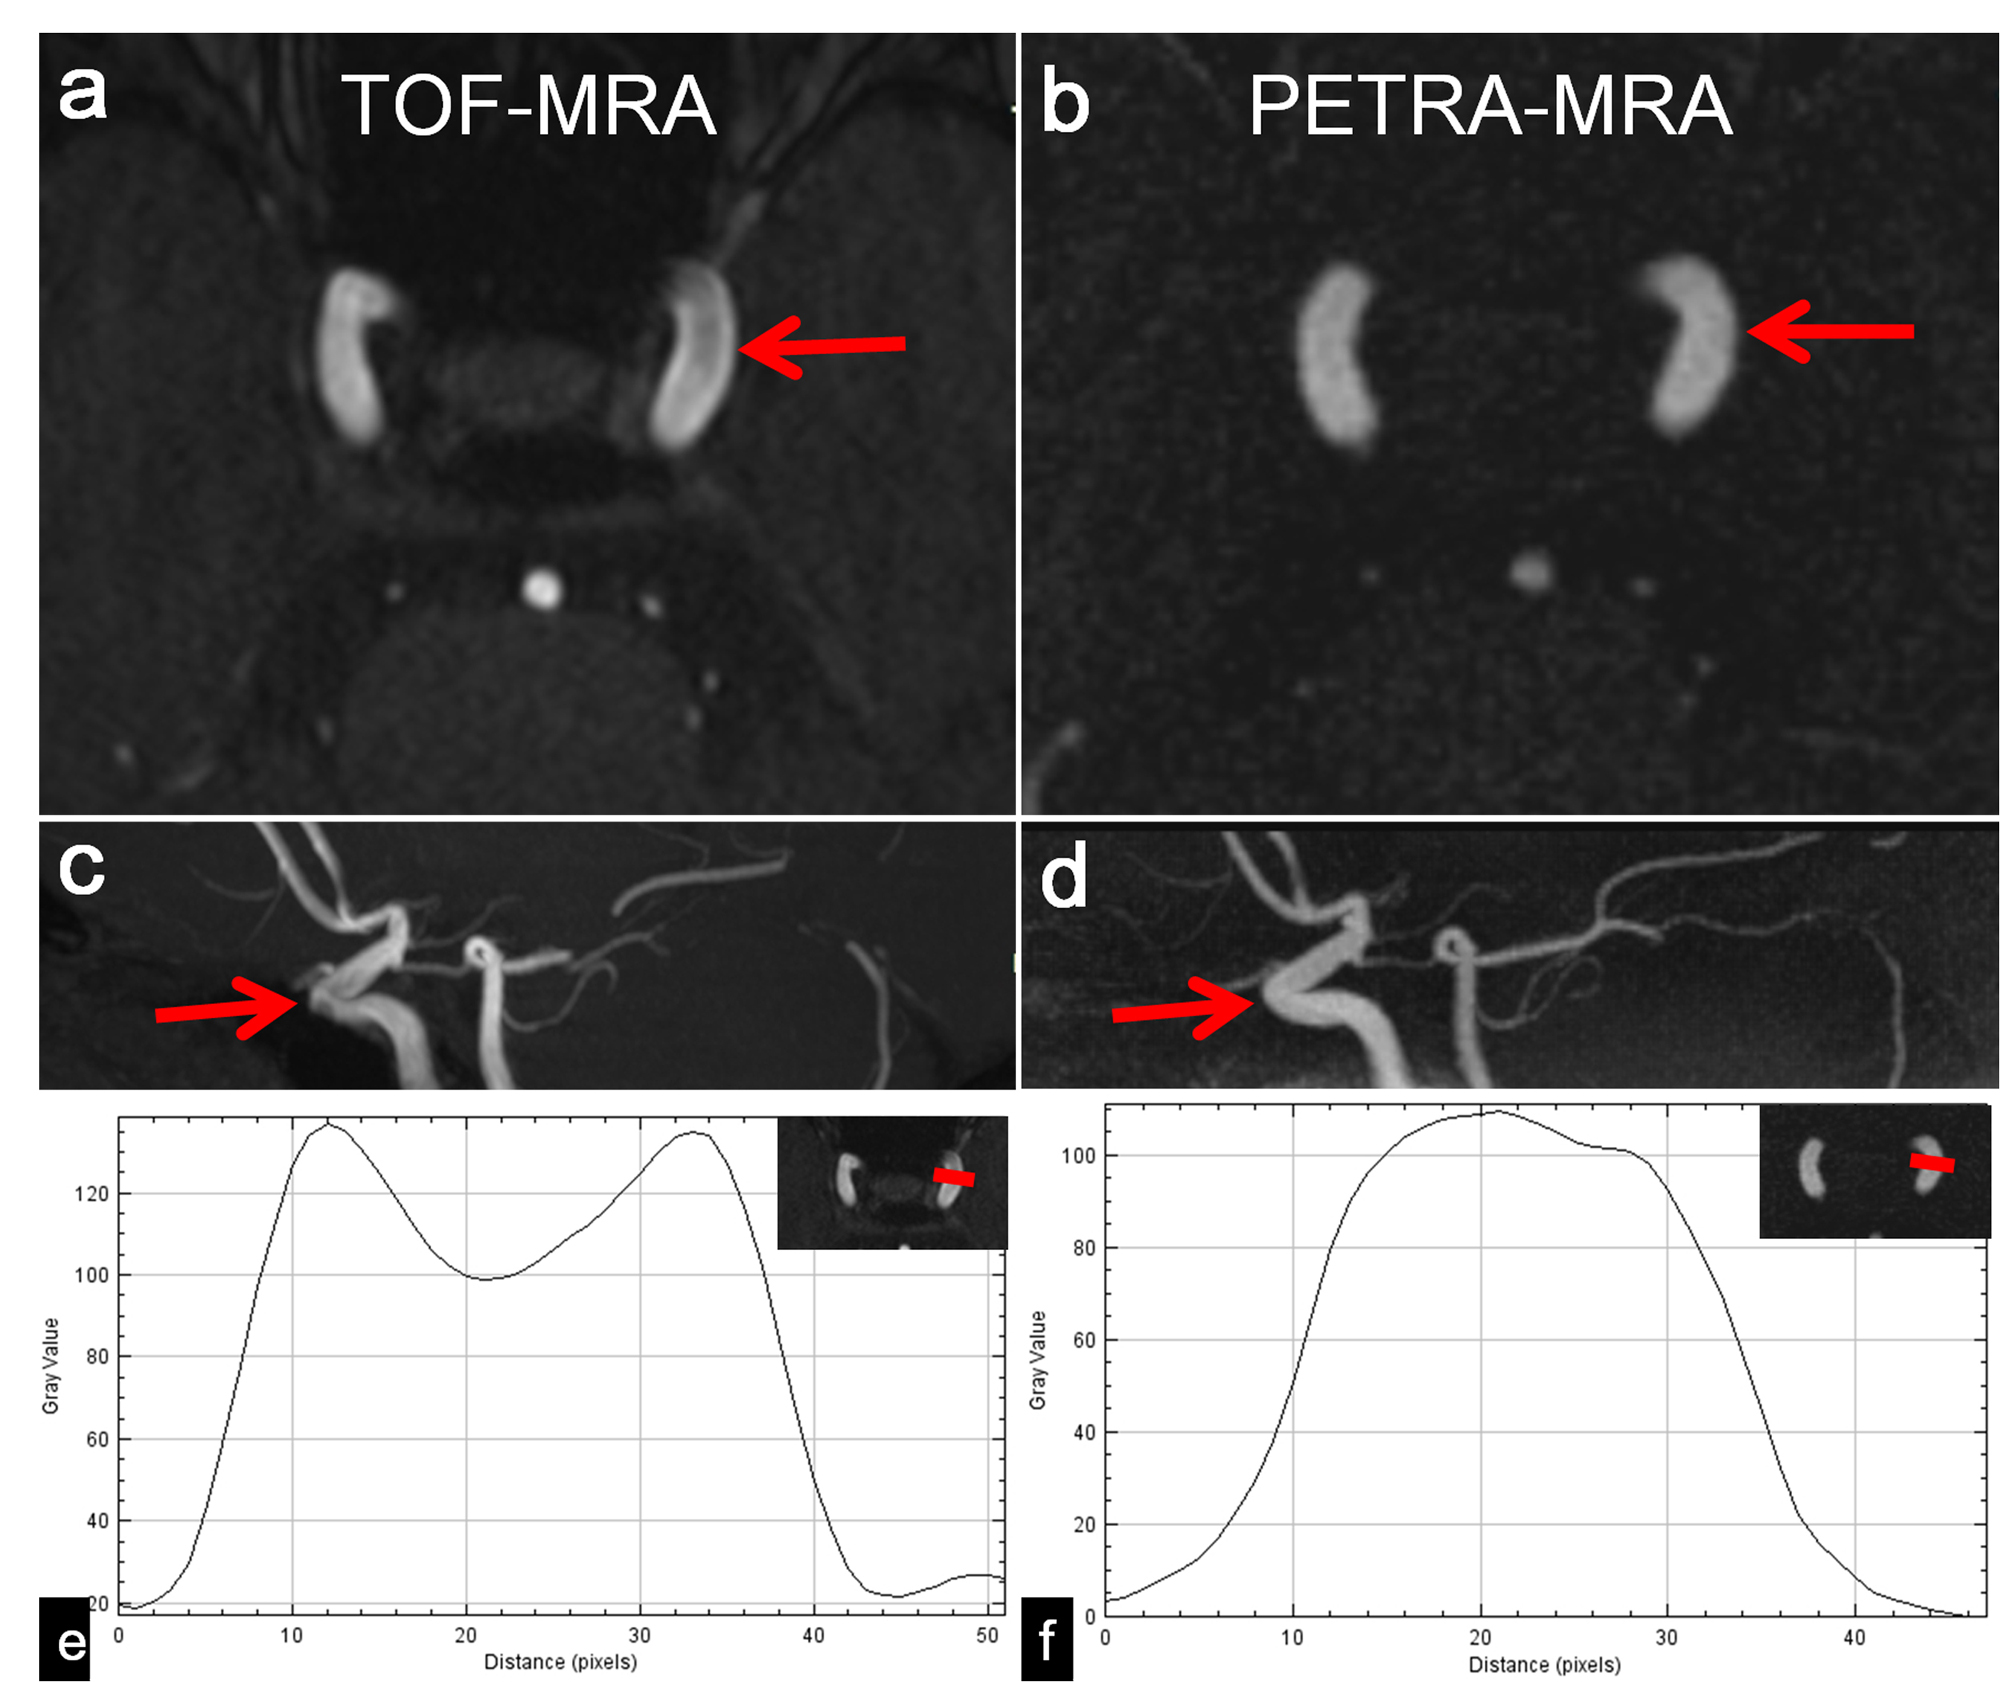
Figure 1: Axial and MIP images of the left ICA (with thickness 15mm) show obvious flow dephasing artifact on TOF-MRA (a, c). PETRA-MRA (b, d) shows toward-zero dephasing artifact (red arrows). Plot profile of TOF-MRA (e) shows a lower d value than that on PETRA-MRA (f) (0.71 vs. 1.0).
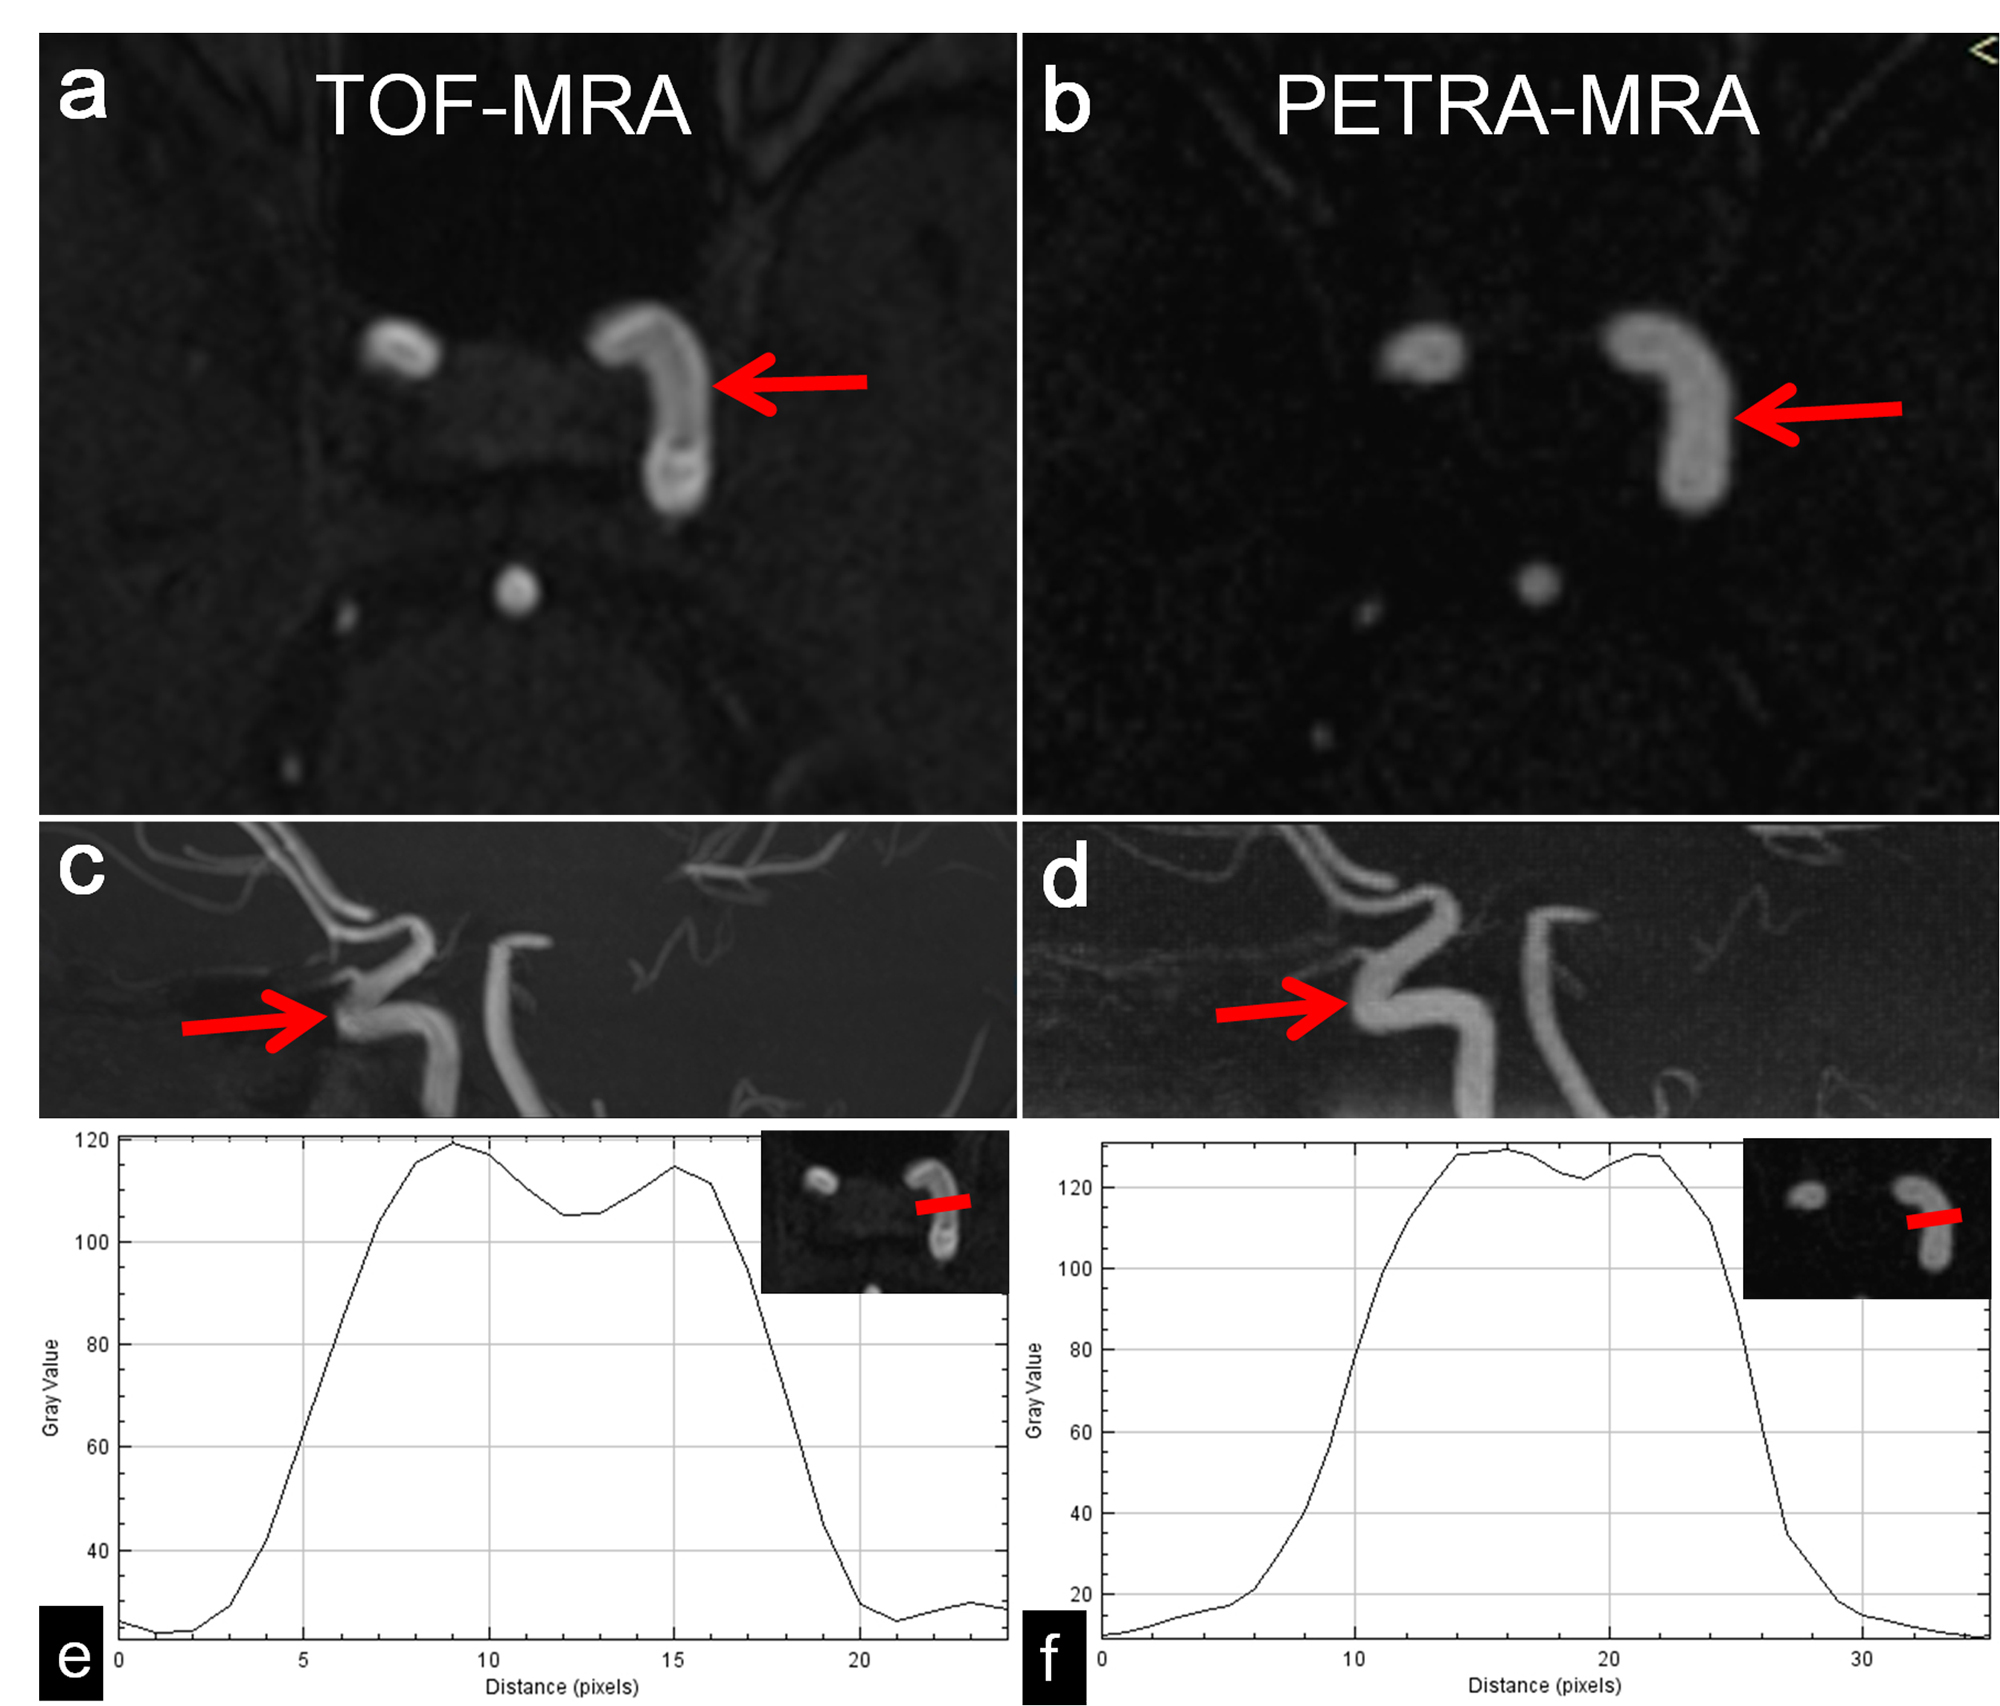
Figure 2: TOF-MRA (a, c) shows an obvious flow dephasing artifact within the ICA C4 segment, whereas PETRA-MRA (b, d) shows a very slight dephasing artifact (red arrows). The plot profile of TOF-MRA (e) shows a lower d value than that on PETRA-MRA (f) (0.90 vs. 0.95).