1071
Effect of subject-specific labelling efficiency for arterial spin labelling on cerebral blood flow in mild stroke patients1Centre for Clinical Brain Sciences, University of Edinburgh, Edinburgh, United Kingdom, 2UK DRI at the University of Edinburgh, Edinburgh, United Kingdom, 3Centre for Discovery Brain Sciences, University of Edinburgh, Edinburgh, United Kingdom, 4Department of Biomedical Physics, University of Toronto, Toronto, ON, Canada, 5Hurvitz Brain Sciences, Sunnybrook Research Institute, University of Toronto, Toronto, ON, Canada, 6Beijing Tiantan Hospital, Capital Medical University, Beijing, China
Synopsis
Accurate cerebral blood flow (CBF) quantification using arterial spin labelling (ASL) depends on physiological and MR parameters. Labelling efficiency is particularly relevant given it may vary between vascular disease patients. We determined subject-specific labelling efficiency values using phase-contrast MRI scans in a mild stroke cohort. Bland-Altman plots suggested a bias in CBF, with nominal labelling efficiency values underestimating at low and overestimating at high CBF. Using subject-specific, but not nominal, labelling efficiency showed plausible associations between white matter CBF and smoking status, pulse pressure, and age. Subject-specific labelling efficiencies appear to mitigate variance and improve CBF quantification in clinical ASL.
Introduction
Small vessel disease (SVD) is an important factor in many strokes and dementia1. Although the mechanisms are not fully elucidated cerebral haemodynamic parameters, including cerebral blood flow (CBF) and cerebrovascular reactivity, are thought to play an important role.Arterial spin labelling can quantify CBF and is becoming more common in clinical practice2. Accurate quantification depends upon various factors, including the labelling efficiency, defined as the inversion efficiency of the pulse in labelling in-flowing arterial blood water, for which a constant literature value is typically used3. However due to inter-subject variability subject-specific values derived using phase contrast MRI (PC-MRI) may be more appropriate4, especially in patients given the additional potential confounds5-6. We assessed the feasibility and effect on CBF quantification of estimating subject-specific labelling efficiency values in mild stroke patients.
Methods
We recruited 75 patients with recent mild ischaemic strokes after informed consent for an on-going study acquiring clinical, demographic, and imaging variables. MRI scans were performed on a 3T Prisma scanner (Siemens Healthcare, Germany) including a standard neurovascular imaging protocol (T1w, T2w, FLAIR and DTI), multi inversion time 3D pseudo-continuous ASL sequence (12 equally spaced TIs=500-3030ms, TR/TE=4350/20.98ms with 4 background suppression pulses7, bolus duration=1800ms, 32-channel head coil), time-of-flight scan to aid positioning and PC-MRI sequence with retrospective peripheral pulse gating to measure blood flow in the internal carotid arteries (ICAs) and vertebral arteries (VAs) (TR/TE: 19.6/5.8ms, venc: 70cm/s, 20-channel head/neck coil). The ICAs and VAs were manually segmented before processing the PC-MRI data using in-house MATLAB code to obtain the mean arterial flow8. ASL processing used FSL’s BASIL9 (1-compartment model) to obtain whole brain CBF. Subject-specific labelling efficiency values were then determined for each patient4 before calculating ASL CBF using both the nominal labelling efficiency of 0.6 (due to background suppression7) and subject-specific values through BASIL10; differences were assessed with Bland-Altman plots. Lastly, we performed multiple regression for labelling efficiency and CBF against age, pulse pressure, smoking status (1 current/previous smoker, 0 never smoked), diagnosis of hypertension, atrial fibrillation, and diabetes using the R software package.Results
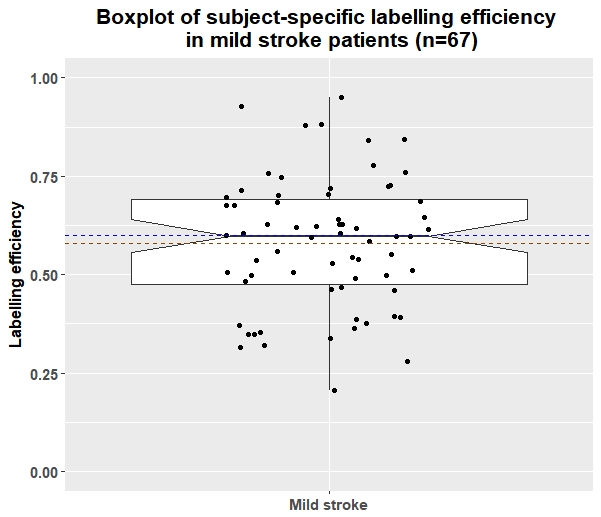
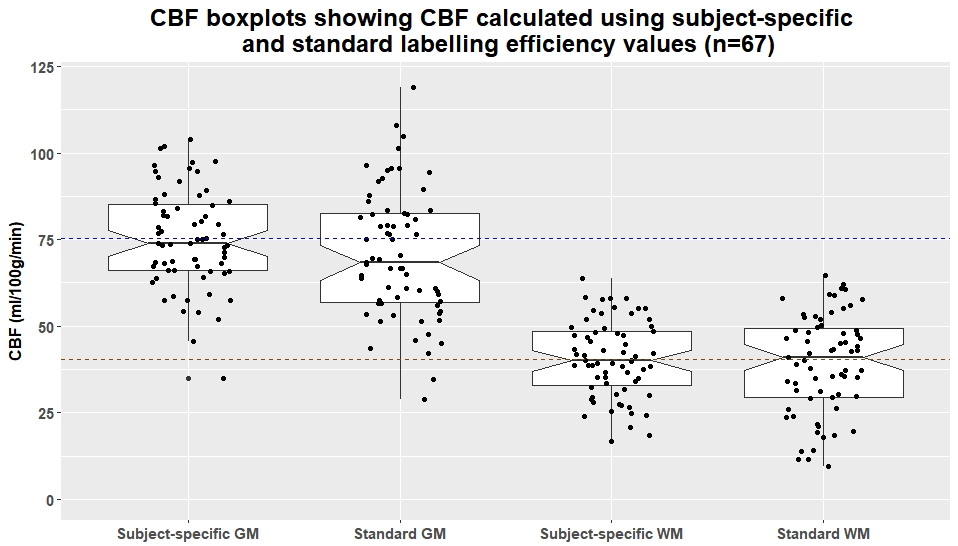
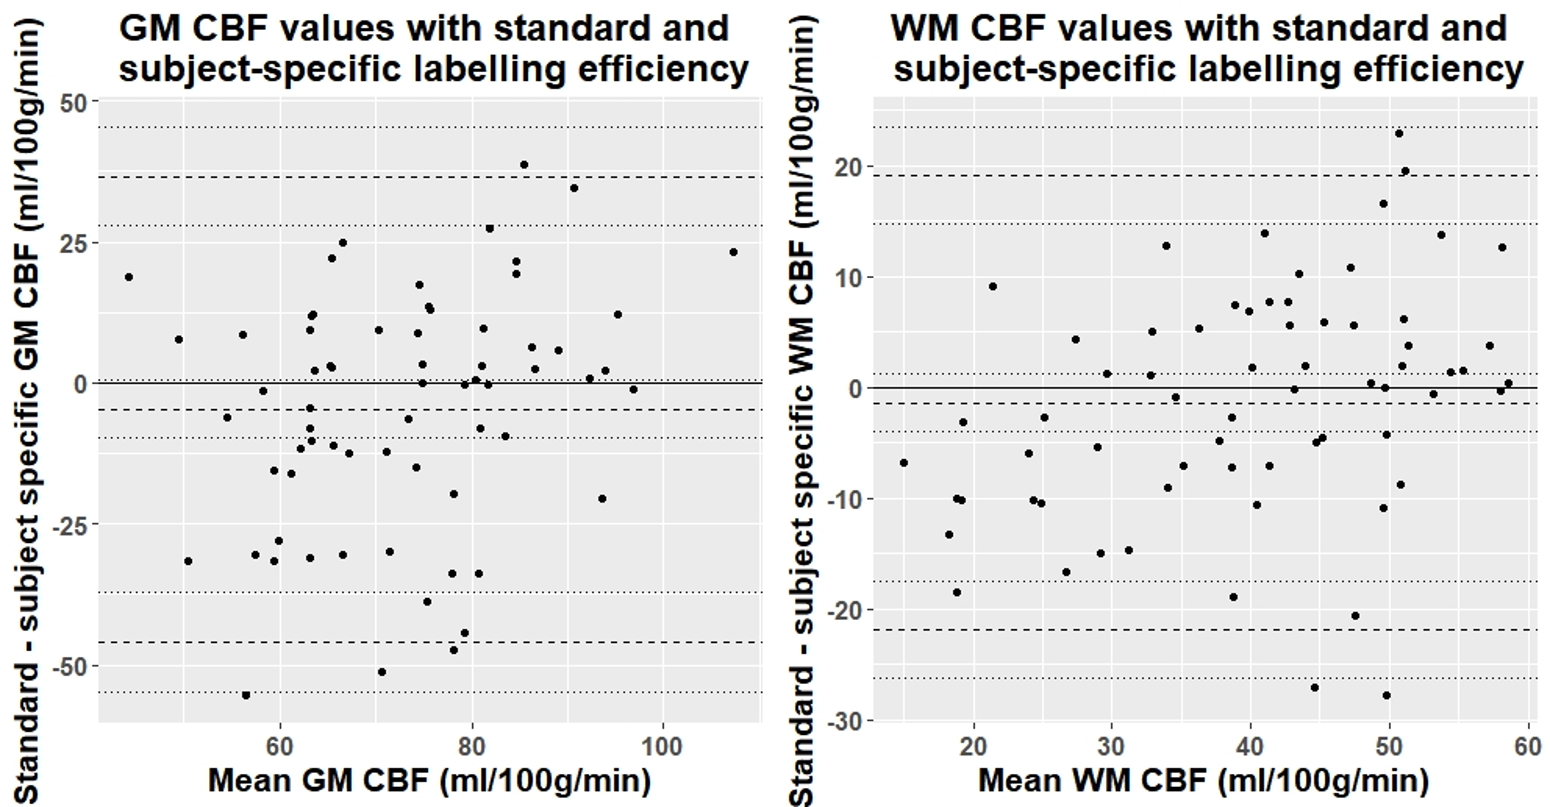
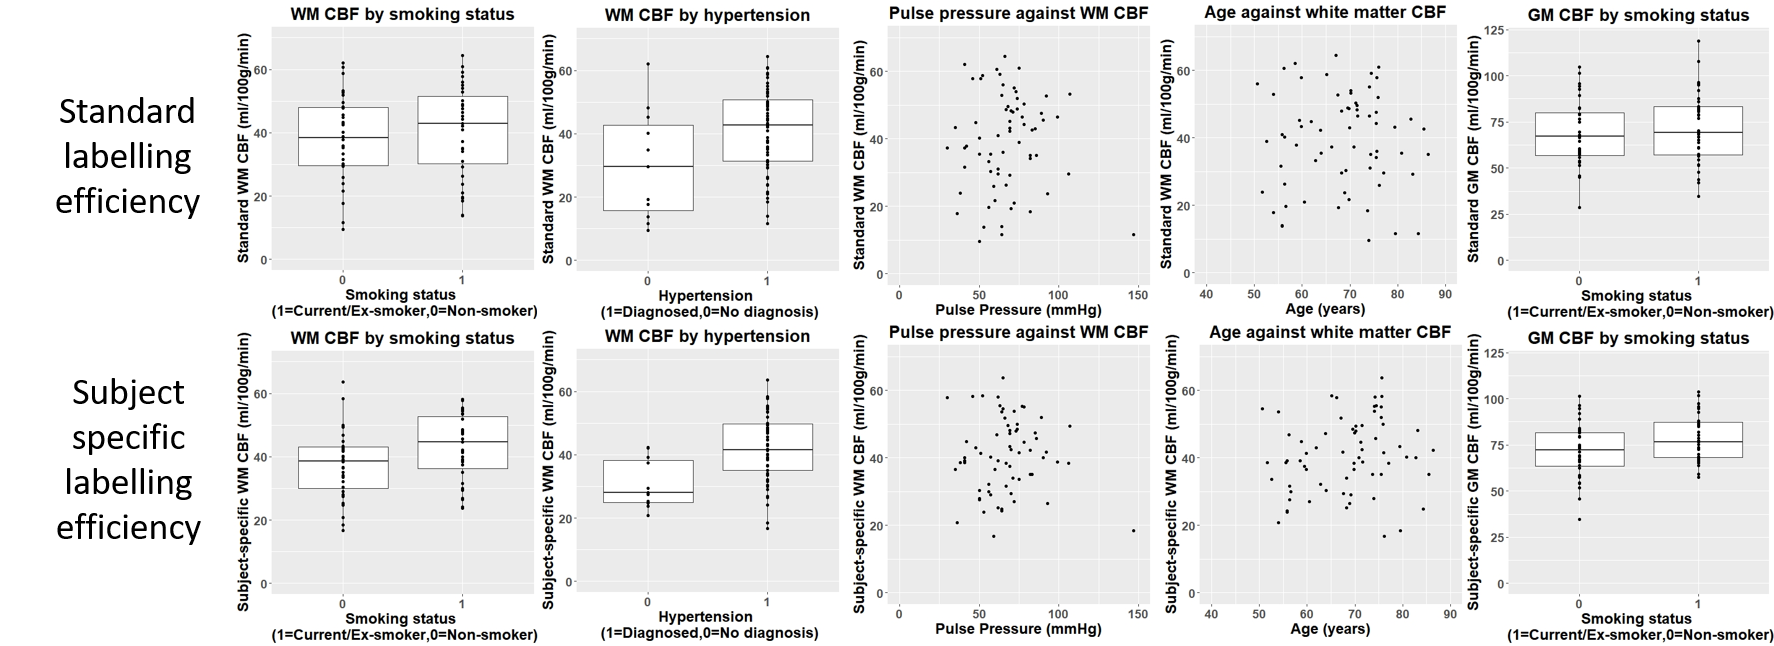
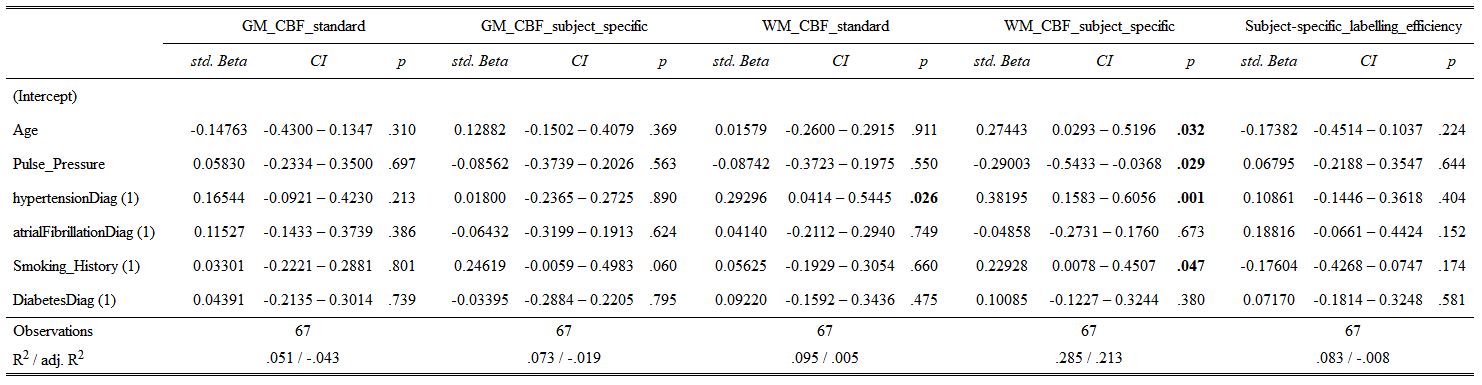
Complete data were available for 67 of the 75 patients (mean age: 68, range: 51-86, 36% female). Mean whole-brain CBF measured by PC-MRI was 50.6±10.5 ml/100g/min compared to 29±9.1 ml/100g/min using ASL before standard labelling efficiency correction. Mean subject-specific labelling efficiency was 0.58±0.17 (Figure 1, range: 0.2-0.95). Mean grey matter (GM) and white matter (WM) CBF was higher when using the subject-specific than nominal value (GM: 75.2±14.3 vs 70.6±18.5, WM: 40.5±10.9 vs 39.1±14.3 ml/100g/min), and also showed reduced variance and fewer outliers (Figure 2). Bland-Altman plots show a slight bias in WM and GM CBF calculated with the nominal versus subject-specific labelling efficiency, with lower values generally underestimated and higher values overestimated (Figure 3). No associations were seen between labelling efficiency and the clinical variables. Multiple linear regression against CBF using the nominal labelling efficiency value revealed a positive association between WM CBF and patients with hypertension (β=0.29, CI: [0.04, 0.54], p=0.026). However when calculated with subject-specific labelling efficiencies positive associations between WM CBF and hypertension (β=0.38, CI: [0.16, 0.61], p=0.001), age (β=0.27, CI: [0.03, 0.52], p=0.032), and smoking status (β=0.23, CI: [0.01, 0.45], p=0.047) emerged, while pulse pressure was negatively associated (β=-0.29, CI: [-0.54, -0.04], p=0.029) (Figure 4-5). A positive trend was also found between GM CBF and smoking status (β=0.25, CI: [-0.01, 0.50], p=0.06).Discussion
Subject-specific labelling efficiency varied across the cohort affecting thereby the calculated CBF values. The Bland-Altman plots suggest that subject-specific labelling efficiency values may help improve the accuracy of CBF estimates in this patient group, reducing variance by better controlling for inter-patient variability. Altered sensitivity to cross-sectional analyses with subject-specific labelling efficiencies complements previous findings5. Age, hypertension, pulse pressure, and smoking status are important vascular risk factor for SVD11. The positive association with age may be due to SVD burden or patient profiles, with poorer lifestyle factors, impacting vascular health12-13. Hypertension has previously been associated with reduced WM CBF14, however, intensive blood pressure lowering regimens can increase CBF making it more challenging to interpret this association in treated/untreated groups15. This effect may also contribute to a negative association with pulse pressure, not present in older treated groups16, though it is influenced by the outlier. Smoking affects cerebral perfusion via hypoperfusion amongst other mechanisms1, however, it can also elevate2 and preserve CBF17, incorporating pack-year history may help distinguish these effects. Lastly the absence of associations with subject-specific labelling efficiency may relate to the sample size or high heterogeneity in this population. Future work will aim to explore these associations in greater detail by incorporating potential confounds, particularly white matter hyperintensity burden.Conclusion
Subject-specific labelling efficiency estimation in mild stroke patients is feasible, and reveals plausible associations with WM CBF not observed when a nominal labelling efficiency value is applied. As such deriving labelling efficiency from PC-MRI data may help distinguish more subtle associations in such cohorts4-6. PC-MRI imaging is more challenging in patients with irregular heart rates and high anatomical variance5, requiring additional time therefore optimal approaches for deriving average labelling efficiency values for patient populations and alternative markers18 may be worth exploring.Acknowledgements
We acknowledge the assistance of Siemens Healthcare GmbH and Dr Josef Pfeuffer for providing the Advanced 3D ASL work-in-progress sequence. Funding is gratefully acknowledged from the Fondation Leducq (ref no. 16 CVD 05), European Union Horizon 2020 project No. 666881, ‘SVDs@Target’ and the Scottish Funding Council through the Scottish Imaging Network, A Platform for Scientific Excellence (SINAPSE) Collaboration and their Postdoctoral and Early Career Researcher Exchanges scheme. We also thank the participants, radiographers and professional support staff for their involvement in this work.References
1. Wardlaw JM, Smith C, et al. Small vessel disease: mechanisms and clinical implications. Lancet Neurol. 2019;18(7):684-696.
2. Grade M, Hernandez Tamames JA, et al. A neuroradiologist’s guide to arterial spin labeling MRI in clinical practice. Neuroradiol. 2015;57(12):1181-1202.
3. Alsop DC, Detre JA, et al. Recommended implementation of arterial spin-labeled perfusion MRI for clinical applications: A consensus of the ISMRM perfusion study group and the European consortium for ASL in dementia. 2015;73(1):102-116.
4. Aslan S, Xu F, et al. Estimation of labelling efficiency in pseudo-continuous arterial spin labelling. Magn Reson Med. 2010;63(3):765-771.
5. Robertson AD, Matta G et al. Temporal and Spatial Variances in Arterial Spin-Labeling Are Inversely Related to Large-Artery Blood Velocity. Am J Neuroradiol. 2017;28(8)1555-1561.
6. Juttukonda MR, Jordan LC, et al. Cerebral hemodynamics and pseudo-continuous arterial spin labeling considerations in adults with sickle cell anemia. NMR Biomed. 2017;30(2).
7. Vidorreta M, Wang Z, et al. Comparison of 2D and 3D single-shot ASL perfusion fMRI sequences. NeuroImage. 2013;66:662-671.
8. Shi Y, Thrippleton MJ, et al. Small vessel disease is associated with altered cerebrovascular pulsatility but not resting cerebral blood flow. J Cereb Blood Flow Metab. 2018: 271678X18803956.
9. Chappell MA, Groves AR, et al. Variational Bayesian inference for a nonlinear forward model. IEEE Trans Signal Process. 2009;57(1):223-236.
10. Chappell MA, MacIntosh BJ, et al. Partial volume correction of multiple inversion time arterial spin labelling MRI data. Magn Reson Med. 2011;65(4):1173-1183.
11. Staals J, Makin SDJ, et al. Stroke subtype, vascular risk factors, and total MRI brain small-vessel disease burden. Neurol. 2014;83(14):1228-1234.
12. Backhouse EV, McHutchison CA, et al. Early Life Risk Factors for Stroke and Cognitive Impairment. Curr Epidemiol Rep. 2015;2(3):172-179.
13. McHutchison CA, Chappell FM, et al. Stability of Estimated Premorbid Cognitive Ability over Time after Minor Stroke and Its Relationship with Post-Stroke Cognitive Ability. Brain Sci. 2019;9(5):117.
14. Wang T, Li Y, et al. Reduced perfusion in normal-appearing white matter in mild to moderate hypertension as revealed by 3D pseudocontinuous arterial spin labeling. J Magn Reson Imaging. 2016;43(3):635-643.
15. Tryambake D, He Jiabao, et al. Intensive Blood Pressure Lowering Increases Cerebral Blood Flow in Older Subjects With Hypertension. Hypertension. 2013;61:1309-1315.
16. Foster-Dingley JC, Moonen JEF, et al. Blood Pressure Is Not Associated With Cerebral Blood Flow in Older Persons. Hypertension. 2015;66:954-960.
17. Elbejjani M, Auer R, et al. Cigarette smoking and cerebral blood flow in a cohort of middle-aged adults. J Cereb Blood Flow Metab. 2018:39(7):1247-1257.
18. Ostergaard L, Engedal TS, et al. Cerebral small vessel disease: Capillary pathways to stroke and cognitive decline. J Cereb Blood Flow Metab. 2016:36(2):302-325.
Figures