1070
Using Deep Learning to Predict PET Cerebrovascular Reserve in Moyamoya Disease from Baseline MRI1Radiology, Stanford University, Palo Alto, CA, United States, 2Medical Imaging, Shuang Ho Hospital, Taipei Medical University, New Taipei City, Taiwan, 3Neurosurgery, Tokyo Medical and Dental University, Tokyo, Japan
Synopsis
Cerebrovascular reserve (CVR) is an important hemodynamic parameter for moyamoya disease. Acetazolamide (ACZ) test is often used to measure CVR clinically. However, ACZ is contraindicated in patients with sulfa allergies, severe kidney and liver disease and potentially has severe adverse side effect. Thus, there is a need to assess CVR without pharmacological vasodilation. We utilized a simultaneous [15O]-water PET/MRI dataset to train a convolutional neural network (CNN) to predict CVR. The CNN combined multi-contrast information from baseline perfusion and structural images to predict whole-brain PET-level CVR, with high image quality, quantification accuracy, and diagnostic accuracy for identifying impaired CVR.
Introduction
Cerebrovascular reserve (CVR) is an important prognostic factor for moyamoya disease1. Clinically, CVR is commonly measured using paired cerebral blood flow (CBF) measurements before and after a vasodilating drug, typically acetazolamide (ACZ)2. However, ACZ is contraindicated in patients with sulfa allergies, or severe kidney and liver disease and potentially has severe adverse side effect2. Furthermore, “cerebrovascular steal” could happen in brain regions with impaired CVR during ACZ test, increasing the risk of stroke-like event and unsettling to the patient. The ability to assess CVR without the need for ACZ injection is thus of high value to clinical evaluation in cerebrovascular patients. Several studies have shown baseline perfusion parameters significantly correlate with CVR3,4. However, due to cerebral autoregulation, relationship between baseline perfusion parameters and CVR was not always linear5. Furthermore, multiple other factors, such as collateral flows, old stroke, and location in the brain, could also affect CVR6,7. Deep learning provides us a potential method to construct a non-linear model, taking multi-contrasts perfusion and structural images as inputs, to predict CVR, without the need for pharmacological vasodilation.Methods
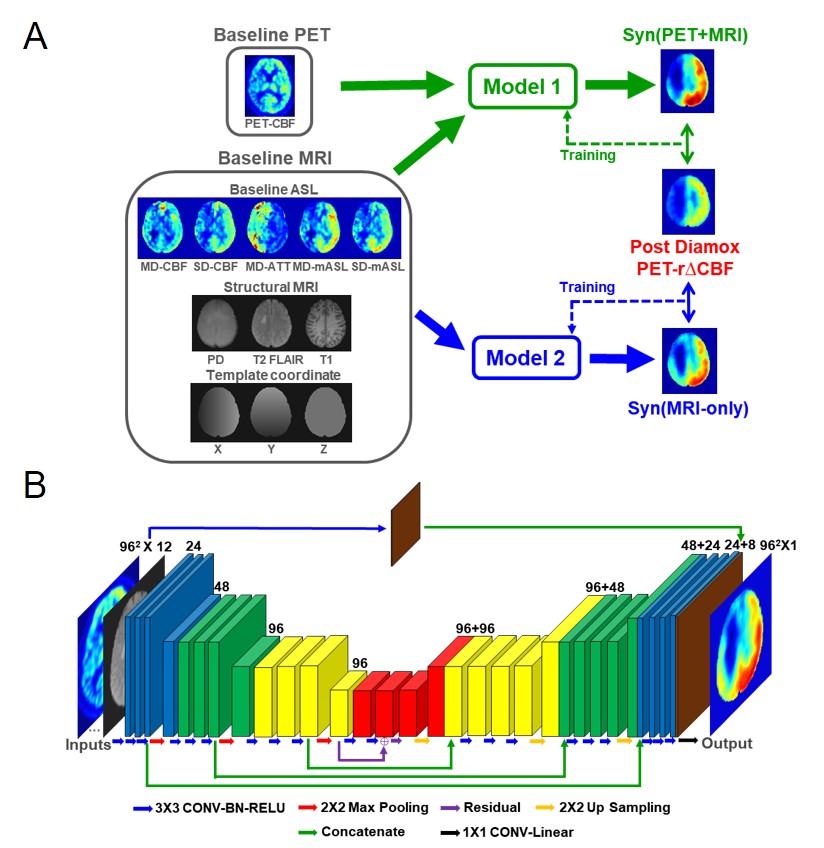
Subject information: Simultaneous [15O]-water PET/MRI was acquired to assess CBF in 24 moyamoya patients (age, 40.7 ± 12.4 years; gender, 7 males) and 12 healthy controls (38.7 ± 16.1 years; 3 males) before and after ACZ injection.Image acquisition and processing: The perfusion images included a single-delay ASL8 with labeling duration (LD) = 1.45s and post-labeling delay (PLD) = 2.025s, and a Hadamard-encoded multi-delay ASL9 with effective LD = 1.7s and effective PLD = 0.3/2/3.7s, and a phase contrast MRI scan (PC-MRI). ASL-CBF maps were quantified with a one-tissue compartment model for SD-ASL10; and CBF and ATT maps were quantified with a two-tissue compartment model for MD-ASL11. PET-CBF was calculated using PC-PET method12. Structural images included 3D high-resolution T1 and T2 FLAIR images. All images were co-registered and normalized to a MNI template13.
Model implementation: We constructed two convolutional neural networks (CNNs) (Figure 1) to predict the relative change in perfusion (r∆CBF) due to vasodilation. One model (PET-plus-MRI model) used multiple baseline (i.e., pre-ACZ) PET and MR contrasts as inputs, while the other model (MRI-only model) used only baseline MR contrasts, to predict the whole-brain voxelwise synthesized r∆CBF (Syn-r∆CBF).The PET contrast included PET-CBF map. The MR contrasts included perfusion images (CBF, arterial transit time, mean ASL), structural scans (T2-FLAIR, T1) and brain location using a template system. The CNNs were trained on the ground truth (PET-r∆CBF) and tested on the 36 studies with 6-fold cross-validation.
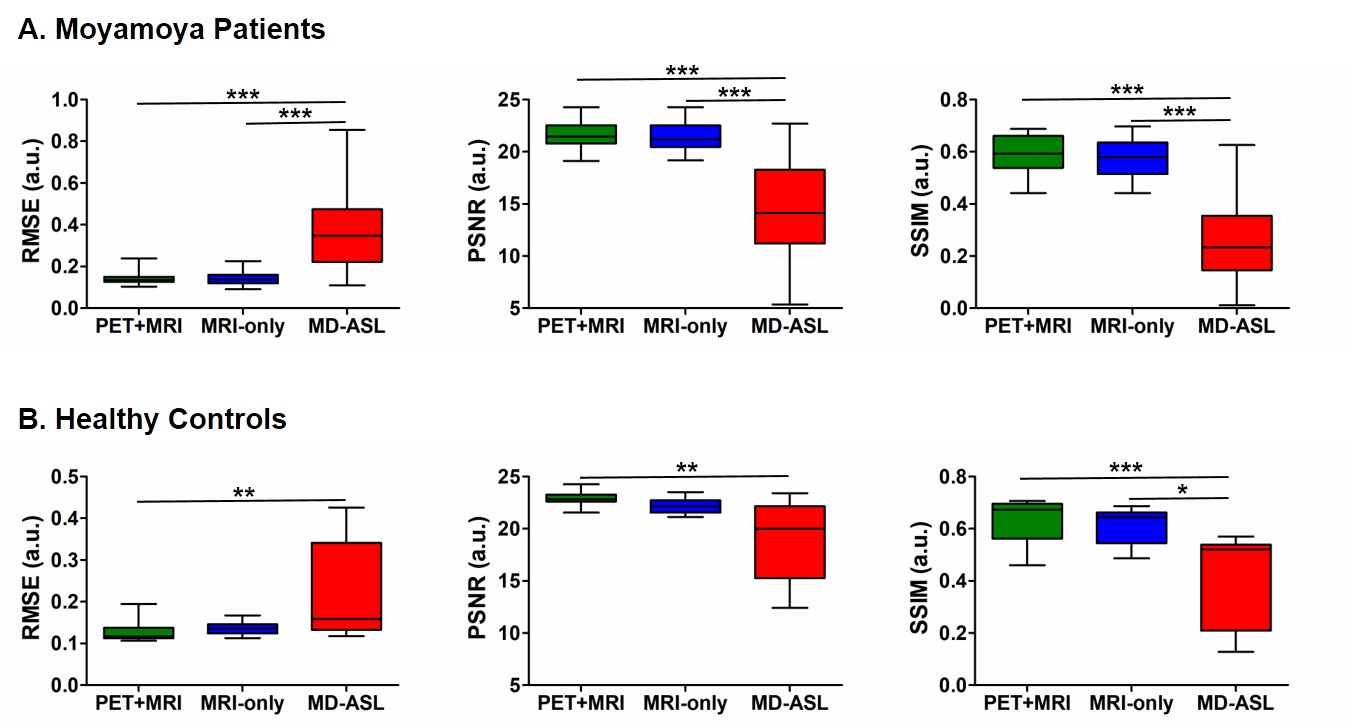
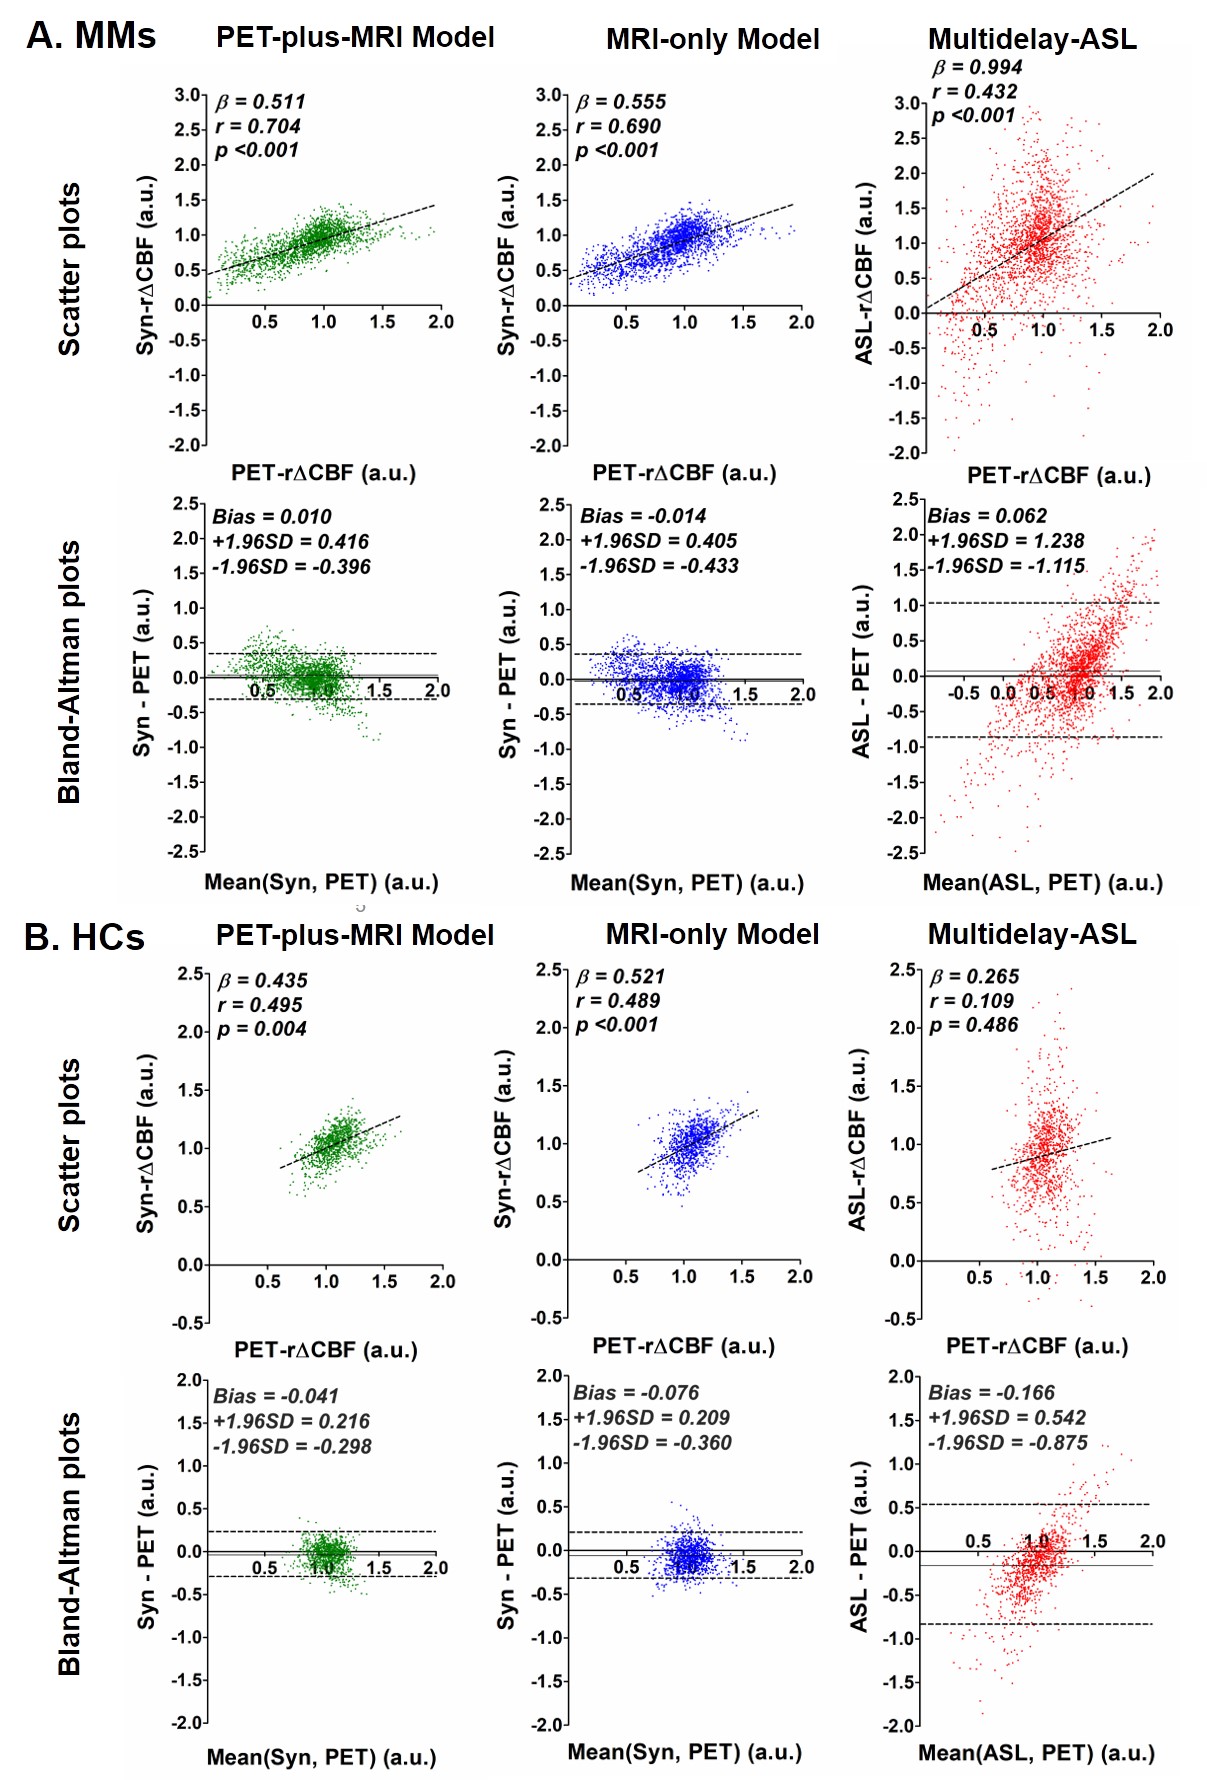
Assessment of image quality and quantification accuracy: Image quality was evaluated with peak signal-to-noise ratio (PSNR), root mean squared error (RMSE), and structure similarity index (SSIM). Mean r∆CBF was calculated within 90 regions of interest (ROIs) from the AAL2 template14 for whole cerebrum analysis. Syn-r∆CBF and ASL-r∆CBF were compared to the PET reference with correlation and Bland-Altman analyses.
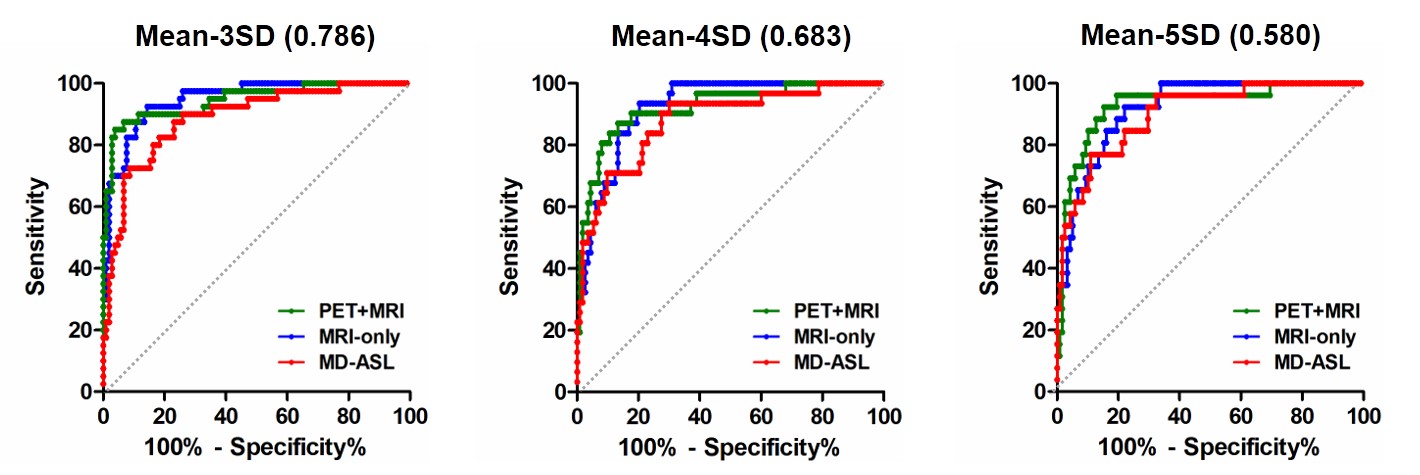
Diagnostic accuracy in identifying impaired r∆CBF: Mean r∆CBF was calculated within 3 vascular territories per hemisphere based on ASPECTS15. Multiple thresholds of impaired PET-r∆CBF were defined, as 3 standard deviation (SD), 4SD and 5SD below the mean PET-r∆CBF of the healthy controls. The receiver operating characteristic curve (ROC) was used to evaluate the diagnostic accuracy of Syn-r∆CBF and ASL-r∆CBF in identifying impaired PET-r∆CBF vascular territories.
Results
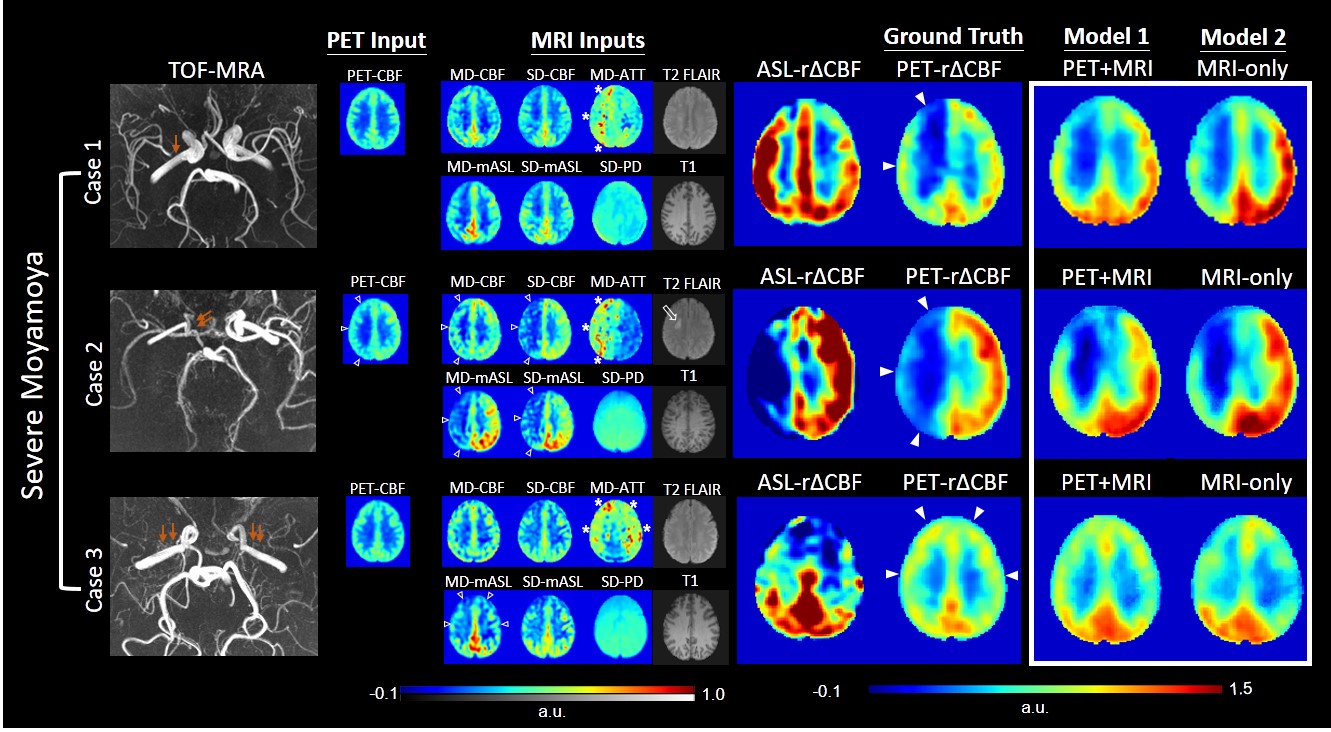
Figure 2 demonstrates three representative cases of moyamoya patients. By visual inspection, Syn-r∆CBF from both models show higher image quality than ASL-r∆CBF and similar to PET-r∆CBF. It was supported by the image quality assessment. Both models had significantly higher PSNR, SSIM and lower RMSE than ASL in both moyamoya patients and healthy controls (Figure 3). Although both models and ASL showed significant correlation with PET-r∆CBF (Figure 4), the correlation coefficients of both models were significantly higher than that of ASL (both p<0.001). Furthermore, on Bland-Altman plots, Syn-r∆CBF from both models showed less bias and reduced variance than ASL, which showed a proportional bias to r∆CBF values (Figure 4). Both models demonstrated higher area under the ROC curve (AUC) than ASL for multiple thresholds (Figure 5). AUC/sensitivity/specificity for identifying impaired PET-r∆CBF vascular territories were 0.945/85.0%/96.2% for PET-plus-MRI model, 0.948/92.5%/85.6% for MRI-only model, and 0.888/87.5%/76.9% for ASL at the threshold of 3SD below mean of normal PET-r∆CBF. Finally, PET-plus-MRI and MRI-only models did not performed differently in imaging quality, quantification accuracy and diagnostic accuracy for identifying impaired PET-r∆CBF.Discussion and Conclusion
We demonstrate that CNN models can combine multi-contrast information from baseline perfusion and structural images to predict PET-r∆CBF and with significantly higher image quality, quantification accuracy, and diagnostic accuracy for identifying CVR impairment than ASL-r∆CBF. Moreover, MRI-only model performs the same as PET-plus-MRI model. Therefore, CNN allows the prediction of PET-based CVR in moyamoya patients using only MRI and without injecting ACZ, enabling accurate CVR measurements in routine MRI settings. The ability to assess PET-CVR without the need for pharmacological vasodilation and radiotracers is of high value to the clinical evaluation in chronic cerebrovascular patients. It could enable the earlier identification of patients with abnormal CVR and allow them to optimize their medical management and modify their risk factors so as to prevent the occurrence of ischemic stroke.Acknowledgements
The first author (DYC) of the work is partially supported by Ministry of Science and Technology, Taiwan (MOST 107-2634-F-038-001, MOST 106-5420-011-300)References
1. Derdeyn, C. P., Grubb, R. L. & Powers, W. J. Cerebral hemodynamic impairment: methods of measurement and association with stroke risk. Neurology 53, 251–259 (1999).
2. Vagal, A. S., Leach, J. L., Fernandez-Ulloa, M. & Zuccarello, M. The acetazolamide challenge: techniques and applications in the evaluation of chronic cerebral ischemia. AJNR Am J Neuroradiol 30, 876–884 (2009).
3. Kawano, T. et al. Prolonged Mean Transit Time Detected by Dynamic Susceptibility Contrast Magnetic Resonance Imaging Predicts Cerebrovascular Reserve Impairment in Patients with Moyamoya Disease. Cerebrovasc. Dis. 42, 131–138 (2016).
4. Choi, H. J. et al. Can Arterial Spin-Labeling with Multiple Postlabeling Delays Predict Cerebrovascular Reserve? AJNR Am J Neuroradiol 39, 84–90 (2018).
5. Juttukonda, M. R. & Donahue, M. J. Neuroimaging of vascular reserve in patients with cerebrovascular diseases. Neuroimage 187, 192–208 (2019).
6. Mori, N. et al. The leptomeningeal ‘ivy sign’ on fluid-attenuated inversion recovery MR imaging in Moyamoya disease: a sign of decreased cerebral vascular reserve? AJNR Am J Neuroradiol 30, 930–935 (2009).
7. Bhogal, A. A. et al. Examining the regional and cerebral depth-dependent BOLD cerebrovascular reactivity response at 7T. Neuroimage 114, 239–248 (2015).
8. Dai, W., Garcia, D., de Bazelaire, C. & Alsop, D. C. Continuous flow-driven inversion for arterial spin labeling using pulsed radio frequency and gradient fields. Magn Reson Med 60, 1488–1497 (2008).
9. Dai, W., Shankaranarayanan, A. & Alsop, D. C. Volumetric measurement of perfusion and arterial transit delay using hadamard encoded continuous arterial spin labeling. Magn Reson Med 69, 1014–1022 (2013).
10. Alsop, D. C. et al. Recommended implementation of arterial spin-labeled perfusion MRI for clinical applications: A consensus of the ISMRM perfusion study group and the European consortium for ASL in dementia. Magn Reson Med 73, 102–116 (2015).
11. Dai, W., Robson, P. M., Shankaranarayanan, A. & Alsop, D. C. Reduced resolution transit delay prescan for quantitative continuous arterial spin labeling perfusion imaging. Magn Reson Med 67, 1252–1265 (2012).
12. Ishii, Y. et al. Simultaneous phase-contrast MRI and PET for noninvasive quantification of cerebral blood flow and reactivity in healthy subjects and patients with cerebrovascular disease. Journal of Magnetic Resonance Imaging 0,.
13. Mazziotta, J. et al. A probabilistic atlas and reference system for the human brain: International Consortium for Brain Mapping (ICBM). Philos Trans R Soc Lond B Biol Sci 356, 1293–1322 (2001).
14. Rolls, E. T., Joliot, M. & Tzourio-Mazoyer, N. Implementation of a new parcellation of the orbitofrontal cortex in the automated anatomical labeling atlas. NeuroImage 122, 1–5 (2015).
15. Barber, P. A., Demchuk, A. M., Zhang, J. & Buchan, A. M. Validity and reliability of a quantitative computed tomography score in predicting outcome of hyperacute stroke before thrombolytic therapy. ASPECTS Study Group. Alberta Stroke Programme Early CT Score. Lancet 355, 1670–1674 (2000).
Figures