1068
Cerebrovascular reactivity mapping using resting-state fMRI: comparison with CO2-inhalation method in 170 controls and 50 Moyamoya patients
Gongkai Liu1, Hanzhang Lu1, Yang Li1, Binu Thomas2, Marco Pinho2, Judy Huang1, Babu G. Welch2, Denise C. Park3, and Peiying Liu1
1Department of Radiology, Johns Hopkins University School of medicine, Baltimore, MD, United States, 2University of Texas Southwestern Medical Center, Dallas, TX, United States, 3The University of Texas at Dallas, Dallas, TX, United States
1Department of Radiology, Johns Hopkins University School of medicine, Baltimore, MD, United States, 2University of Texas Southwestern Medical Center, Dallas, TX, United States, 3The University of Texas at Dallas, Dallas, TX, United States
Synopsis
Cerebral vascular reserve, which indicates the potential of the tissue to receive more blood flow when needed, is desired to evaluate the ischemic risk of brain tissue. However, it is cumbersome to measure vascular reserve using the current methods with Diamox or hypercapnia challenges. Therefore there is a growing interest in using resting-state MRI data to measure cerebrovascular reactivity (CVR). Here, using CO2-inhalation MRI as a gold standard and capitalizing on a large cohort of healthy controls (N=170) and Moyamoya patients (N=50), we sought to identify the optimal strategies for resting-state CVR mapping and establish benchmarks for this new technique.
INTRODUCTION:
An essential task in the diagnosis of cerebrovascular disease is to evaluate the ischemic risk of brain tissue. Currently, ischemia is detected using CT/MRI/SPECT by examining the blood flow in the brain. However, the brain has a compensatory mechanism, known as “autoregulation,” which aims to maintain the blood flow to be constant, which, ironically, will make the ischemia harder to detect using cerebral blood flow (CBF). Therefore, a better way to evaluate the ischemic risk of brain tissue is to measure the cerebral vascular reserve, which indicates the potential of the tissue to receive more blood flow when demands call for it. However, even though this method provides a better result, it is cumbersome to measure vascular reserve using the current methods. One would need to either inject some drugs such as Diamox or have the subject inhale carbon dioxide gas1. Therefore there is a growing interest in using resting-state MRI data to measure cerebrovascular reactivity (CVR) by exploiting the natural variations in respiration and CO2 level2-4. While some proof-of-principle studies have been reported, there still exist controversies as to the best analysis methods and the success rate of resting-state based CVR. Here, using CO2-inhalation MRI as a gold standard and capitalizing on a large cohort of healthy controls (N=170) and Moyamoya patients (N=50), we sought to identify the optimal strategies for resting-state CVR mapping and establish benchmarks for this new technique.METHODS:
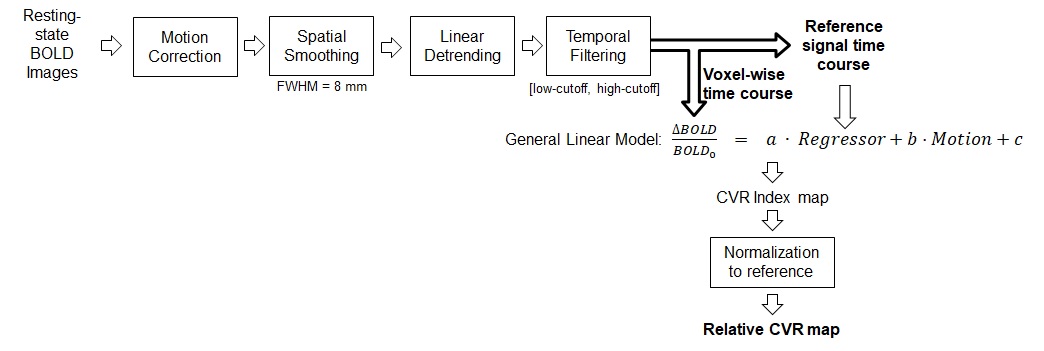
Study 1: Optimization of resting-state CVR analysis. In resting-state CVR mapping, global BOLD signal is used as a surrogate of fluctuations in arterial CO2 and used as the regressor in CVR calculation4. However, global fluctuation in BOLD MRI signal is known to be attributed to several factors other than arterial CO2. Therefore, we conducted Study 1 to identify the optimal frequency range in which the resting-state CVR method yields the most consistent results with the gold standard CVR map obtained with CO2-inhalation. In this study, 170 healthy subjects (age range 20-89yrs, 65 males) underwent both a 5min resting-state BOLD scan and a 7min CO2-inhalation BOLD scan with identical imaging parameters (single-shot gradient-echo EPI, TR/TE=2000/25ms, Field-of-view (FOV) 220×220x150mm3, voxel size 3.4×3.4×3.5mm3). Processing pipeline for the resting-state data is illustrated in Figure 1. Briefly, the resting-state BOLD fMRI data were motion-corrected, smoothed, and detrended, and then band-pass filtered to different frequency ranges (low-cutoff frequency=[0, 0.01x1.25n-1 Hz], and high-cutoff=[0.01, 0.01x1.25n Hz], with n=1,…,14). For each frequency range, a general linear model (GLM) analysis was performed using the whole-brain BOLD signal as independent variable and the voxel-wise BOLD signal as dependent variable, with motion vectors as covariates, to obtain the resting-state CVR map. The resting-state CVR map was then compared with the CO2 CVR map obtained following standard CO2-inhalation CVR analysis pipeline1. The frequency range which yielded the highest spatial correlation between the two CVR maps was identified as the optimal frequency range.Study 2: Validation in Moyamoya patients. In this study, we validated the optimized resting-state CVR mapping with CO2-inhalation CVR mapping in a separate clinical cohort. 50 patients with Moyamoya Disease, an arterial stenotic disease, underwent a resting-state BOLD scan and a CO2-inhalation BOLD scan. Resting-state and CO2 CVR maps were obtained for each patient following the methods described above. In these patients, we used cerebellum gray matter as the reference region for global signal calculation because anterior and middle brain circulations are often affected by the disease while the posterior circulation is usually preserved. Spatial correlation between the two CVR maps was calculated for each patient.
RESULTS and DISCUSSION:
Study 1: Figure 2 shows the group-averaged spatial correlation coefficients (r) between the resting-state and CO2 CVR maps across all 170 subjects using 120 different frequency ranges. It was found that the highest spatial correlation (r=0.7398) was obtained with a filter frequency of [0, 0.1164 Hz]. Interestingly, the optimal frequency range we identified is also the typical range that is used in functional connectivity analysis5. Therefore, our results suggest that spontaneous fluctuations in breathing pattern may play a significant role in the global signal fluctuations in this frequency range. When using an r of 0.5 as threshold, it was found that 94% of the subject had usable resting-state CVR map. Figure 3 shows six representative resting-state CVR maps that had an r value (relative to CO2-inhalation CVR) ranging from 0.35 to 0.85.Study 2: Figure 4 shows resting-state CVR maps in several Moyamoya patients with different extent of arterial stenosis, using the optimum frequency range. The resting CVR maps were found to have sufficient quality to detect deficits in vascular reserve. Figure 5 shows the histogram of correlation coefficients in all patients. 37 out of 50 patients had r>0.5, corresponding to a success rate of 74% in obtaining usable CVR maps from resting-state BOLD data in a typical clinical cohort. The unsuccessful cases could be attributed to larger effects of other factors (e.g., motion, cardiac/respiratory phases) in their reference BOLD signals.
CONCLUSION:
CVR mapping using resting-state BOLD fMRI provides a task-free method to measure vascular reserve. The present study identified optimal analysis strategies and demonstrated its performance in a typical clinical cohort. Resting-state based CVR mapping may be useful in patients with cerebrovascular diseases.Acknowledgements
No acknowledgement found.References
- Liu P, De Vis JB, Lu H. Cerebrovascular reactivity (CVR) MRI with CO2 challenge: A technical review. Neuroimage. 2018;doi: 10.1016/j.neuroimage.2018.03.047.
- Golestani AM, Chang C, Kwinta JB, Khatamian YB, Chen JJ. Mapping the end-tidal CO2 response function in the resting-state BOLD fMRI signal: spatial specificity, test-retest reliability and effect of fMRI sampling rate. Neuroimage. 2015;104: 266-277.
- Jahanian H, Christen T, Moseley ME, Pajewski NM, Wright CB, Tamura MK, Zaharchuk G, Group, S.S.R. Measuring vascular reactivity with resting-state blood oxygenation level-dependent (BOLD) signal fluctuations: A potential alternative to the breath-holding challenge? J Cereb Blood Flow Metab. 2017;37:2526-2538.
- Liu P, Li Y, Pinho M, Park DC, Welch BG, Lu H. Cerebrovascular reactivity mapping without gas challenges. Neuroimage. 2017;146:320-326.
- Damoiseaux JS, Rombouts SA, Barkhof F, Scheltens P, Stam CJ, Smith SM, Beckmann CF. Consistent resting-state networks across healthy subjects. Proc Natl Acad Sci USA. 2006;103(37):13848-53.
Figures
Figure
1. Illustration of the resting-state CVR analysis pipeline.
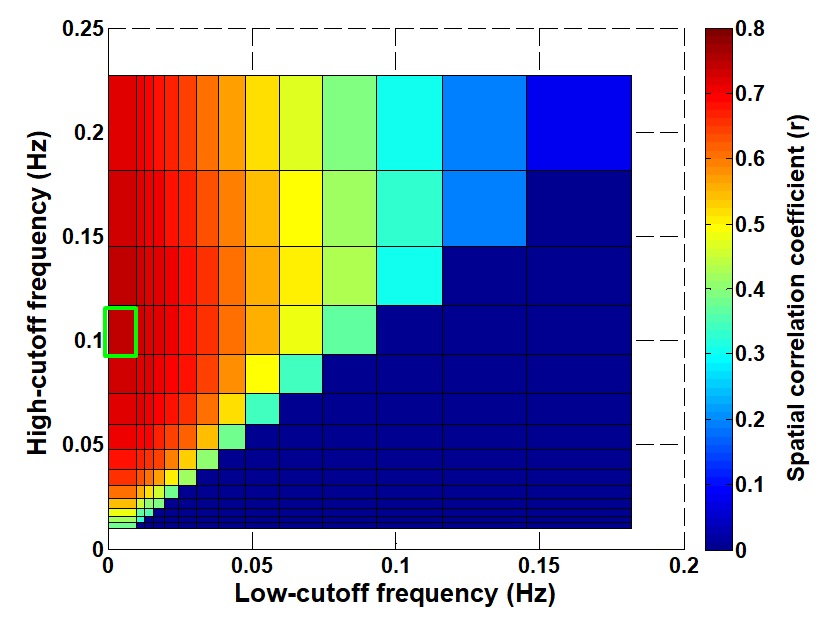
Figure 2: Color plot of
correlation coefficients (r) between resting-state CVR and CO2-inhalation CVR
maps using different filtering frequencies. The green box indicates the highest
correlation coefficient at [0, 0.1164Hz].
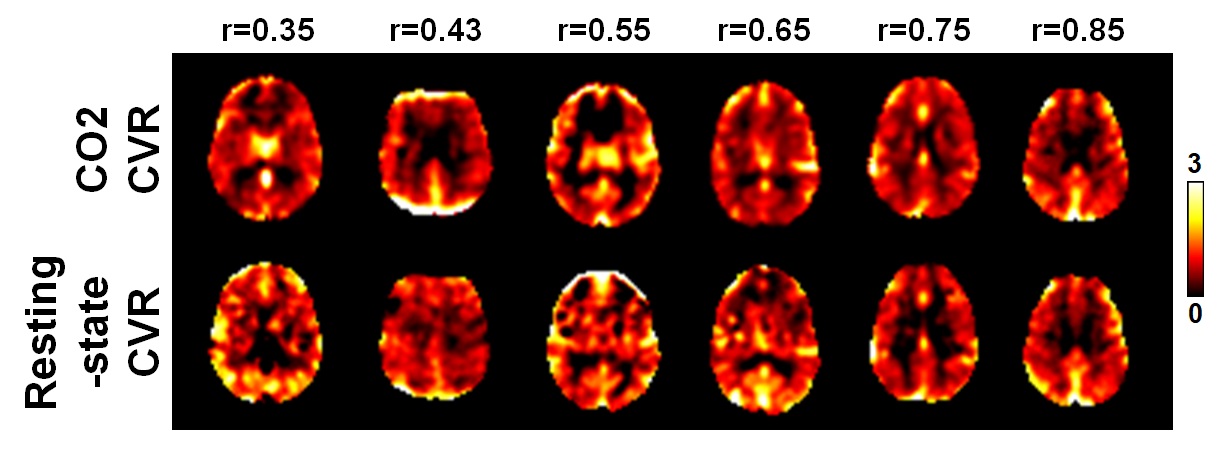
Figure 3: Representative
CVR maps from the healthy subjects with different spatial correlation (r)
between the resting-state and CO2-inhalation results.
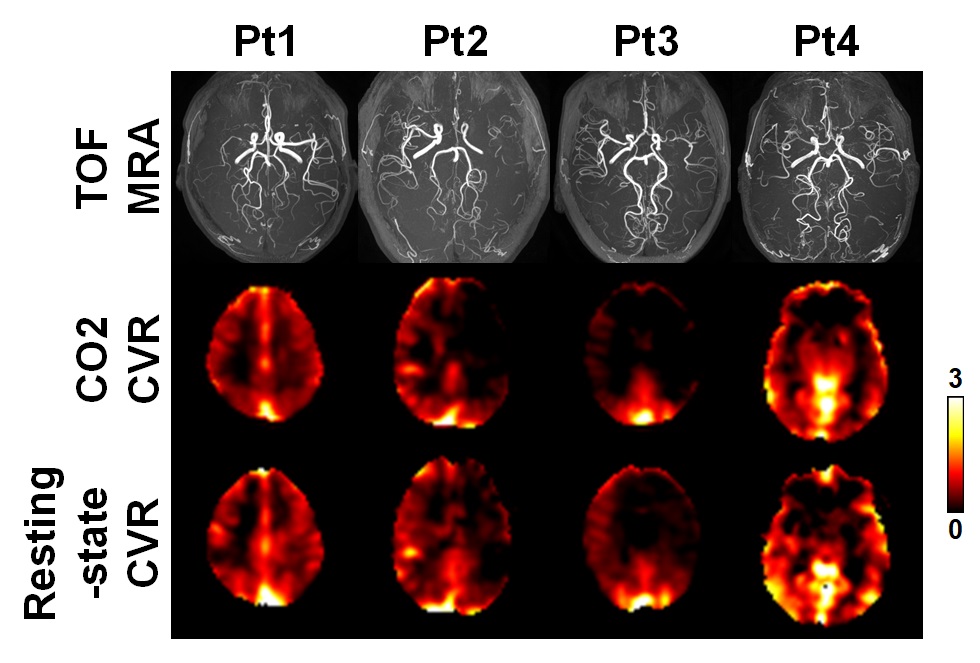
Figure 4: Comparison
between resting-state CVR maps and CO2-inhalation-derived CVR maps in Moyamoya
patients. (TOP) TOF-MRA of each patient shows stenosis in anterior and middle
cerebral arteries. (MIDDLE) CO2-CVR maps shows deficits in different brain
areas. (BOTTOM) Resting CVR maps demonstrate a similar deficit pattern as in
CO2-CVR maps.
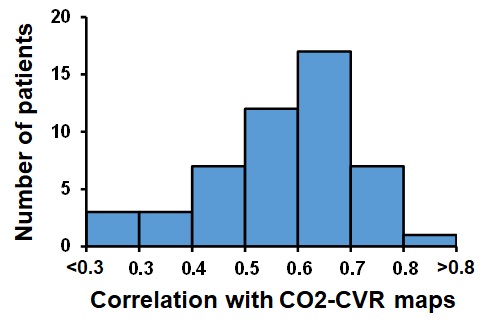
Figure 5: Histogram of the
spatial correlations (r) between resting-state CVR and CO2-CVR maps in 50
Moyamoya patients.