1056
A Comparative Analysis of CEST-APT, SWI-QSM, DWI and ASL-CBF in Ischemic Stroke Patients
Guomin Li1, Hui Liu2, Qi Liu2, Yongquan Ye2, Yichen Hu2, Haodong Qin3, Jun Xie3, Jianhao Yan4, Yang Xin3, and Guihua Jiang4
1Medical Imaging, Guangdong Second Provincial General Hospital, Guangzhou, China, 2UIH America, Inc., Houston, TX, United States, 3United Imaging Healthcare, Shanghai, China, 4Guangdong Second Provincial General Hospital, Guangzhou, China
1Medical Imaging, Guangdong Second Provincial General Hospital, Guangzhou, China, 2UIH America, Inc., Houston, TX, United States, 3United Imaging Healthcare, Shanghai, China, 4Guangdong Second Provincial General Hospital, Guangzhou, China
Synopsis
In this study, APT, SWI-QSM, ASL-CBF, and DWI imaging are compared and evaluated in stroke patients, with a focus on different values in identifying diseased area and helping to provide better prognosis.
INTRODUCTION
Ischemic and hemorrhagic stroke are two major types of stroke, one of the leading causes of death in the world. Non-radioactive multi-modal MRI techniques, such as APT (Amide Proton Transfer), SWI-QSM (Susceptibility-weighted imaging-Quantitative susceptibility mapping), and ASL-CBF (Arterial Spin Labeling-Cerebral Blood flow) and DWI-ADC (Diffusion weighted imaging-Apparent Diffusion Coefficient) have been increasingly used to help with early diagnosis and treatment planning for stroke patients. APT imaging is sensitive to pH changes associated with ischemic stroke [1]. ASL has demonstrated benefits in identifying blood flow deficit [2]. SWI and QSM are sensitive to magnetic susceptibility change caused by bleeding [3]. Despite wide interests in the above techniques, few efforts have been made to compare them in ischemic stroke at the same time. In this study, APT, SWI&QSM, and ASL imaging are compared and evaluated in stroke patients, with a focus on different values in identifying disease areas.METHODS
A total of 17 patients with stroke (5 acute ischemia, 12 subacute ischemia were enrolled after written consent and IRB approval. The patients were divided into hyperacute (< 12 hours), acute ( 13–72 hours), and subacute (73–720 hours). Multi-modal MRI images were obtained on a 3T scanner (uMR780, United Imaging Healthcare, Shanghai, China) with a 24- channel head coil. Imaging sequences included T1W, T2W, DWI, SWI, and ASL-CBF, APT with a scan time of about 12 minutes. The imaging parameters are shown in table 1, APT parameters are as follows: single slice FSE (ETL = 39, B1 = 1.3μT and 2.5uT, Gaussian pulse, 100ms duration, 10 repeat, Δω spanned from [-4.5 4.5] ppm in 31 steps, plus one S0 with no CEST saturation pulse for normalization; 11 low power B1=0.3uT,Δω spanned from [–1.0, 1.0] ppm images were collected as WASSR images [4] for B0 map correction, TR/TE/flip angle = 4500 ms/35.4ms/160°. APT data were processed offline using Matlab (Mathworks, Natick, MA, USA). APT MTR asymmetry analysis maps were calculated after motion correction following standard practice [5]. All other images were reconstructed online. SWI sequence generated 6 sets of images: phase, magnitude, SWI axial, and thick minimum intensity projection (minIP) images, R2* map and QSM. Disease areas were identified and compared to highlight cases by two trained medical doctors.RESULTS
Diseased area by different MRI techniques showed some matches and mismatches. Typical cases were shown in Figure 1, 2 and 3. A patient with matches among different MRI techniques was listed in figure 2. In 5 cases, obvious mismatch between imaging techniques are presented. Figure 1 shows results from one typical acute ischemia patient. Despite a large ischemic zone shown in the ASL-CBF image (fig 1d, white arrow), APT image (fig 1g, blue arrows) showed both pronounced hyper-intense area and hypo-intense area within the infarct area. APT image heterogeneity may indicate thromboembolus, as corroborated by evidence from QSM image (fig 1e, arrows), and SWI-MinIP (fig 1f, arrows); In figure 3, another mismatch, while visually no difference in ADC (fig3b), SWI-QSM and MinIP (figure 3e, 3f), some contrast shown in T2W (fig3a), DWI_b=1000(fig 3c), ASL-CBF (fig 3d) and APT map (fig 3g).DISCUSSION
SWI showed increase, decrease, or even disappearance of micro-vessels after cerebral infarction, indicating complicated changes in blood flow. In some cases, SWI showed small hemorrhagic foci. From our results, SWI images were able to detect the infarct sites in all acute patients because QSM gives quantitative information about susceptibility.SWI not only showed a clear hyperintense thrombus (fig1e, SWI-QSM) but also low oxygenated blood vessels (SWI_minIP) were clearly seen.For patients of subacute ischemia patients, APT map didn’t show much contrast between ischemia infarct and normal tissue.
In cases of large infarction area, the infarcts were divided into a hyper-perfusion group (figures 2&3) and a hypo-perfusion group (figure 1) based on CBF results. Their respective APT values were obviously different, indicating that APT is able to distinguish between the two groups. For acute patients, infarct area with high re-perfusion promises better clinical outcome and thrombolytic treatment is not advised, thus it is critical to timely differentiate the high re-perfusion area in the occurrence of large infarct area. APT clearly shows this capability in 5 patients.
CONCLUSION
With the help of APT sequence, ASL-CBF is able to divide the infarct areas into high perfusion group and hypo-perfusion group for stroke ischemia patients. The two inconsistent maps (CBF vs APT map) indicates that APT is able to distinguish between the two perfusion groups. High perfusion of large area of cerebral infarction usually indicates a good prognosis and is also a contraindication to thrombolysis, which can provide an important basis for clinical treatment.Novel MRI techniques including APT, ASL, QSM and DWI are important tools in studying stroke, which provides useful complimentary information for clinical management. In our study, despite that the majority of cases the techniques tend to reveal similar disease areas, there are cases where different information is obvious. Due to limited cases, our results warrant further investigation on the specific causes of such difference, and evaluating the usefulness of these techniques in a clinical setting.
Acknowledgements
No acknowledgement found.References
1). Jinyuan Zhou, et.al, Transl Stroke Res. 2011 Oct 28; 3(1): 76-83 2). Sasitorn Petcharunpaisan, et.al, World J Radiol 2010 October 28; 2(10): 384-398 3). E. Mark Haacke, et.al, Magnetic Resonance in Medicine 52:612–618 (2004) 4. Kim M et.al, Magn Reson Med. 2009; 61:1441–50. 5. Sensors 2018, 18, 125;Figures
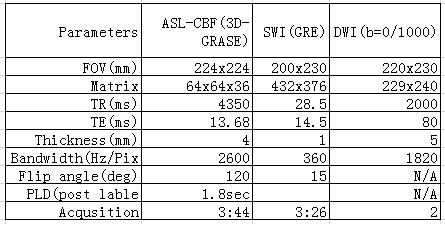
Table 1
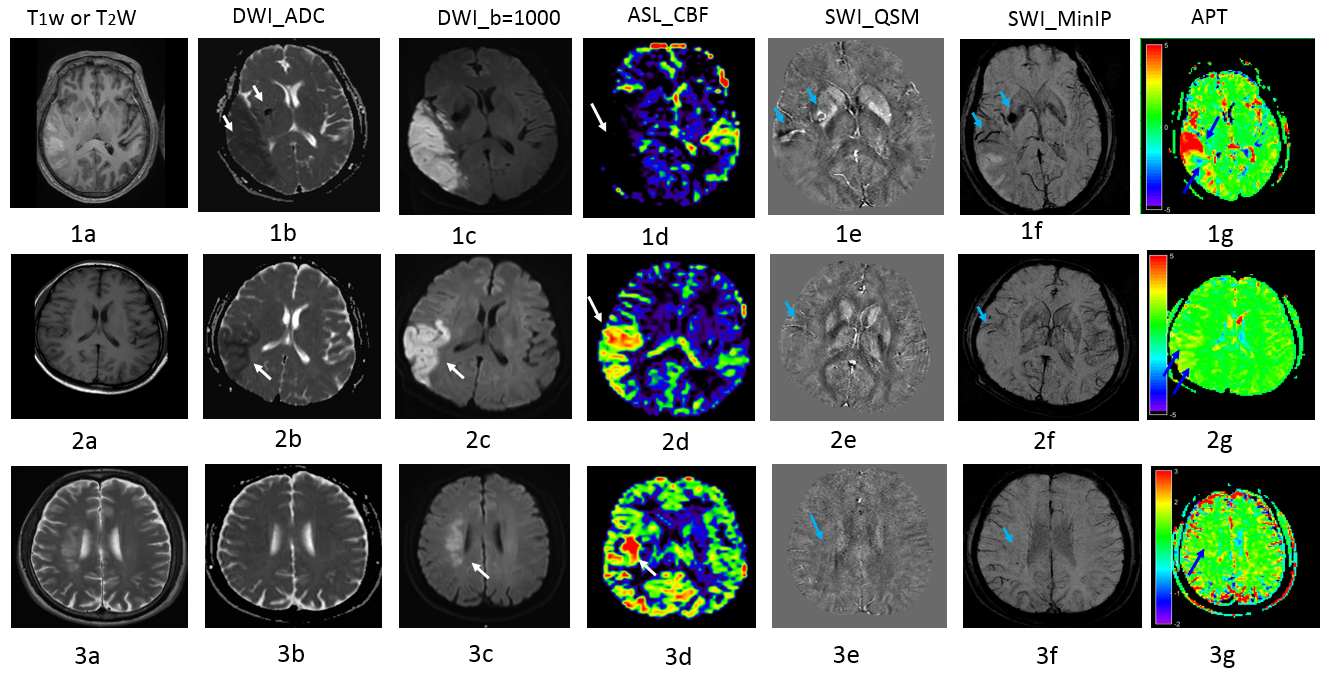
Figure 1,2,3