1055
Determining stroke onset time using T2 relaxation times: A comparison of reference and reference independent methods in ischemic stroke patients1School of Psychological Science, University of Bristol, Bristol, United Kingdom, 2Stroke Neurology, North Bristol NHS Trust, Bristol, United Kingdom, 3Acute Stroke Programme, Radcliffe Department of Medicine, University of Oxford, Oxford, United Kingdom, 4Institute of Neuroscience and Psychology, University of Glasgow, Glasgow, United Kingdom, 5Faculty of Engineering, University of Bristol, Bristol, United Kingdom
Synopsis
Unknown onset time is a common contradiction for anti-thrombolytic treatment of ischemic stroke. T2 relaxation times within the lesion estimate onset time, but accuracy may be affected by dependence on the non-ischemic hemisphere as reference for pre-ischemic values. In hyperacute ischemic stroke patients, we tested a reference-independent approach shown to be an accurate timer in a preclinical stroke model. This involved modelling the T2 distribution within ADC defined lesions to design linear regression models for onset time estimation. The reference-independent approach was accurate in grey matter and for lesions containing grey and white matter, the reference-dependent approach was more accurate.
Background
Unknown time of symptom onset is a common contraindication for anti-thrombolytic treatment of ischaemic stroke due to increased risk of hemorrhage and other clinically adverse events with time.1 MRI T2 relaxation times within ADC defined lesions increase linearly with time from stroke onset and may therefore help identify patients with unknown onset time that are within the 4.5-hour treatment-window.2,3 Current MRI stroke timing methods are reliant on non-ischemic voxels in the unaffected hemisphere as reference for pre-ischemic T2 values, which may be difficult to obtain due to inherently varying relaxation times across the brain4 and lack of perfect anatomical symmetry between hemispheres.5 A reference-independent method based on an approximation of the distribution of T2 within the ischemic lesion has previously been shown to estimate stroke onset time in rat models of ischemia more accurately than the reference-dependent method.5 We aimed to determine whether this finding also applies to hyperacute ischemic stroke patients.Methods
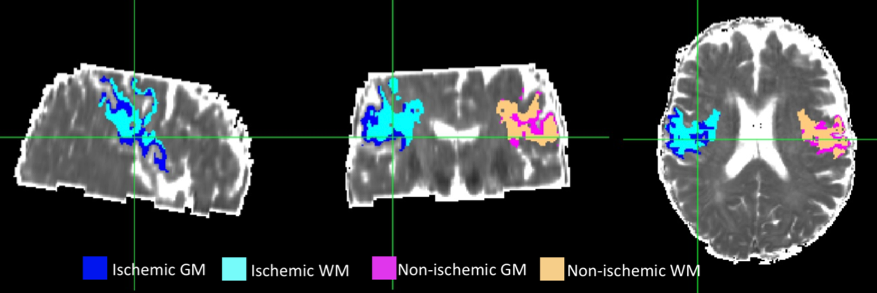
35 acute ischemic stroke patients with onset time < 9 hours were scanned at 3T with a 32-channel head-coil. Protocol included, DWI for ADC maps and localisation of ischemia, 3DT1 for anatomical reference and co-registration and multi-echo T2 for creation of T2 relaxation time maps and echo-summed T2 weighted images (T2-w) for tissue segmentation. All images were resampled to 1mm isotropic resolution and co-registered to the T1-w image which was registered to MNI space to ensure correct alignment across the midline. Ischaemic volumes of interest (VOI) were defined with ADC values > 0.2 – 0.4 um2ms-1 and < 0.55 – 0.6 um2ms-1 and < one HWHM from the median non-ischaemic ADC, and T2> 30ms and < 200ms to reduce CSF contribution. Ischemic VOIs were reflected across the vertical axis and manually edited where necessary to create non-ischemic reference VOIs. In order to analyze grey (GM) and white matter (WM) within the lesion separately, ischemic and non-ischemic VOIs were further segmented into GM and WM VOIs by subtracting GM and WM masks obtained by running FSL FAST6 on echo-summed T2w images (Figure 1).Data Analysis
Whole lesion, GM and WM VOIs were analysed separately. Ischemic volumes greater than 0.5ml3 were selected for analysis, resulting in 23 full lesions, 13 GM lesions and 21 WM lesions. For the reference-independent approach, all distributions available in the MATLAB statistics and distribution toolbox were fitted to the T2 data by the maximum likelihood estimation and compared to the empirical distributions. For each patient and VOI type, the three distributions with the lowest Akaike Information Criteria (AIC) were considered to best represent the T2 distribution within the VOI. The most commonly occurring distributions were selected to design polynomial linear regression models for onset time estimation. The mean and standard deviation (SD) of T2 within the VOIs were also used to design reference-independent regression models, and image intensity ratios (rT2), where rT2= mean ischemic T2/ mean non-ischemic T2, were calculated for the reference-dependent models. Leave one out cross validation was used to split the data used to train and test the estimators and the average root mean square error (RMSE) with respect to the true onset time across folds was used to assess the performance of regression estimates.Results
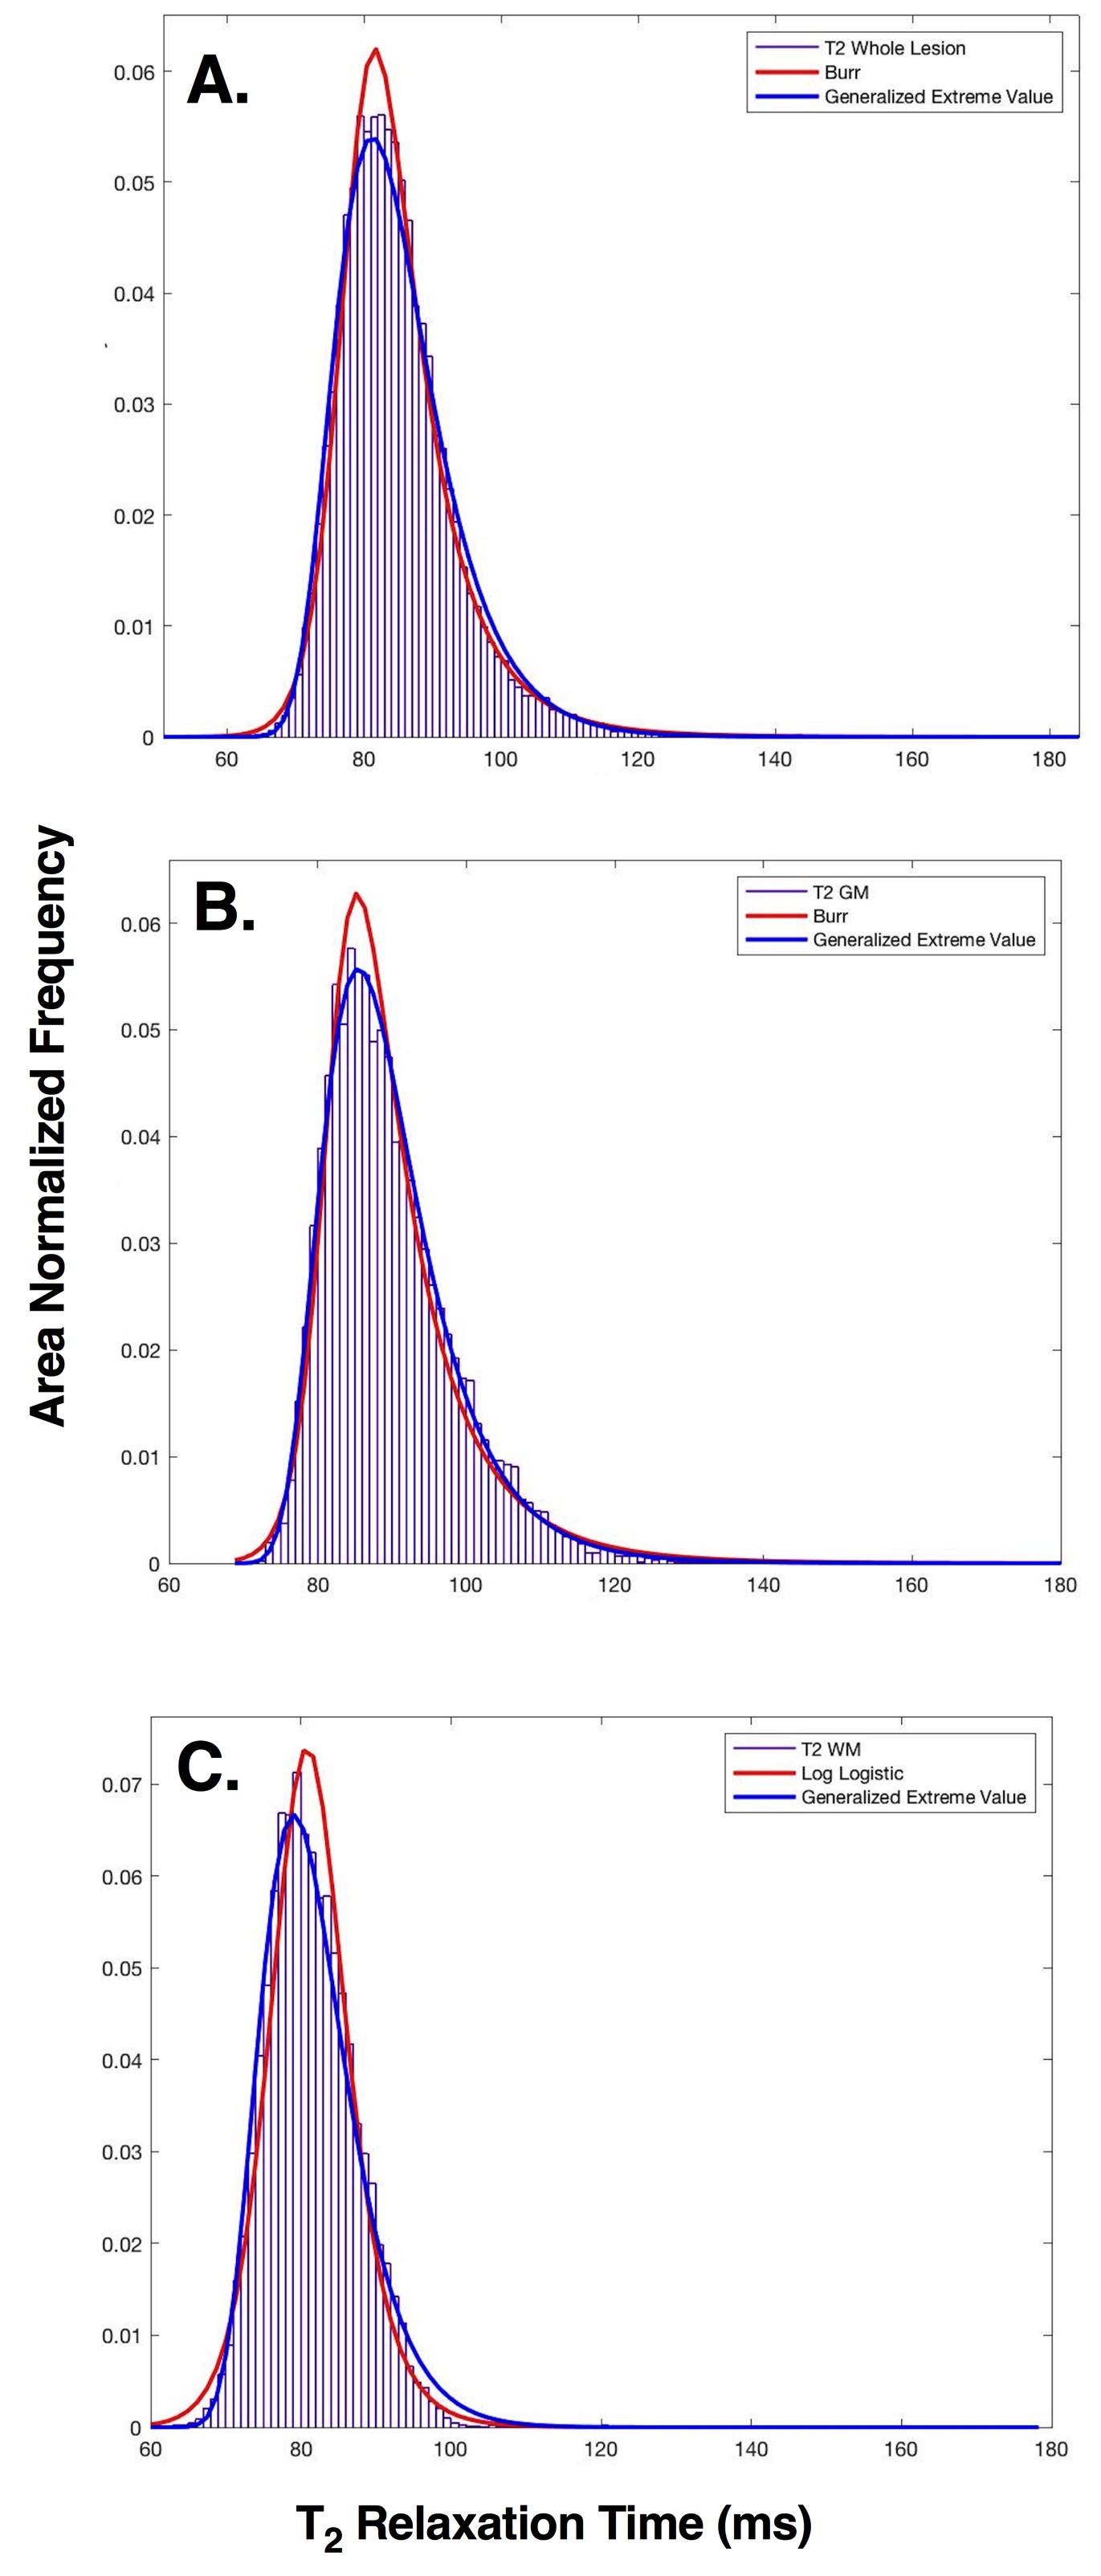
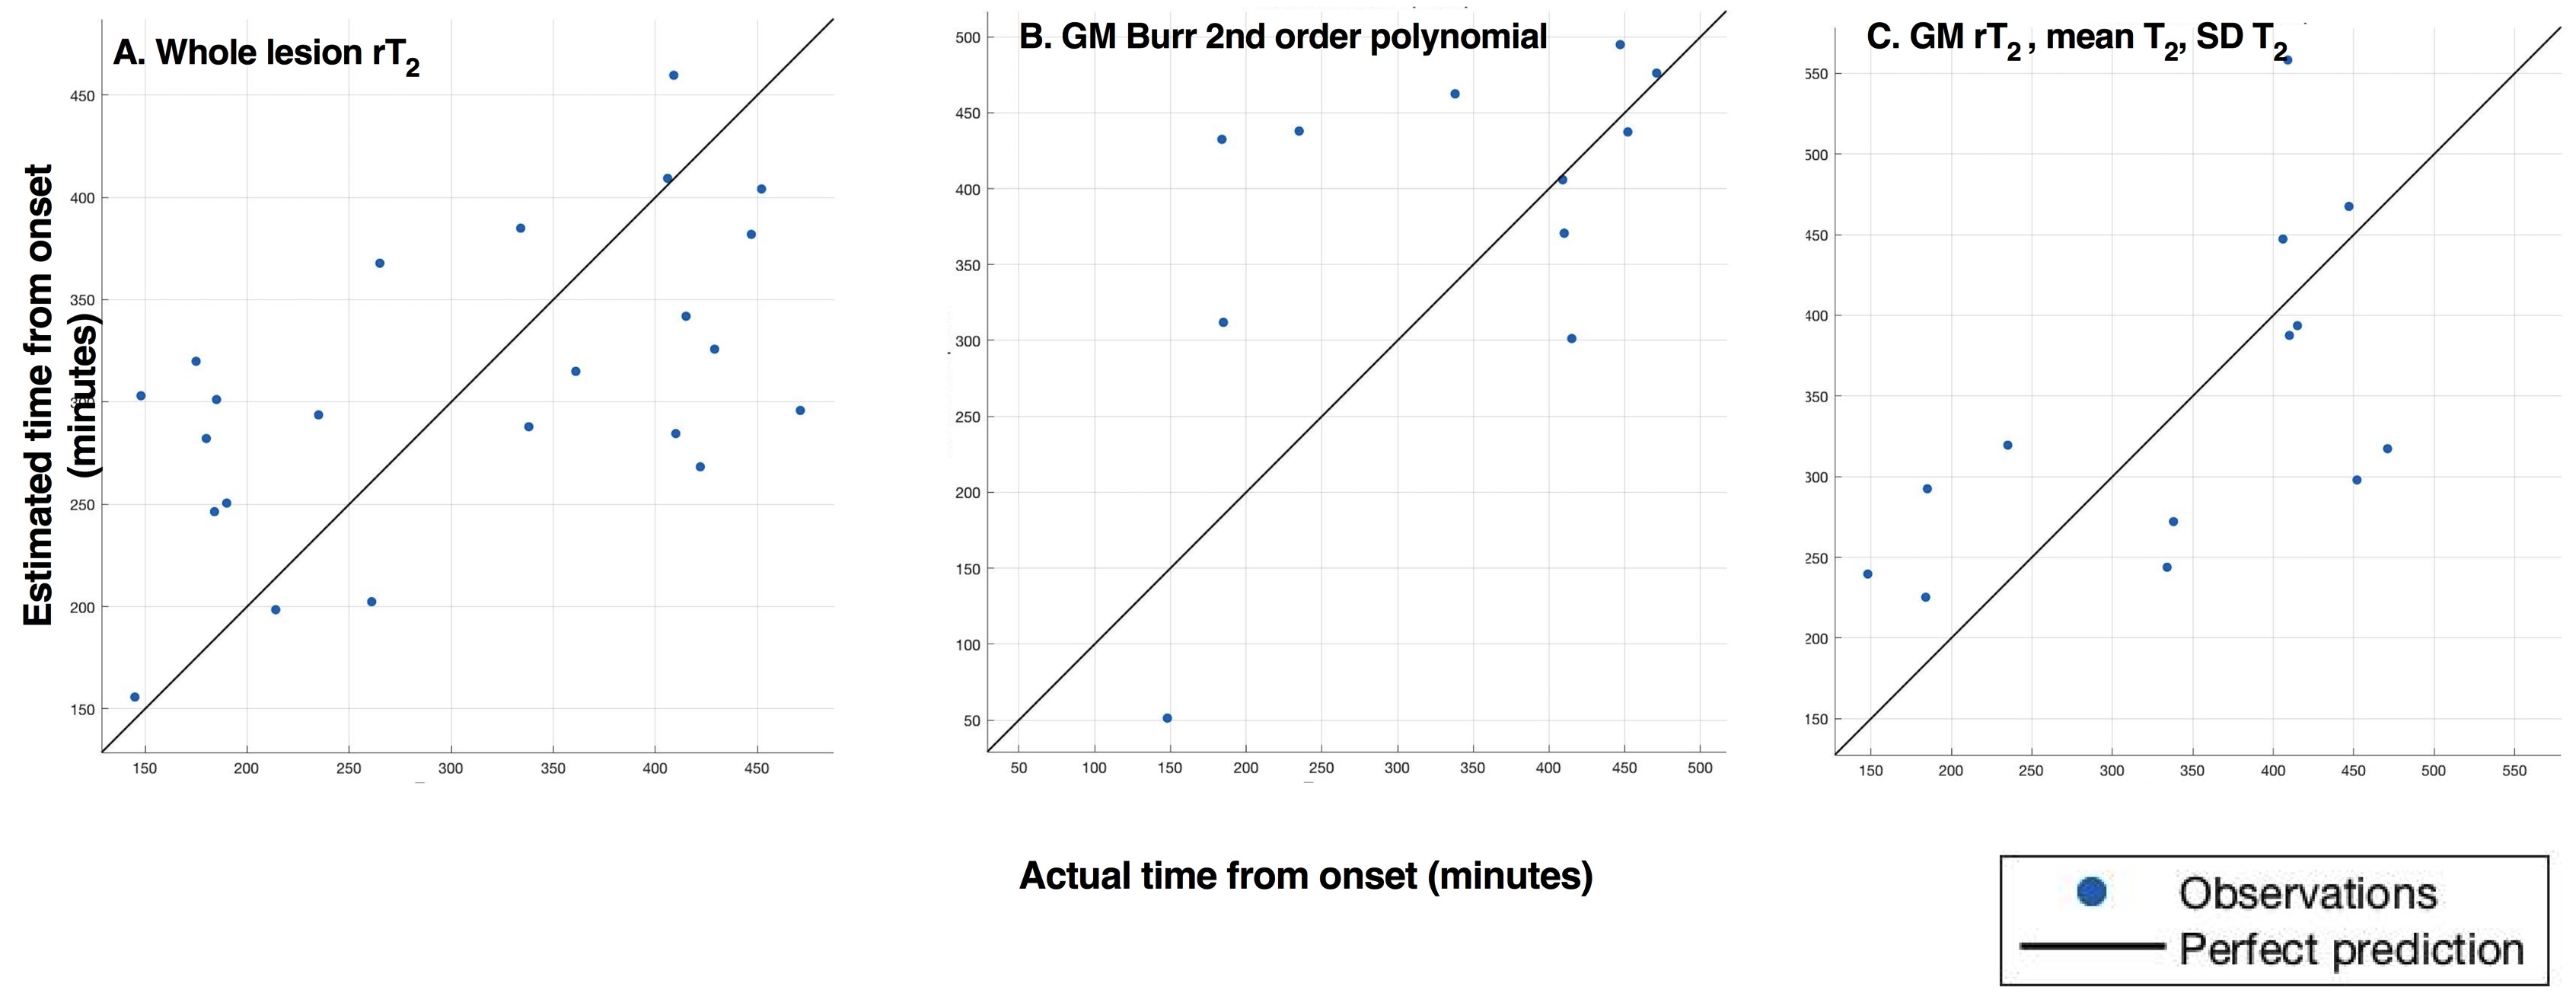
T2 within the whole lesion was best described by the Generalized Extreme Value (GEV) and Burr distributions, but regression models based on these distributions did not predict stroke onset time (p > 0.05) and had an average RMSE of 121 and 116 minutes respectively. The reference-dependent method for the whole lesion was most accurate (average RMSE = 92 minutes) and significantly predicted stroke onset time (R2= 0.393, p = 0.001), where onset time = [(1052.3 ± 285.3)rT2) + (-828.08 ± 308.5)]. T2 within WM lesions was best described by GEV and log-logistic distributions, and none of the models significantly predicted onset time (p > 0.05). For GM, T2 was best described by GEV and Burr distributions. A second order polynomial based on the Burr distribution predicted stroke onset time in GM, with an average RMSE of 120 minutes (R2= 0.946, p = 0.016), where onset time = [(1155.1 ± 423.4)αT2 + (-79.3 ± 25.3)cT2+ (96.1 ± 15.1)kT2+ (-572.8 ± 242.9)αT22 + (0.368 ± 0.115)cT22 + (-1.9 ± 0.318)kT22+ (2932.9 ± 1288.9)], and αT2, cT2 and kT2 are the scale, first shape and second shape parameters of the T2 Burr distribution, respectively. The most accurate predictor of stroke onset time in GM was obtained from a combination of mean T2, SD and rT2 (R2= 0.634, p= 0.024) with an average RMSE of 94 minutes, where onset time = [(751.3 ± 319.8)rT2+ (5.0 ± 1.8)meanT2 + (-18.8 ± 7.2)SDT2+ (-730.3 ± 331.2)] (Figures 2 and 3).Conclusion
In contrast to rat models of stroke, for whole lesions and WM lesions, stroke onset time cannot be estimated more precisely using reference-independent T2 distribution-based methods. Instead it would be better to measure the T2 relaxation time in relation to non-ischemic tissue directly. However, consistent with rat models of stroke where affected tissue is purely GM, results suggest estimation of onset time of strokes occurring in GM may not require a non-ischemic reference.Acknowledgements
The study is funded by the Dunhill Medical Trust (R385/1114). We acknowledge the support of Engineering and Physical Sciences Research Council (EPSRC) for PhD studentship funding as well as the support of the National Institute for Health Research Clinical Research Network (NIHR CRN).References
1.Hacke W, Kaste M, Bluhmki E, et al. Thrombolysis with alteplase 3 to 4.5 h after acute ischemic stroke. N Engl J Med. 2008; 359:1317–1329.
2. Siemonsen S, Mouridsen K, Holst B, Ries T, et al. Quantitative T2 values predict time from symptom onset in acute stroke patients. Stroke J Cereb Circ. 2009. 40(5):1612–6.
3. Duchaussoy T, Budzik JF, Norberciak L, et al. Synthetic T2 mapping is correlated with time from stroke onset: a future tool in wake-up stroke management? Eur Radiol. 2019. Epub ahead of print, available from: https://doi.org/10.1007/s00330-019-06270-0
4.Wansapura JP, Holland SK, Dunn RS, et al. NMR relaxation times in the human brain at 3.0 tesla. J Magn Reson Imaging. 1999;9(4):531–8.
5. Norton TJT, Pereyra M, Knight MJ, McGarry BL, et al. Stroke onset time determination using MRI relaxation times without non-ischaemic reference in a rat stroke model. Biomed Spectrosc Imaging. 2017. 20;6(1–2):25–35.
6. Zhang Y, Brady, M, & Smith, S. (2001). Segmentation of brain MR images through a hidden Markov random field model and the expectation-maximization algorithm. IEEE Transactions on Medical Imaging. 2001. 20(1), 45–57.
Figures