1047
Specific Absorption Rate prediction for open source pulse sequence programming1Columbia MR Research Center, Columbia University, New York, NY, United States, 2University of Michigan, Ann Arbor, MI, United States
Synopsis
Flexibility in designing custom pulse sequences has a direct impact on the development of diverse MR techniques and strategies. However, it is important to be cognizant of the MR safety risks that are associated with such custom sequences. We develop and evaluate an open source software package to predict global Specific Absorption Rate for Pulseq and TOPPE based sequences. We compare the resulting predictions with scanner reported SAR values for different flip angles and three sample weights, on two major MR vendor platforms. The predictions correlate highly with the scanner reported values: R2 = 0.87 (vendor 1); 0.99 (vendor 2).
Purpose
To compute global specific absorption rate for vendor-neutral, open source pulse sequence programming toolsIntroduction
Flexibility in designing pulse sequences has a direct impact on the development of diverse MR techniques and strategies. However, this programming effort requires knowledge of specific programming environments that are vendor dependent.1 These environments are also specific to vendor hardware and software configurations intended for use. This requires considerable human effort and typically impedes the pace of prototyping. Open source pulse sequence design tools have been developed to enable rapid prototyping and deployment of acquisition strategies and methods. 1-3 However, it is important to be cognizant of the MR safety risks that are associated with "custom" or "open source" pulse sequences. Specifically, assessment of safety issues related to RF heating and Peripheral Nerve Stimulation (PNS) are critical before considering deployment of such sequences. In this work, we predict and compare global SAR values for sequences generated via Pulseq1 and TOPPE2, on two vendor platforms.Methods
We computed the whole body and head only Q matrices4 for the Visible Human Male (VHM) EM model. This was computed for a 3T MR system with 8 transmit channels. Q matrices for global SAR were generated for the 740,817 cells of the VHM. The input sequence file (.seq) was read block by block to identify the presence of RF transmission. Subsequently, the power of the applied pulse was computed and multiplied by the Q matrix to yield the SAR value, as in ref. 4. SAR predictions based on these Q matrices for quadrature excitation were performed and compared. A B1+ scaling factor for each of the vendors was computed based on the 10kg. phantom scanner reported values for the two vendors. The code also allows computation of 1g/10g local SAR, particular to the VHM’s body tissue distribution. The MATLAB (The Mathworks Inc., MA) code dubbed the “SAR4seq” package (SS) is available online.5 MR experiments involved predicting global SAR values for samples (the FBIRN phantom) with weights of 40kg, 20kg, and 10kg for a Turbo Spin Echo (TSE) sequence with TR/TE = 500ms/12ms, ETL = 16. The sequence was played for four refocusing flip angles of 1200, 1400, 1600 and 1800. The Pulseq TSE sequence code and the different .seq files are available as part of the online repository. These sequences for the three samples weights were played on a Siemens Prisma Fit 3T (Siemens Healthineers, Vendor 1) scanner via Pulseq and on a GE MR750 3T (GE Precision Healthcare, Vendor 2) using ‘seq2GE.m’ and TOPPE.2 The SAR values reported by the scanner User Interfaces (UIs) for both vendors were tabulated and compared. In the case of Siemens 3T, the UI reported values in W/lb which were converted to W/kg. In addition, vendor 1 reported time-averaged RF power (W), i.e. total forward power over the duration of the sequence. We also computed and compared this metric for the four flip angles averaged over the three weights, to account for transmit-gain changes.Results and Discussion
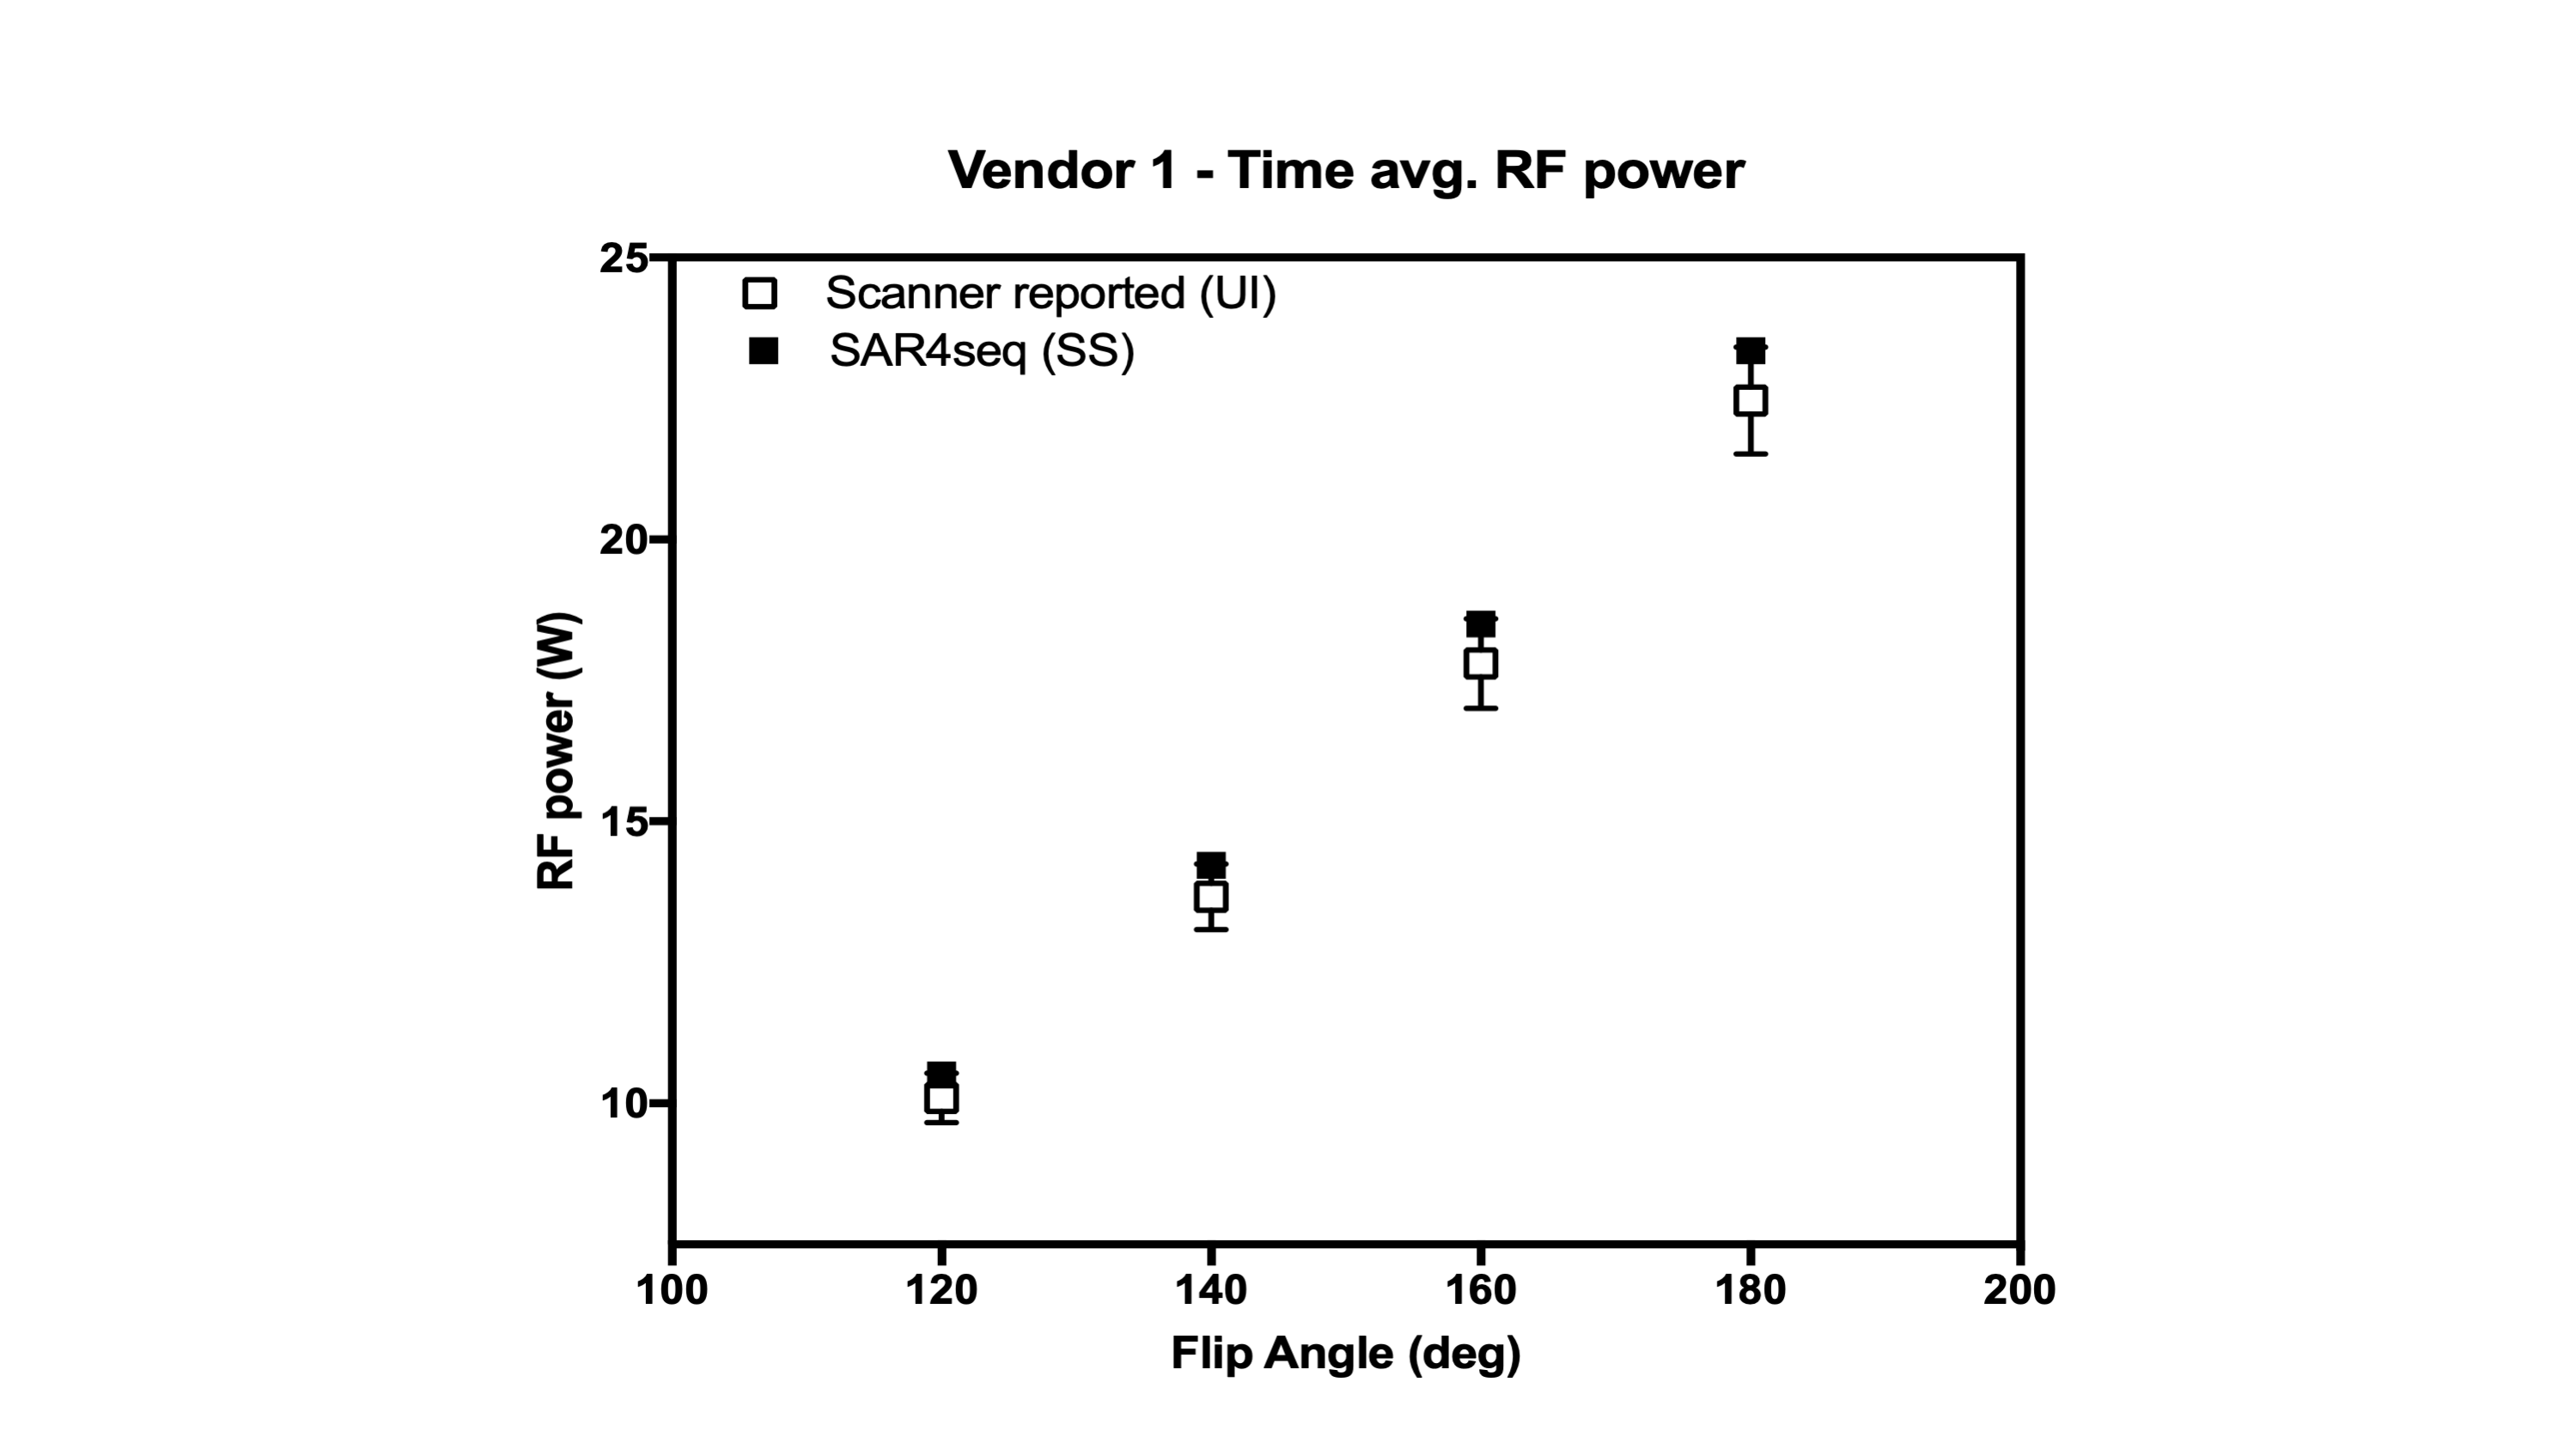
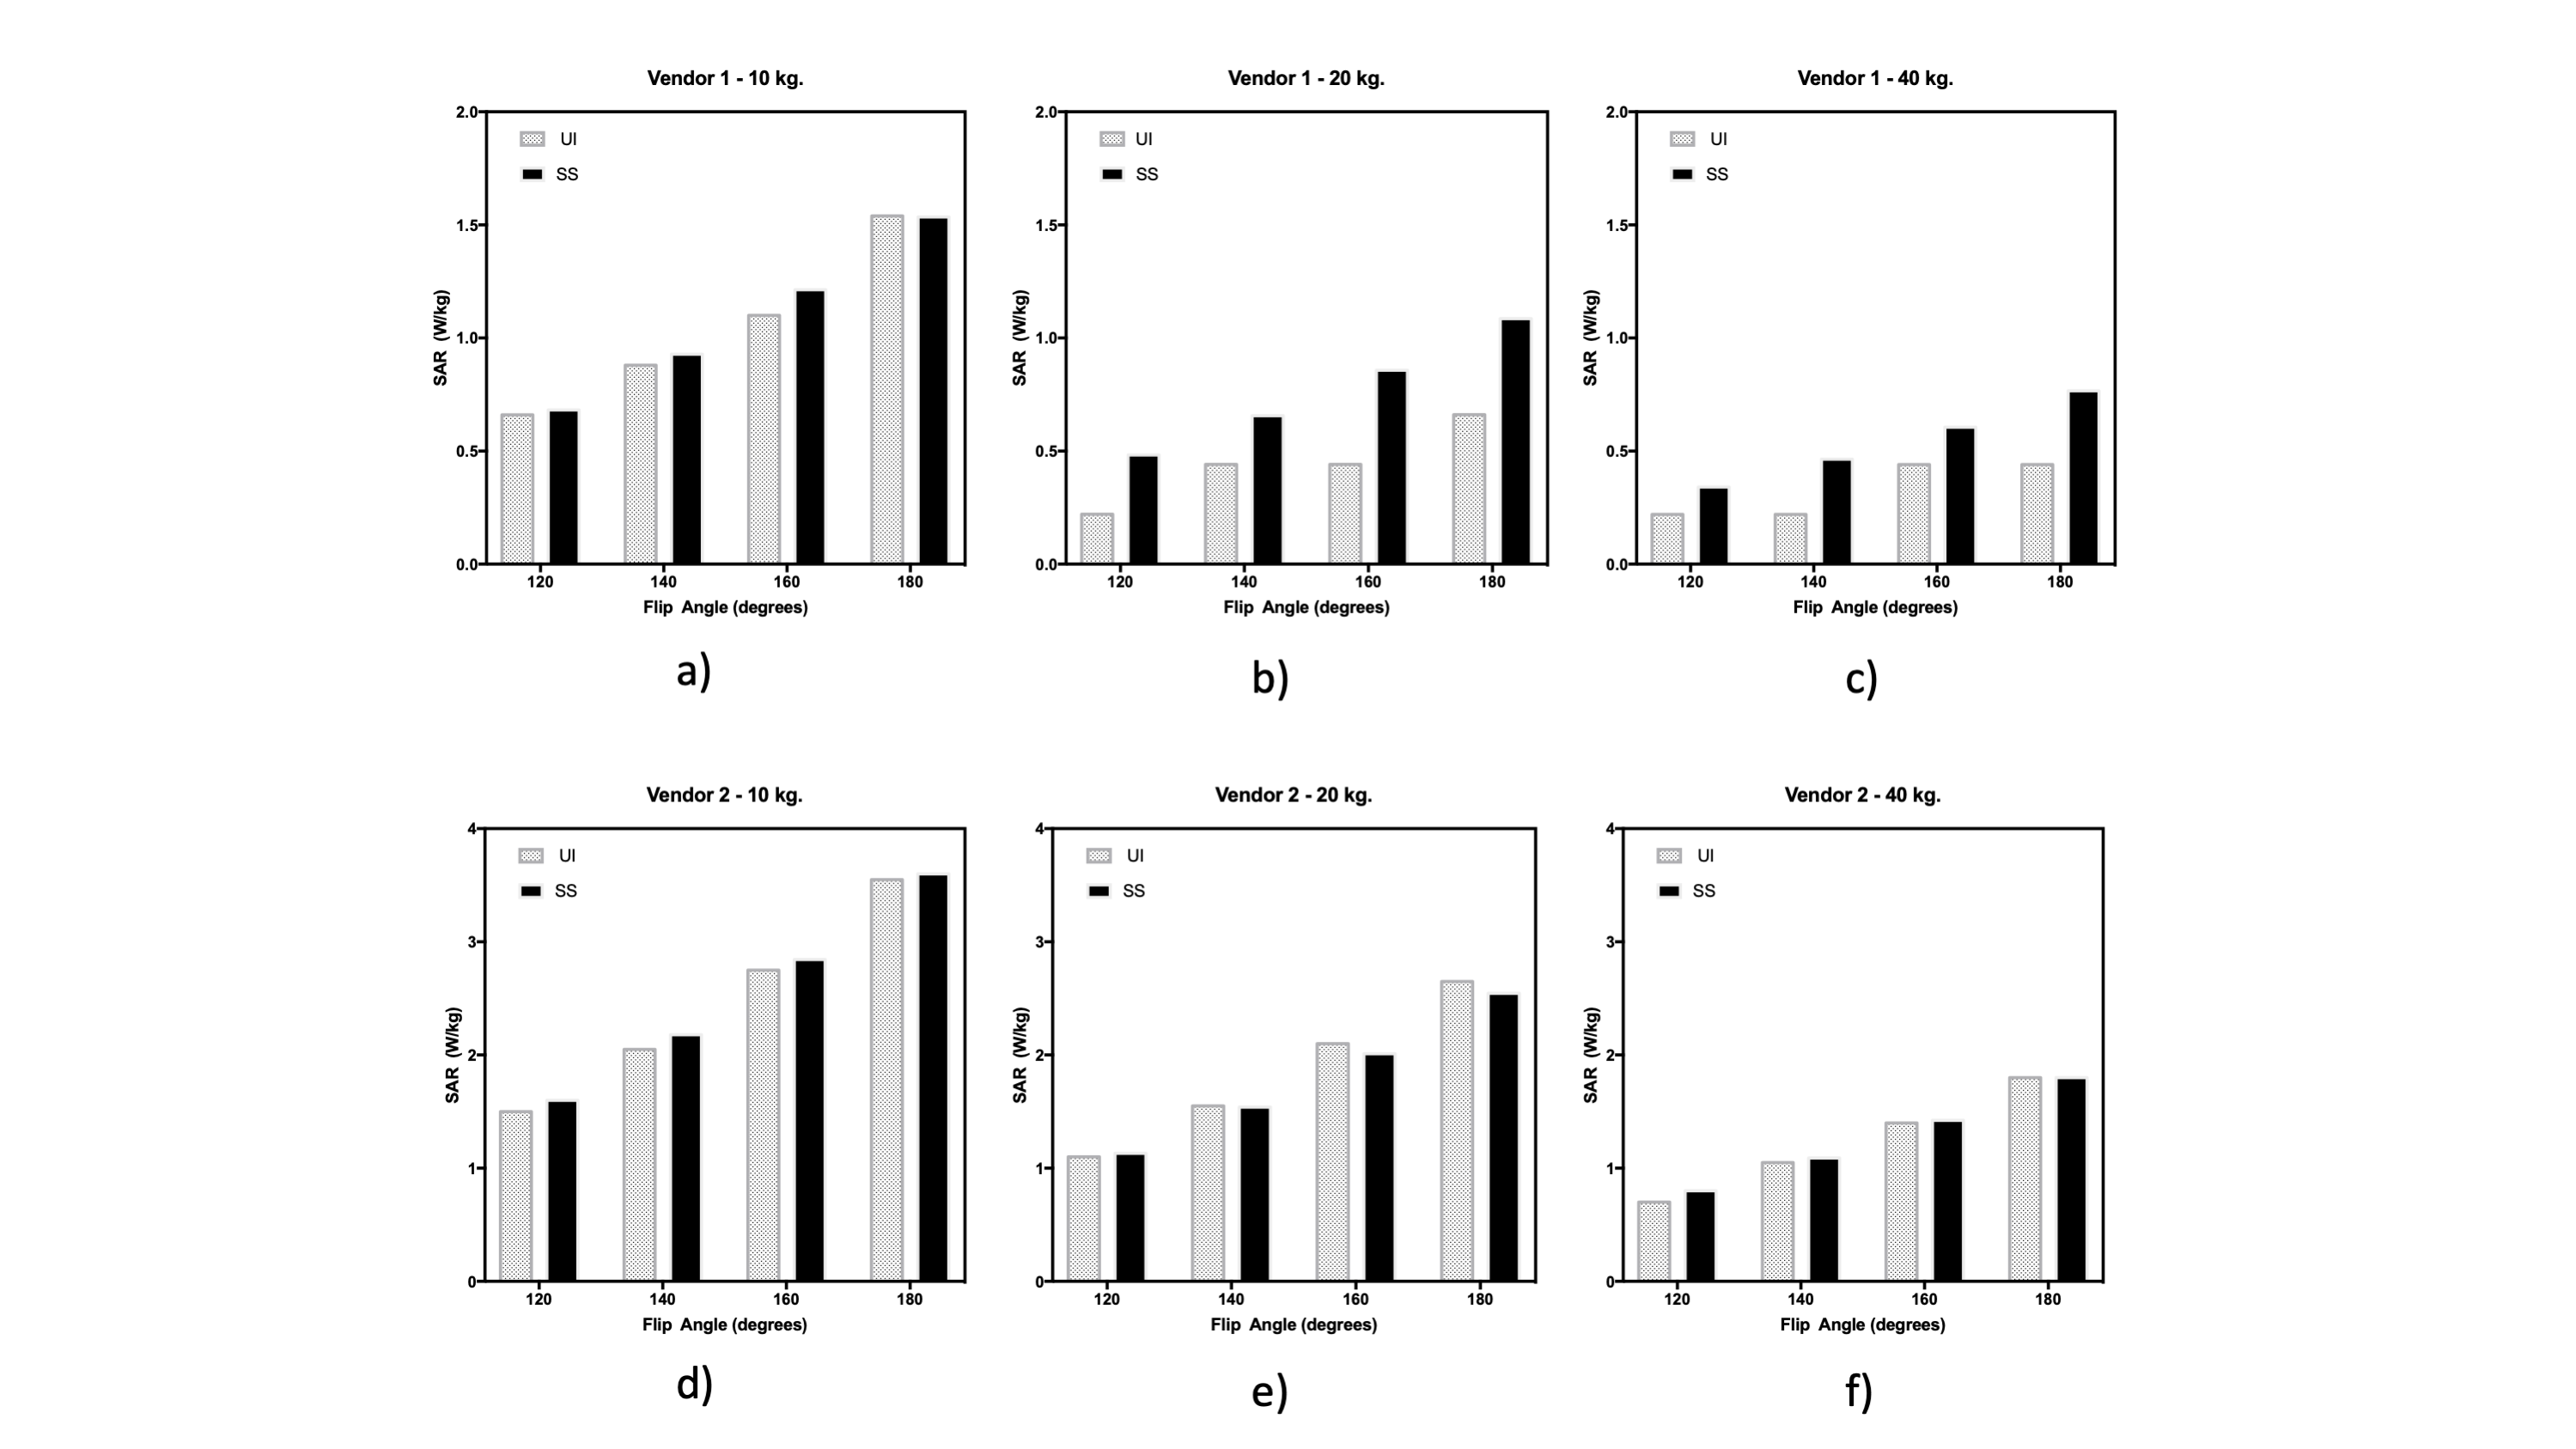
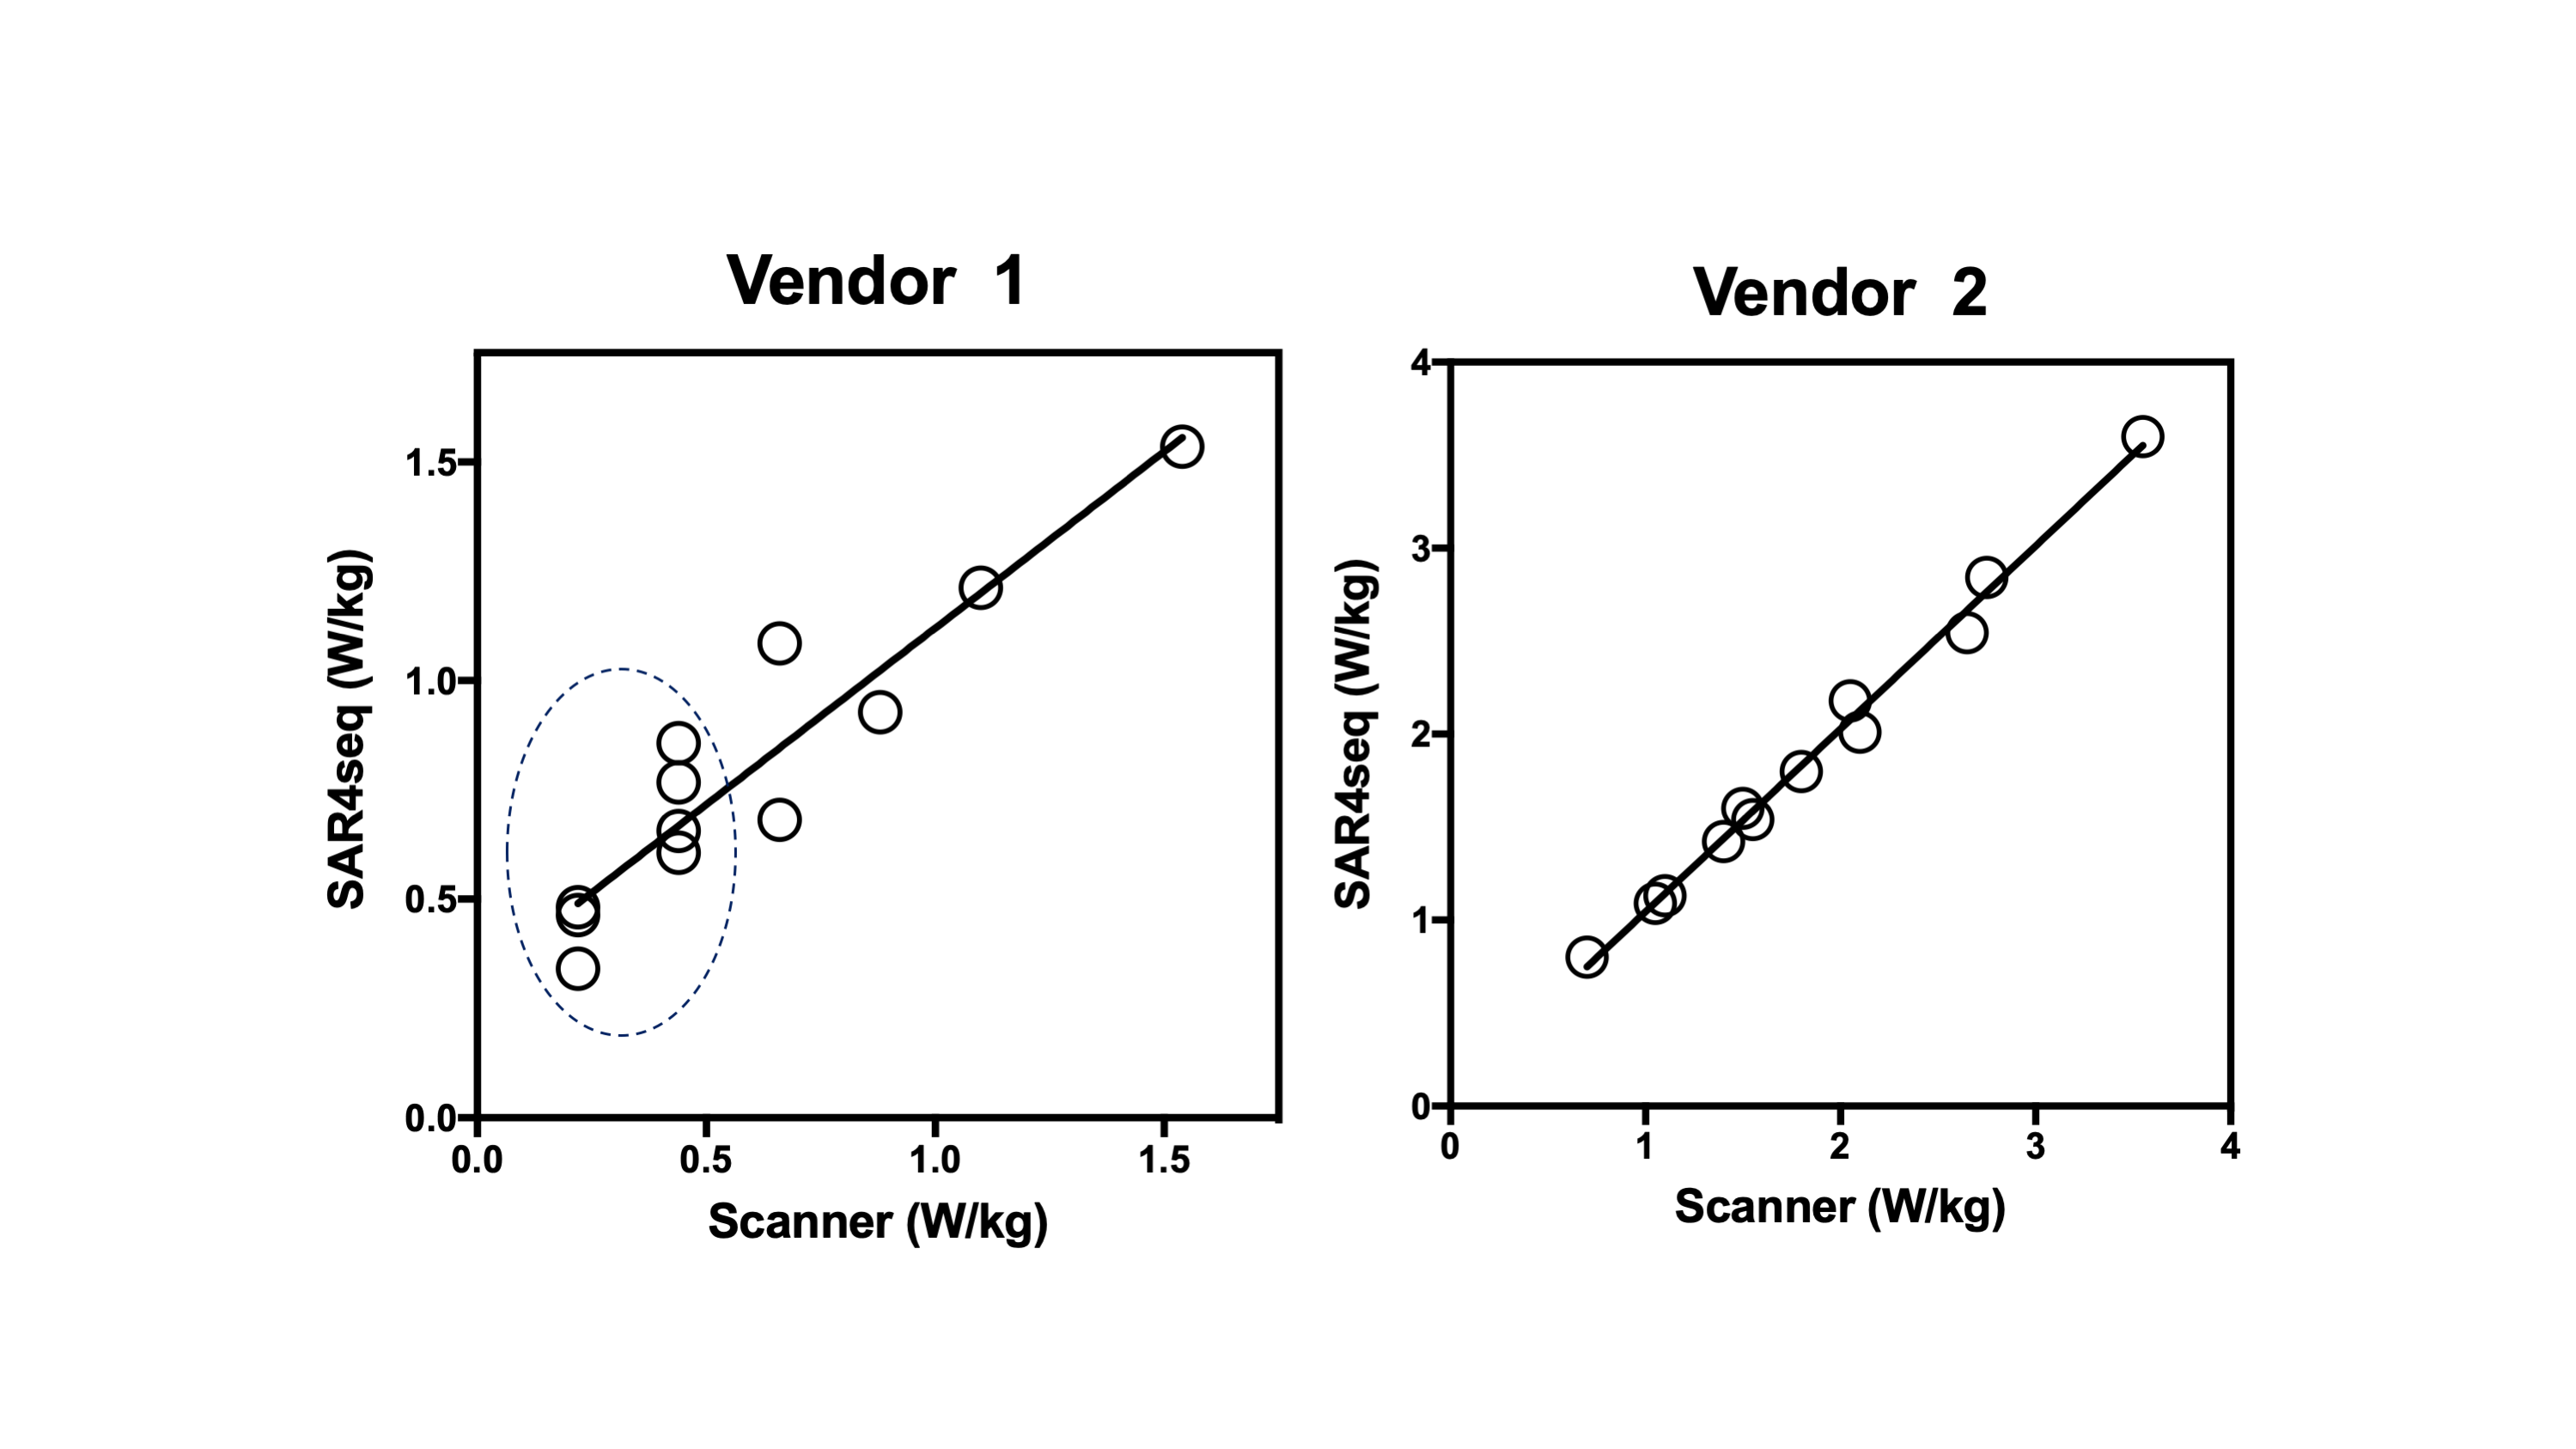
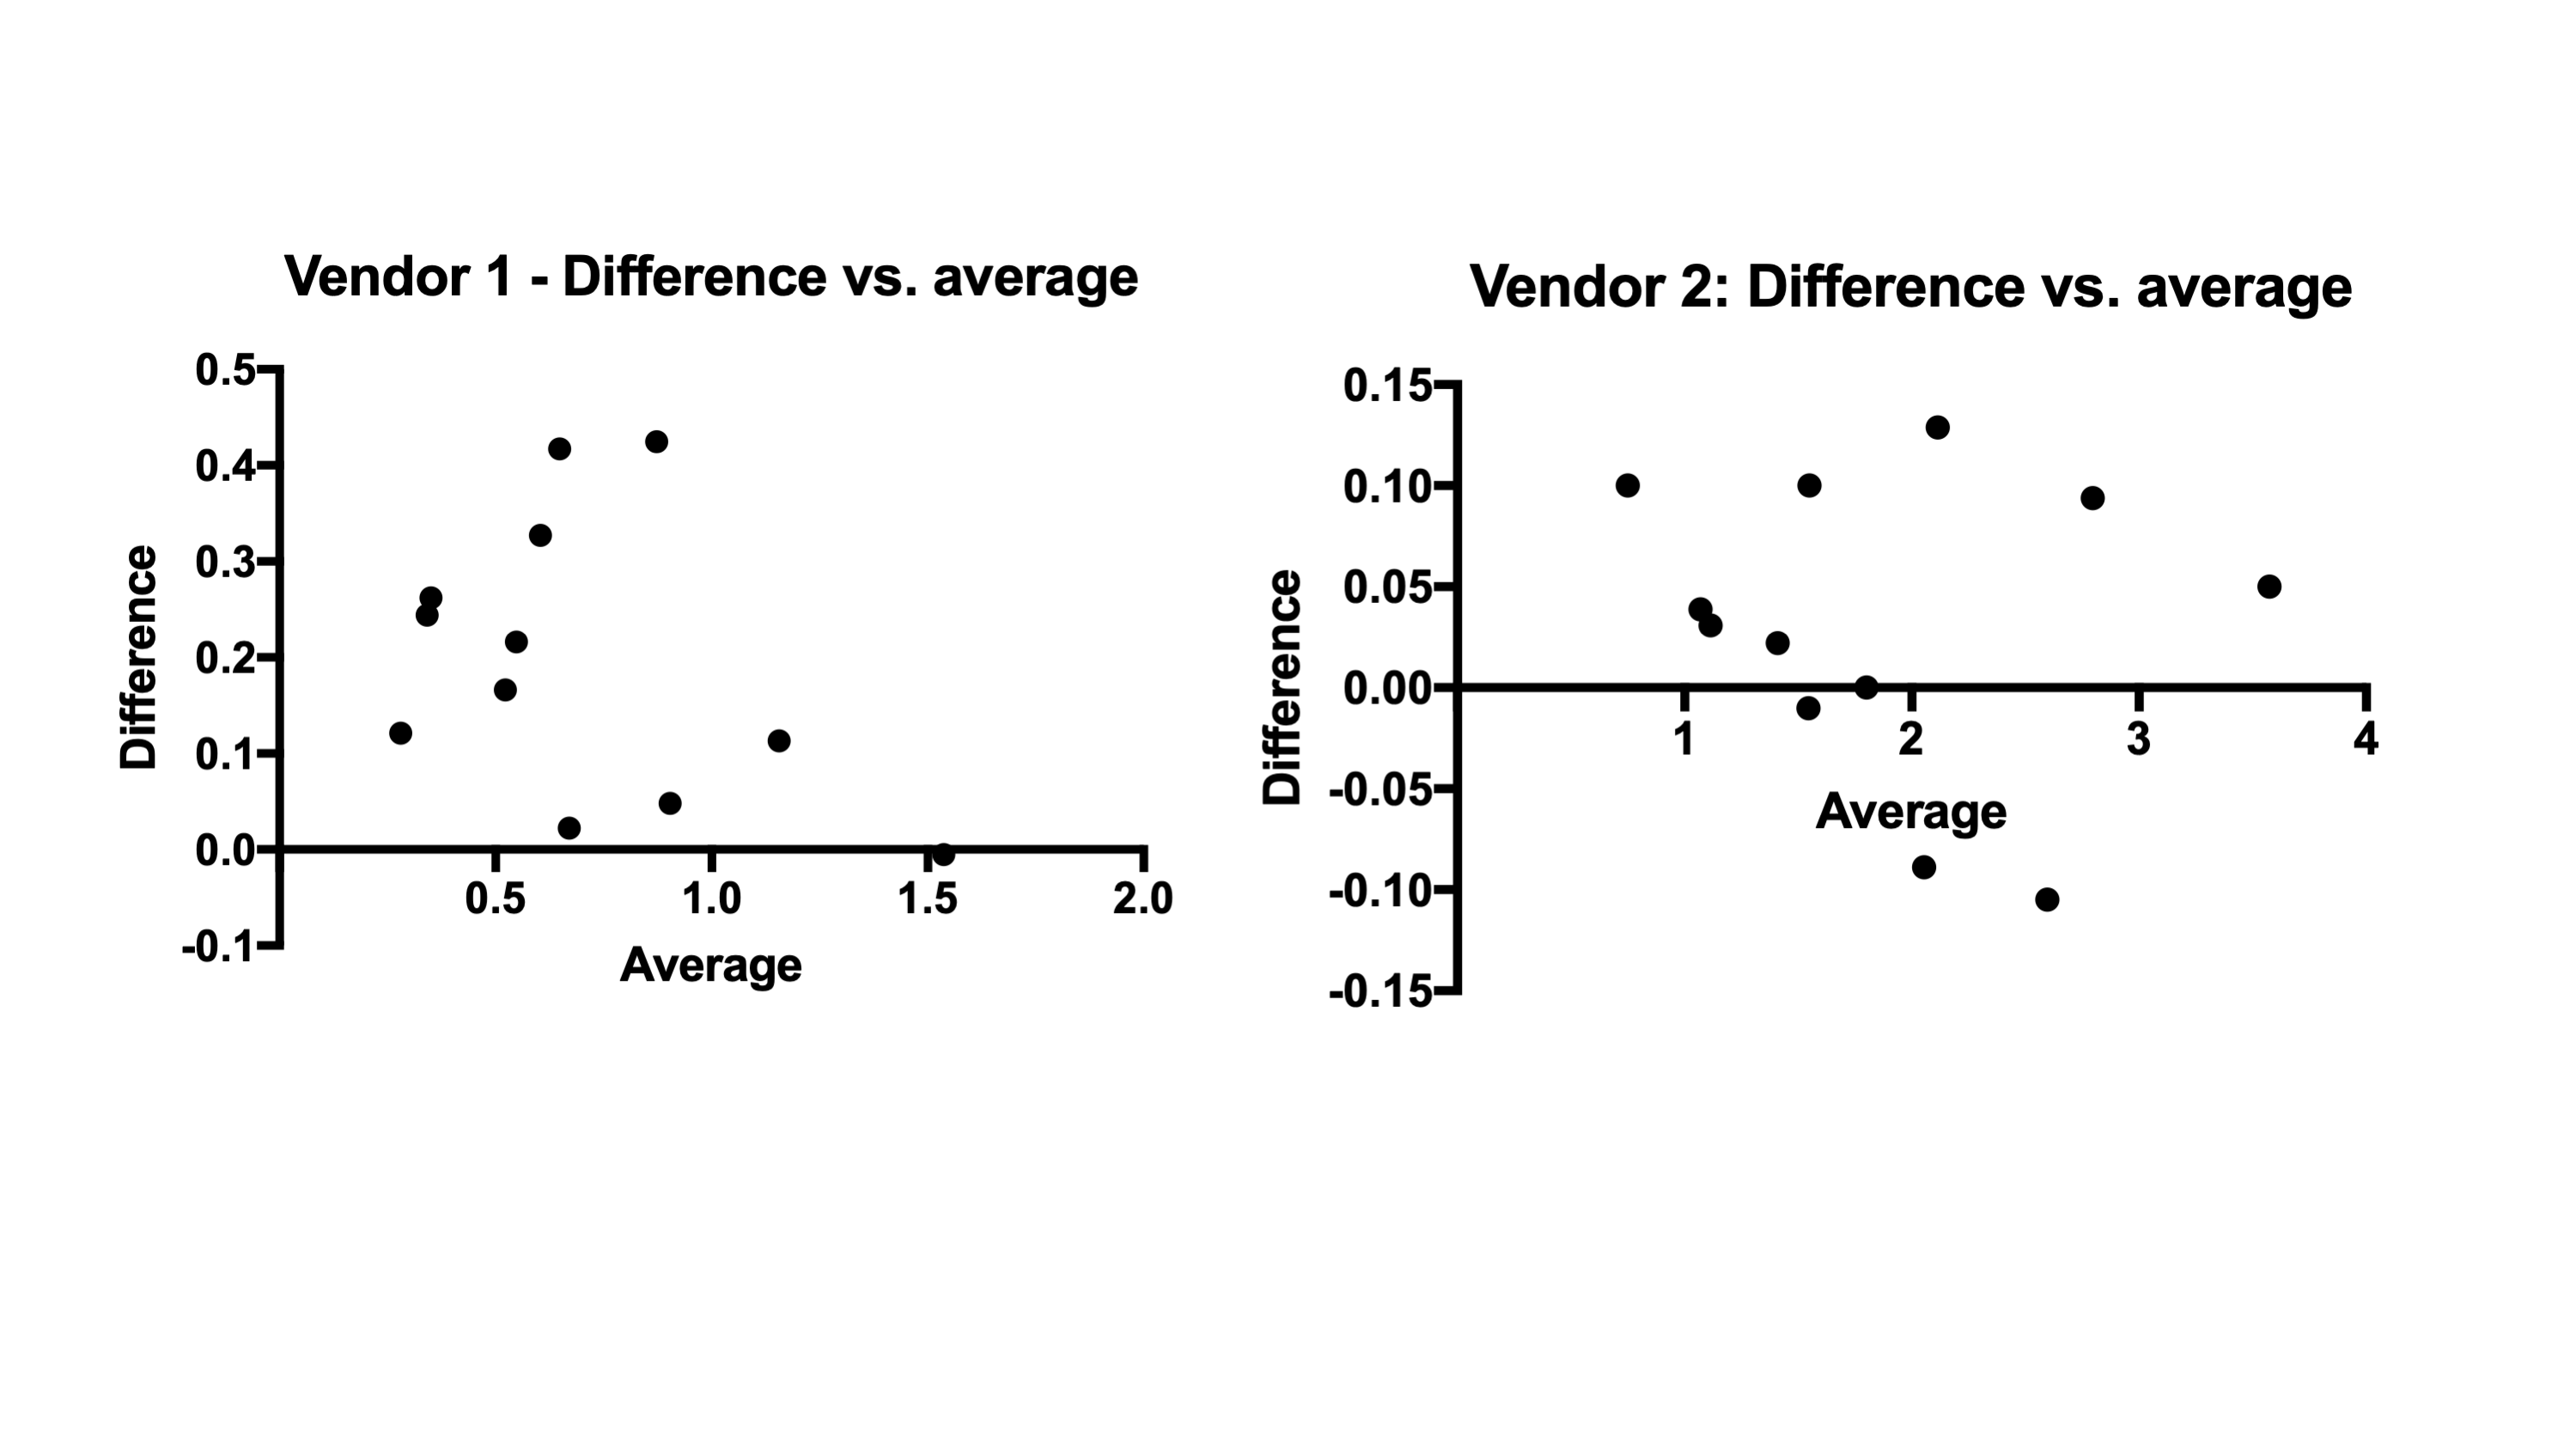
The required tissue properties, electrical fields and the resulting Q matrices (global SAR only) have been deposited online.5 Fig. 1 shows the implemented (SS) and scanner UI observed time-averaged RF values for vendor 1. The predicted values are similar to and higher than the UI values and lie within the standard deviation of the UI values. A linear regression fit yielded UI = 1.007*SS – 0.104. Fig. 2 shows the whole-body SAR values for SS and UI for the two vendors over three sample weights and the four flip angles. The predicted SAR values are similar to the UI reported values across the three sample weights and the refocusing flip angles. They decrease with an increase in sample weight in both cases as expected. The predicted values over-estimate more in the case of vendor 1 than in vendor 2, particularly at 40 kg. due to the low SAR value and single-digit precision reported in the UI in W/lb. The correlation between UI and SS for SAR values across weights and flip angles, shown in Fig. 3 depicts a linear relationship between the two methods for the two vendors. The R2 values for vendors 1 and 2 were 0.87 and 0.99 respectively. The Bland-Altman plot in Fig. 4 shows the similarity between UI and SS methods. Vendor 2 shows a tighter bound on the difference between the two methods while vendor 1 shows over-estimation of SS compared to UI. Vendor 2 reported higher values of global SAR (UI) for the three sample weights compared to vendor 1. We attribute this to differences in RF amplifier hardware. Also, the sequences on vendor 2 were run in level 1 SAR mode.Conclusion and future work
The SAR4seq package predicts whole-body SAR values for pulse sequences generated using the Pulseq and/or TOPPE tools, on two vendor platforms. The predicted values match closely with the scanner reported values for both vendors. The package also provides time-averaged RF power that vendor 1 reports, and the predicted values correlated highly with the reported values. Current and future work includes incorporating the Virtual Observation Point framework for rapid local SAR calculations, translating this package to Python and integrating it with pypulseq. 7Acknowledgements
1.Fast Functional MRI with sparse sampling and model-based reconstruction, National Institute of Biomedical Imaging and Bioengineering, 1R01EB023618-01, PI: Noll, Fessler; UM SUBK00009808, PI: Geethanath; 2.Zuckerman Institute Technical Development Grant for MR, Zuckerman Mind Brain Behavior Institute, Grant Number: CU-ZI-MR-T-0002; PI: Geethanath;References
1) Layton et. al., MRM 2016
2) Nielsen et. al., MRM 2018
3) Ravi et. al., MRI 2018
4) Graesslin et. al., MRM 2012
5) https://github.com/imr-framework/sar4seq
6) Eichfelder et. al., MRM 2011
7) Ravi, et. al., JOSS 2019
Figures