1041
A dynamic digital phantom with realistic vasculature and perfusion based on MR histology1Department of Biomedical Engineering, University of Texas at Austin, Austin, TX, United States, 2Oden Institute for Computational Engineering and Sciences, University of Texas at Austin, Austin, TX, United States, 3Department of Radiology, University of Chicago, Chicago, IL, United States, 4Department of Mechanical Engineering, University of Texas at Austin, Austin, TX, United States, 5Department of Diagnostic Medicine, University of Texas at Austin, Austin, TX, United States, 6Department of Oncology, University of Texas at Austin, Austin, TX, United States
Synopsis
Digital phantoms are valuable tools for developing or optimizing new imaging techniques, devices, and analyses. In this contribution, we seek to develop a dynamic digital phantom which contains a detailed representation of vascular structure, tissue properties, and perfusion based on high-resolution MRI data of a rat kidney (courtesy of the Duke Center for In Vivo Microscopy). This dynamic digital phantom can be used to simulate perfusion and diffusion MRI techniques, and systematically evaluate new magnetic resonance imaging acquisition reconstruction/image processing techniques.
Introduction:
Digital phantoms are important research tools for developing new medical imaging techniques and devices1. By providing the “ground truth” of a particular object of interest and its associated biophysical properties, digital phantoms enable the systematic evaluation and optimization of new imaging techniques. Many previous studies have developed digital phantoms focusing on large scale anatomy, motion, or fixed tissue properties. For example, the 4D XCAT phantom2 models cardiac-torso anatomy and body movements. The VICTRE Phantom3 recapitulates the tissues and large vessels of the breast, to enable in silico replication of existing clinical features, and demonstrates that computational modeling can play a central role in the regulatory assessment of imaging products. However, relatively little work has been done on generating digital phantoms with both realistic anatomical (e.g., microvasculature structure) and functional (e.g., perfusion and interstitial transport) microenvironment characteristics. These features are fundamentally important in the development of realistic simulations of dynamic contrast enhanced (DCE-) MRI and diffusion weighted (DW-) MRI measurements. In this contribution, we present preliminary efforts at developing a digital phantom which contains a detailed representation of vascular structure, tissue properties, and perfusion based on MR microscopy imaging of a murine kidney. This dynamic digital phantom could be a useful tool for evaluating new DCE- and DW-MRI techniques or associated image processing methods.Methods:
Data:The digital phantom is based on the MR histology data of excised rat kidneys published by Xie et al.4. The dataset used in this study (available via the Duke Center for In Vivo Microscopy5), consists of contrast-enhanced T1-weighted and T2*-weighted images of a male Sprague-Dawley rat (52 weeks). All images are acquired with a matrix size of 1024 × 1024 × 512 slices, yielding an isotropic resolution of 31-microns. Acquisition details can be found in Xie's paper4.
Generation of the geometric model:
The kidney volume is segmented by applying a k-means clustering algorithm on the T1-weighted images. The edge of the segmented mask is then smoothed with a Gaussian filter with a standard deviation of 1. A semi-automatic algorithm is used to extract the vascular from the T2*-weighted images, after normalizing the global intensity to suppress background noise. The algorithm is initialized with a manually identified starting point within the renal artery, from which vessel centerlines are automatically tracked to determine the local vascular radius and orientation along the main trunk; this provides the first generation of the vascular tree. Manually selected branching points are identified along the main trunk, and the algorithm is repeated along these branches to identify subsequent generations in the image set. The end result is the hierarchical, tree-like structure of vasculature.
Generation of the dynamic model:
We apply an image-based computational fluid dynamics model6 to compute the dynamics of blood flow and tracer propagation on the vascular geometry detected in the previous step. Literature values of vascular permeability7, Lp = 1.0 × 10⁻⁹ g-1·cm2·s and diffusivity8, ADC = 2.69 × 10⁻³ mm2/s are assigned on the vascular and extravascular tissues, respectively. Vascular inlet and outlet pressures9,10 are prescribed as Pin = 105 mmHg and Pout = 15 mmHg, respectively. Our computational fluid dynamics model then returns estimates of 1) steady-state flow fields, including blood flow through the vasculature, and interstitial flow in the extravascular renal tissue, modeled by a 1D-3D coupled fluid system6, and 2) the spatio-temporal evolution of the field of contrast agent concentration, modeled by an advection-diffusion equation.
Results:
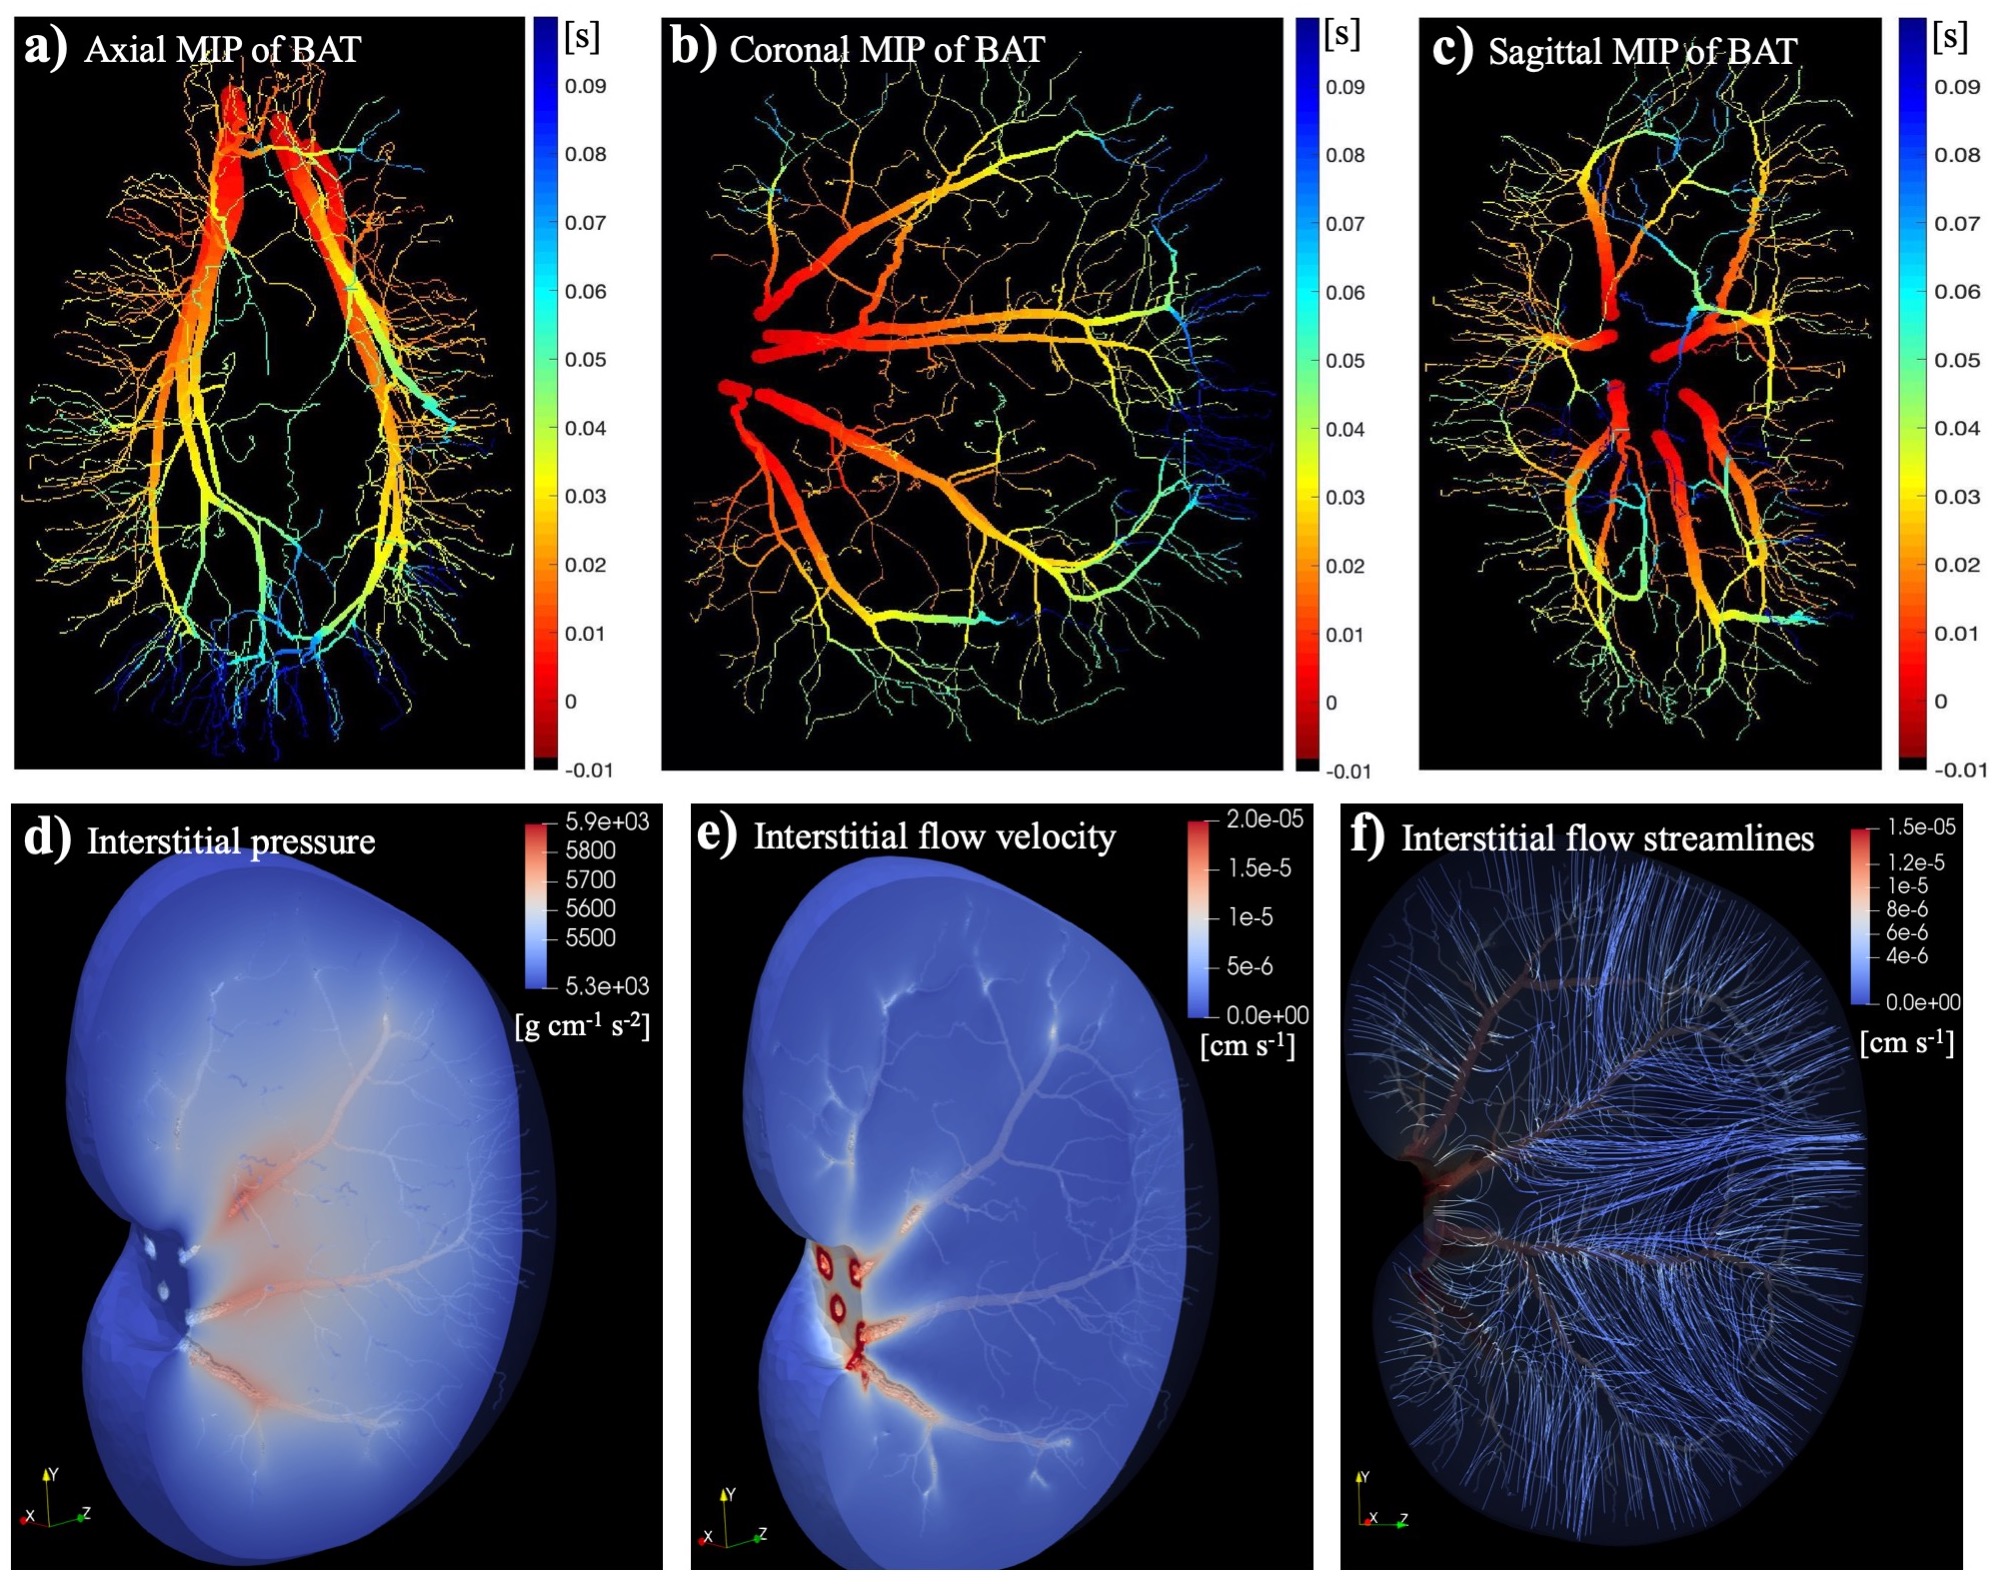
Figure 1 shows the vascular geometry of the kidney in the digital phantom. The left panel (a) provides an overall view of the entire vascular tree and kidney. Panels (b) to (g) shows the six individually reconstructed renal arterial trees. In this case, the major branches of renal arteries and three generations of further arterioles are completely constructed based on the MR histology image, preserving the realistic geometry and volume.The calculated blood and interstitial flow on the same digital phantom are presented in Figure 2. The solution within the vascular domain provides the blood pressure, blood flow rate, and flow direction. With these calculated parameters, we can further compute the bolus-arrival time through the vasculature, with the time of the bolus arrival at the roots of the renal arteries considered as the initial time point; see panels (a) – (c). Within the interstitial space, the interstitial pressure and flow velocity fields are solved; see panels (d) – (f). This calculation provides spatially-resolved estimates of renal arterial perfusion and interstitial transport.
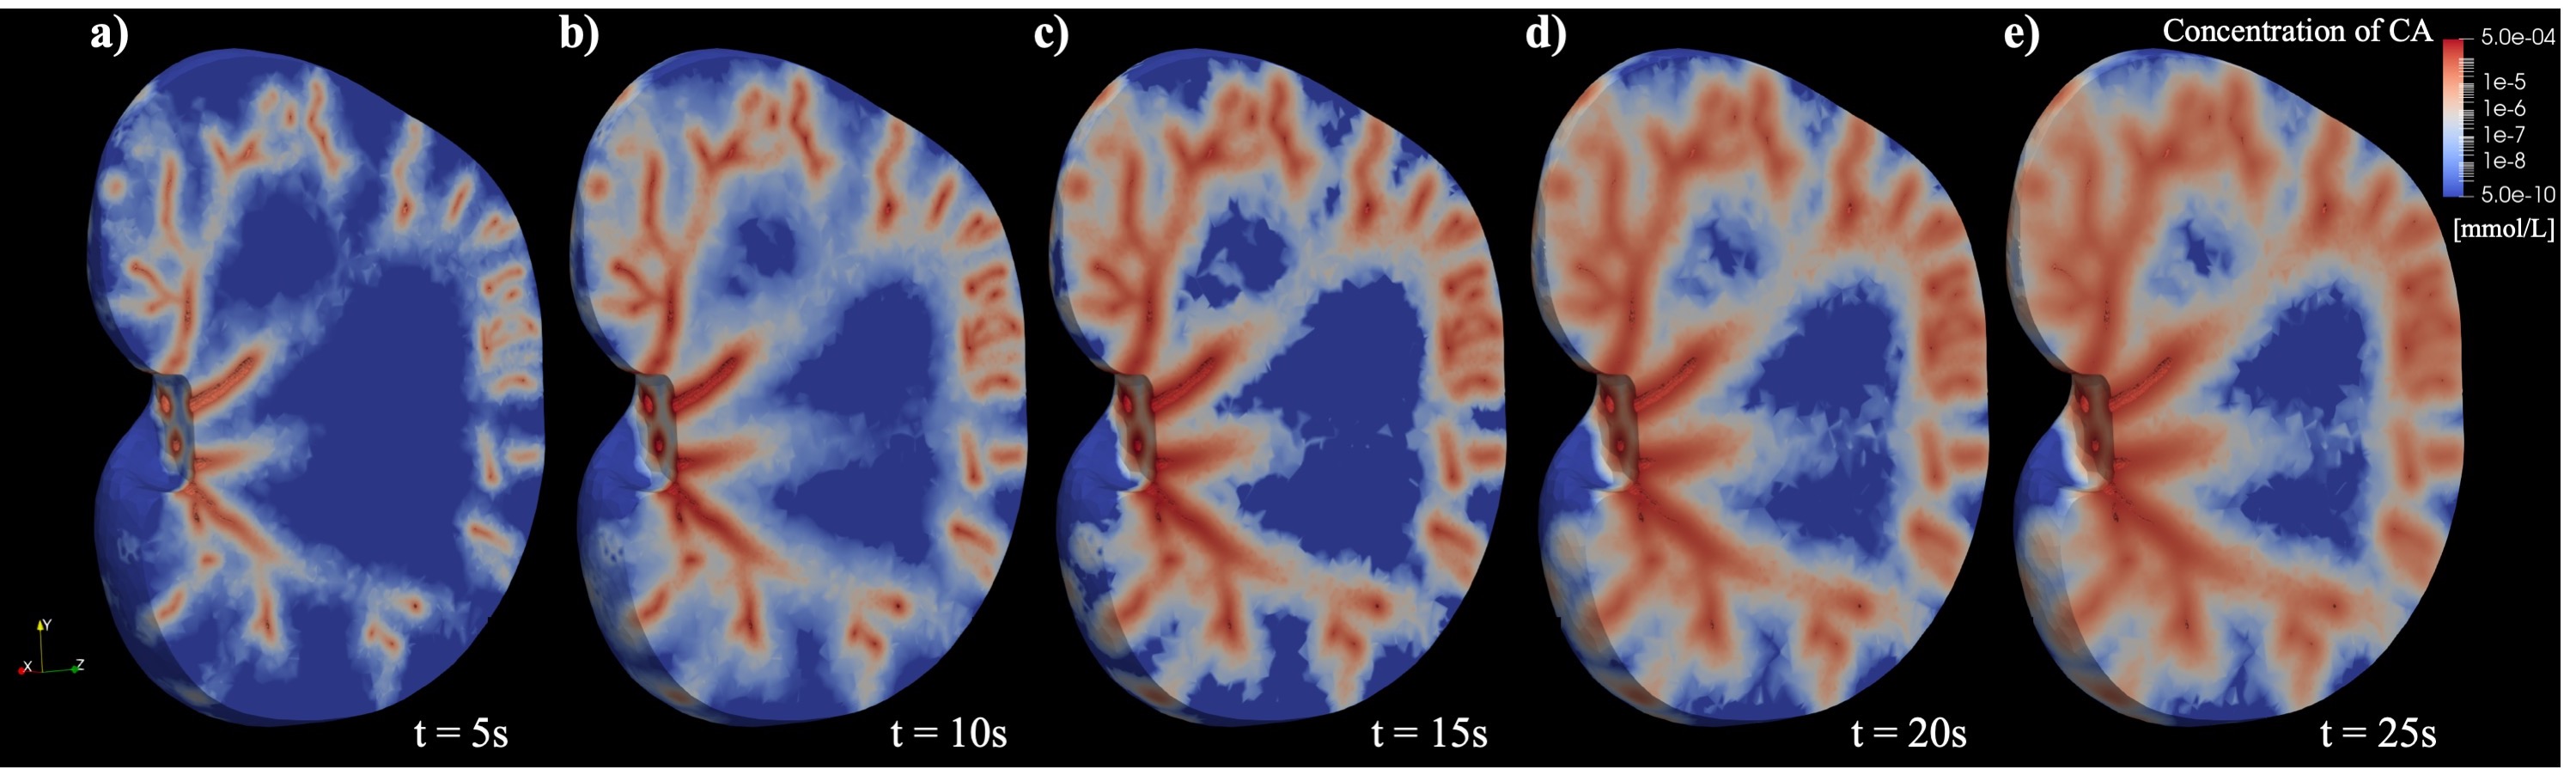
Based on the computed steady-state flow, the delivery of contrast agent over time can be estimated using the advection-diffusion equation. As shown in Figure 3, the tracer propagates through vasculature, and is delivered through the whole kidney tissue via convection and diffusion over time.
Discussion and Conclusions:
We have provided a preliminary report on a digital phantom which provides a detailed characterization of vasculature, realistic tissue properties, and physical flow dynamics. This dynamic digital phantom can be used to simulate perfusion and diffusion MRI techniques, and systematically evaluate new MRI acquisition reconstruction and image processing techniques.Acknowledgements
NCI U01CA142565, U01CA174706, and R01 CA218700. CPRIT RR160005. T.E.Y. is a CPRIT Scholar in Cancer Research. MR histology images courtesy of Duke Center for In Vivo Microscopy.References
[1] Hsu CM. Three-dimensional computerized breast phantom based on empirical data. Dissertation Abstracts International. 2010;72(02).
[2] Segars WP, Sturgeon G, Mendonca S, Grimes J, Tsui BM. 4D XCAT phantom for multimodality imaging research. Medical physics. 2010;37(9):4902-15.
[3] Badano A, Badal A, Glick S, Graff CG, Samuelson F, Sharma D, Zeng R. In silico imaging clinical trials for regulatory evaluation: initial considerations for VICTRE, a demonstration study. In Medical Imaging 2017: Physics of Medical Imaging, vol. 10132, p. 1013220.
[4] Xie L, Cianciolo RE, Hulette B, Lee HW, Qi Y, Cofer G, Johnson GA. Magnetic resonance histology of age-related nephropathy in the Sprague Dawley rat. Toxicologic pathology. 2012;40(5):764-78.
[5] Supplemental Material for Magnetic Resonance Histology of Age-related Nephropathy in Sprague-Dawley Rats. http://www.civm.duhs.duke.edu/lx201107/index.html
[6] Wu C, Hormuth DA, Oliver TA, Pineda F, Karczmar GS, Moser RD, Yankeelov TE. Patient-specific characterization of breast tumor-associated flow using image-guided computational fluid dynamics. Abstract #4230. May 2019, ISMRM 27th annual meeting, Montreal, QC, Canada.
[7] Jain RK. Normalizing tumor microenvironment to treat cancer: bench to bedside to biomarkers. Journal of Clinical Oncology. 2013;31(17):2205.
[8] Yang D, Ye Q, Williams DS, Hitchens TK, Ho C. Normal and transplanted rat kidneys: diffusion MR imaging at 7 T. Radiology. 2004;231(3):702-9.
[9] Winston JA, Safirstein RO. Reduced renal blood flow in early cisplatin-induced acute renal failure in the rat. American Journal of Physiology-Renal Physiology. 1985;249(4):F490-6.
[10] Shore AC. Capillaroscopy and the measurement of capillary pressure. British journal of clinical pharmacology. 2000;50(6):501-13.
Figures