1040
3D Spatially-Resolved Phase Graph1Medical Center University of Freiburg, Faculty of Medicine, University of Freiburg, Freiburg im Breisgau, Germany
Synopsis
A new open source recursive magnetization evolution calculation algorithm is proposed for simulating arbitrary pulse sequences efficiently and intuitively. It lifts the sequence symmetry requirements of the Extended Phase Graph and avoids intensive computations associated with direct Bloch equation simulations. The method further allows for tracking the evolution of the MR signal and corresponding k-vectors in presence of time-variant gradients with arbitrary orientations in 3D domain.
To illustrate the developed technique, two simple examples are presented: spoiler design for the PRESS-based magnetic spectroscopic imaging (MRSI) and fast off-resonance calculation for dictionary building in Magnetic Resonance Fingerprinting (MRF).
Introduction
As a Fourier approach to solving the Bloch equation, the Extended Phase Graph (EPG)1 exploits certain symmetries in pulse sequence to add up all magnetization coherence pathways efficiently. However, such Fourier-based dephasing states simplification is only valid if the configuration states evolutions don't depend on the absolute value of k. Hence, it doesn't allow for exploring the magnetization at arbitrary time points or calculating the echo intensities of non-symmetrical sequences. Although a recursive procedure for numerical calculation of MR signal intensities has been proposed earlier2, it was restricted to one-dimensional space. Furthermore, its calculation efficiency for non-symmetrical sequences suffered from an exponential increase of the number of configuration states or k-vectors.In this work, we propose an open-source 3D Spatially-Resolved Phase Graph method (3D-SRPG3) for tracing the signal evolution in presence of time-variant gradients with arbitrary orientations. Two simple illustrative examples are presented as demonstration: spoiler design for the PRESS-based MRSI and fast off-resonance calculation for MRF4.
Methods
3D-SRPGUnder the assumption of piece-wise constant 3D gradients, each isochromat entering Bloch equation is treated as a delta function, and the magnetization vector in Fourier space is modelled as the sum of a finite number of delta functions. Rather than counting the phase paths explicitly, Green function is employed to model the signal evolution. A novel grid-based merging approach is introduced to effectively calculate the signal evolution of non-symmetrical pulse sequences. Isotropic diffusion, magnetization relaxation and global transport, can be considered. Besides, by utilizing the Discrete Fourier Transform (DFT), the relevant k-vector coherences can be transformed into the 3D spatial domain at any time point to represent the resulting signal distribution intuitively.
PRESS-based MRSI simulation
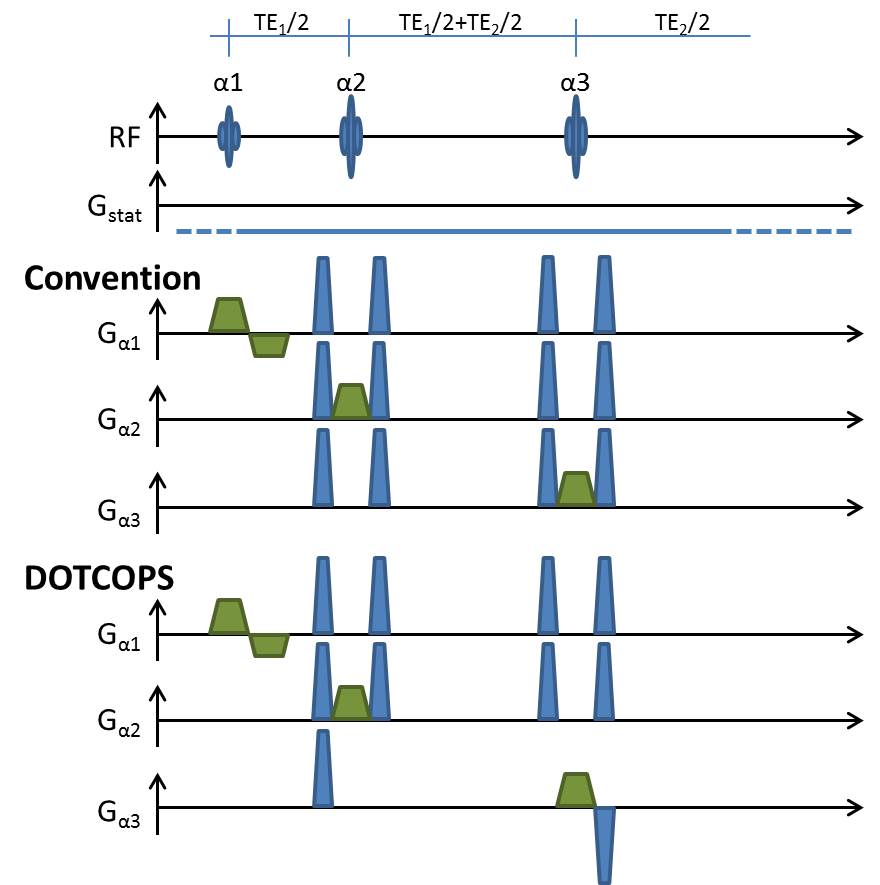
The schematic diagram of a typical PRESS sequence along with the conventional spoiler and the cutting-edge DOTCOPS5 spoiler schemes are depicted in Fig.1. In 3D-SRPG simulations, both volume selection and static gradients due to shim imperfections were considered.
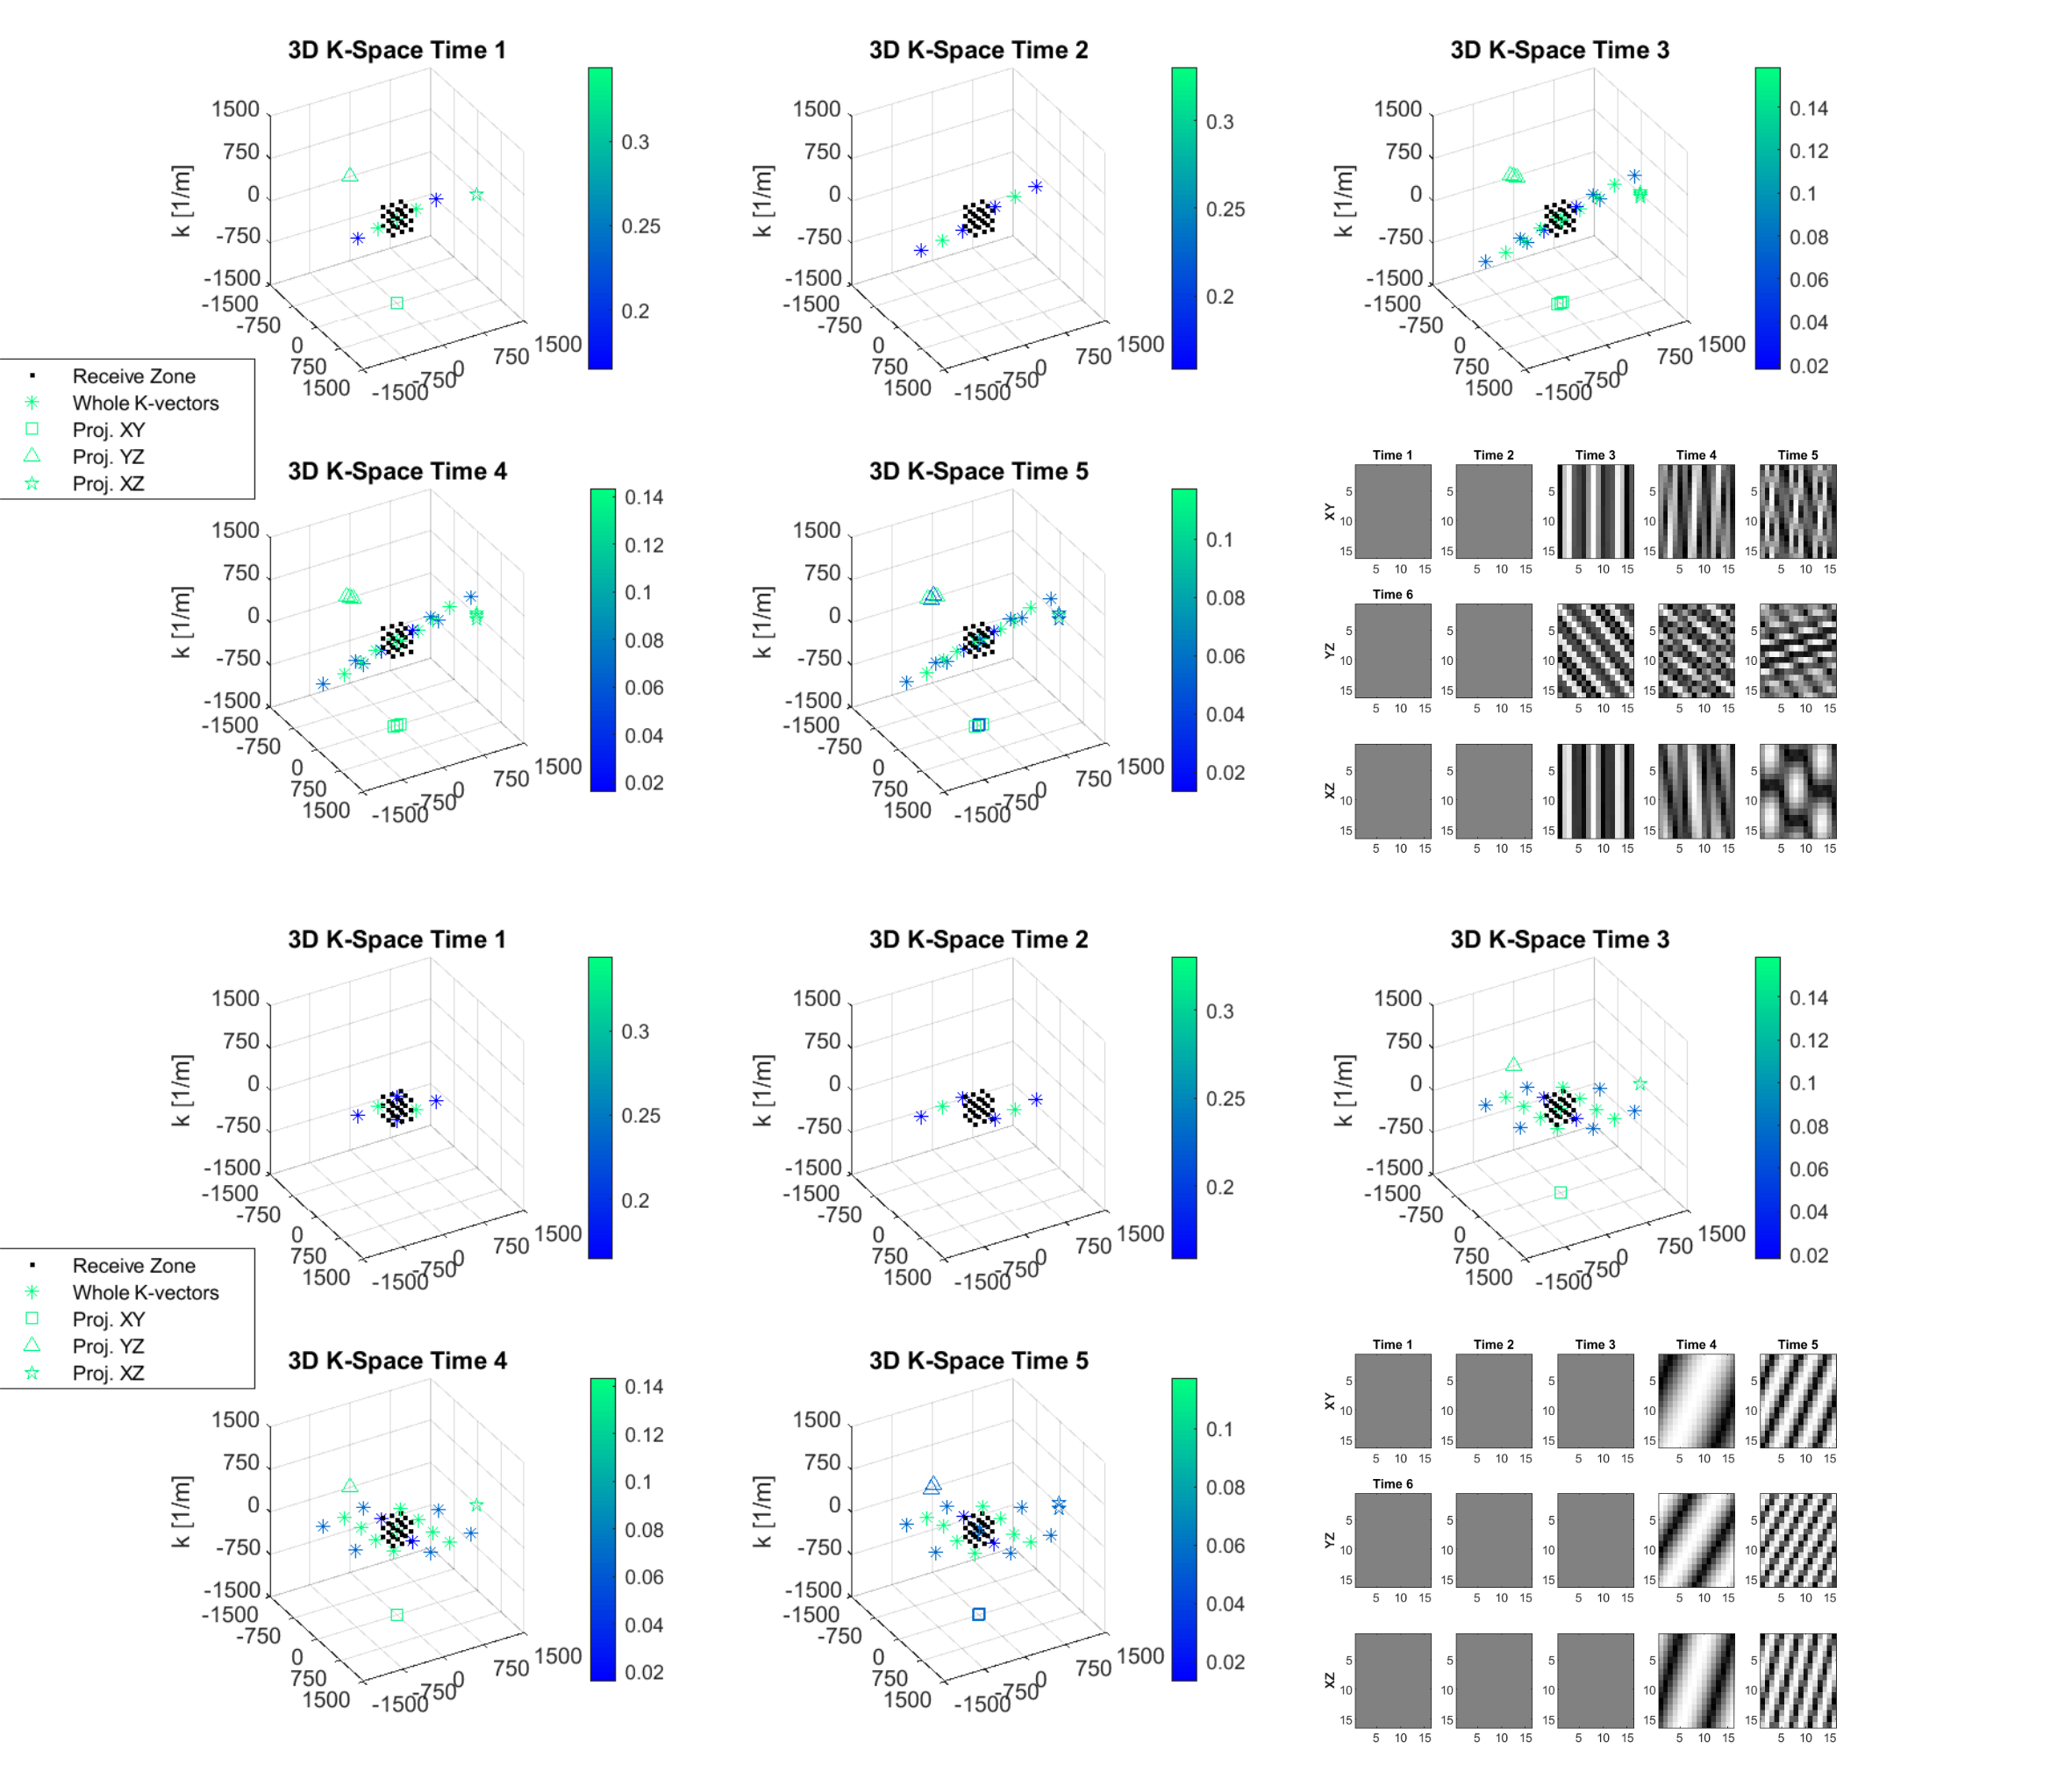
For analysis and illustration of the signal from VOI edges, α1 = 45°, α2 = 90°, and α3 = 90° with volume size (48 mm)3 and matrix (16×16×16) were assumed. The spoiling power was 208.3 m-1 and the strength of the static background gradient was assumed to be 1%, 2%, 3% of the slice-selection gradient for three axes, respectively. To illustrate the k-vector evolution for those spoiler settings, five snapshots were taken at TE1, TE1+TE2/2, TE (30ms), TE+20ms and TE+40ms.
Since increment for k vectors in each phase-encoding step is equivalent to a shift of sampled k-space center, the whole set of phase-encoding steps could be converted into a matrix of the sampled k-space region (receive zone). Both all k-vectors and receive zone are presented in the 3D k-space maps, with projections onto the three orthogonal planes for k-vectors lying inside the corresponding receive zone. Besides, the images transformed from the receive-zone k-vectors via the DFT are also depicted.
Off-resonance simulation in MRF sequences
Off-resonance simulations can be used to improve dictionary matching accuracy in MRF. In situations when the conventional EPG is not approptiate6, computation-expensive Bloch simulations are necessary for signal evolution estimation. Due to the high computation demand, a compromise is often made, limiting both off-resonance frequency resolution and accuracy. With the 3D-SRPG and DFT, off-resonance effects due to background gradients are illustrated by observing the signal evolution at different spatial positions in the presence of a linear gradient. Since the DFT is independent of the simulator, the entire off-resonance signal spectrum with an arbitrary frequency resolution can be calculated after a single simulation.
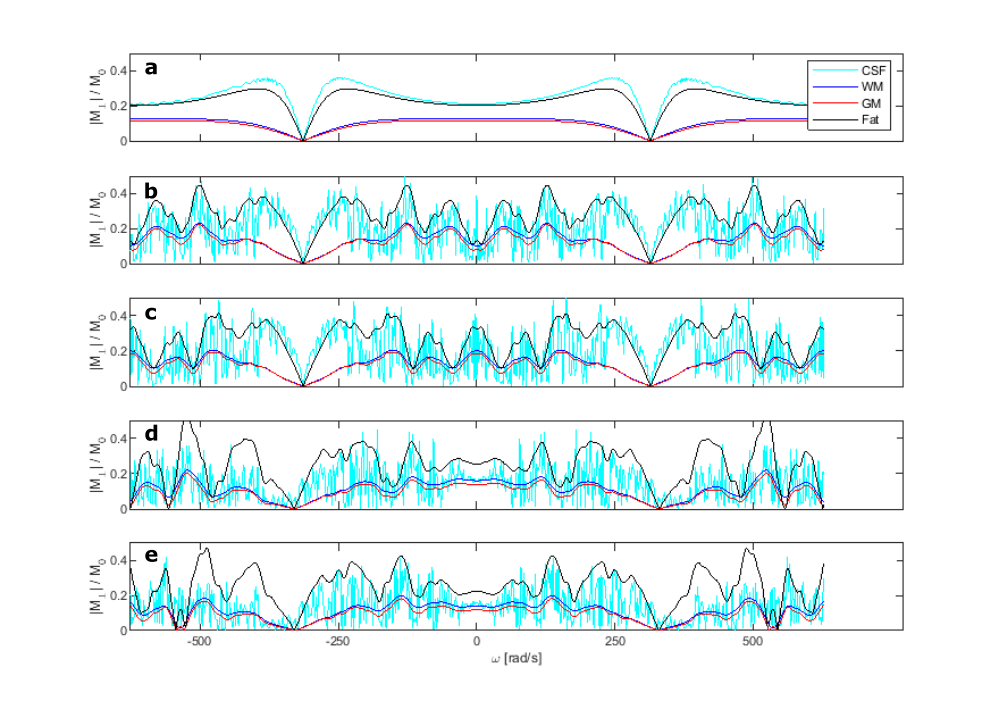
Three MRF sequences were tested as reported by Assländer et al.6: bSSFP, the original MRF pattern4 with fixed TE and TR and MRF pattern with a pseudo SSFP condition (pSSFP)6. All parameters were set close to those used in their reports (as shown in Fig.2), and four types of tissues were simulated.
Results & Discussion
In the PRESS example, when considering a static gradient, the spoiler gradients may fail to keep spurious k-vectors away from the k-vector of interest for both spoiler schemes (Fig.3). Spurious k-vectors and corresponding image-space patterns can be observed within the receive zone after TE for the conventional scheme, but only at Time 4 and Time 5 for the DOTCOPS scheme. It indicates the necessity of stronger spoiler gradients for suppressing spurious echo contamination in MRSI due to the larger k-space extent of the receive zone.In the off-resonance MRF example, the magnetization response spectrum is shown for bSSFP, MRF and pSSFP patterns at TE (Fig.4). Similar as the conclusion drawn by Assländer et al., the pSSFP presents a better separation ability for different tissues and fewer magnetization oscillations around the central band for consecutive pulses (d and e) than MRF (b and c).
The proposed algorithm provides a pictorial representation of the signal evolution for a more flexible 3D sequence design framework. Beyond our simple examples, the proposed approach can be helpful in more advanced applications such as spoiler design for sophisticated NMR sequences or k-space trajectory optimization for suppression of eddy-current-induced artifacts in compressed sensing sequences.
Conclusions
A new open-source 3D Spatially-Resolved Phase Graph algorithm3 is proposed to simulate the signal evolution with arbitrary inter-pulse spacing in presence of arbitrary gradients.Acknowledgements
The authors acknowledge Burak Akin for his support on 3D visualization.References
1. Hennig J. Echoes—how to generate, recognize, use or avoid them in MR‐imaging sequences. Part I: Fundamental and not so fundamental properties of spin echoes. Concepts in Magnetic Resonance. 1991;3(3):125-43.
2. Kiselev V G. Calculation of diffusion effect for arbitrary pulse sequences. Journal of magnetic resonance. 2003;164(2):205-211.
3. Gao X, Kiselev V G, Zaitsev M. 3D Spatially-Resolved Phase Graph, https://github.com/euler990/3D-Spatially-Resolved-Phase-Graph.git
4. Ma D, Gulani V, Seiberlich N, et al. Magnetic resonance fingerprinting. Nature. 2013;495(7440):187.
5. Landheer K, Juchem C. Dephasing optimization through coherence order pathway selection (DOTCOPS) for improved crusher schemes in MR spectroscopy. Magnetic resonance in medicine. 2019;81(4):2209-22.
6. Assländer J, Glaser SJ, Hennig J. Pseudo steady‐state free precession for MR‐fingerprinting. Magnetic resonance in medicine. 2017;77(3):1151-61.
Figures