1031
Substituting Gadolinium In Human Brain MRI Using DeepContrast1These authors contribute equally to this work and are joint first authors, New York, NY, United States, 2Electrical Engineering, Columbia University, New York, NY, United States, 3Biological Science, Columbia University, New York, NY, United States, 4Biomedical Engineering, Columbia University, New York, NY, United States, 5Facebook, San Francisco, NY, United States, 6Neurology, Columbia University, New York, NY, United States, 7Radiology, Columbia University, New York, NY, United States, 8Mortimer B. Zuckerman Mind Brain Behavior Institute, Columbia University, New York, NY, United States, 9Psychiatry, Columbia University, New York, NY, United States
Synopsis
MRI estimation of cerebral blood volume (CBV) is useful in mapping potential brain function. To obtain high-resolution CBV maps, it typically requires intravenous (IV) injections of Gadolinium-based contrast agents (GBCAs), the use of which has come under new scrutiny. Here, we design and implement a deep learning algorithm, DeepContrast, to estimate GBCA contrast directly from T1-weighted (T1W) structural MRI. The predicted contrast performs equally well as the GBCA-enhanced CBV map even in mapping subtle age-related functional changes in the human brain. Therefore, our study demonstrates the feasibility of substituting GBCA in human brain MRI using DeepContrast.
Introduction
Despite the significant utility in enhancing metabolic activities and consequently empowering diagnosis on abnormal behaviors such as tumors and lesions, exogeneous MRI contrast agents, with gadolinium-based ones being the most popular, experience serious concerns as researchers find potential long-term health risks1. A recent FDA announcement2 encouraged investigations on the idea to generate virtual contrast from the MRI scan images using deep learning3,4, but whether or not Gadolinium-based contrast agents (GBCAs) can be replaced by deep learning with a single non-contrast MRI modality as the input still remains an open question. In our study, we designed and implemented a deep learning algorithm, DeepContrast, to predict GBCA contrast directly from T1-weighted (T1W) structural MRI. DeepContrast utilizes the tissue/blood contrast that is embedded in the T1W images but imperceptible to the human eye. The predicted contrast is equivalent to its experimentally acquired counterpart, both indicated by objective metrics and demonstrated in its ability to preserve age-related metabolism changes.Methods
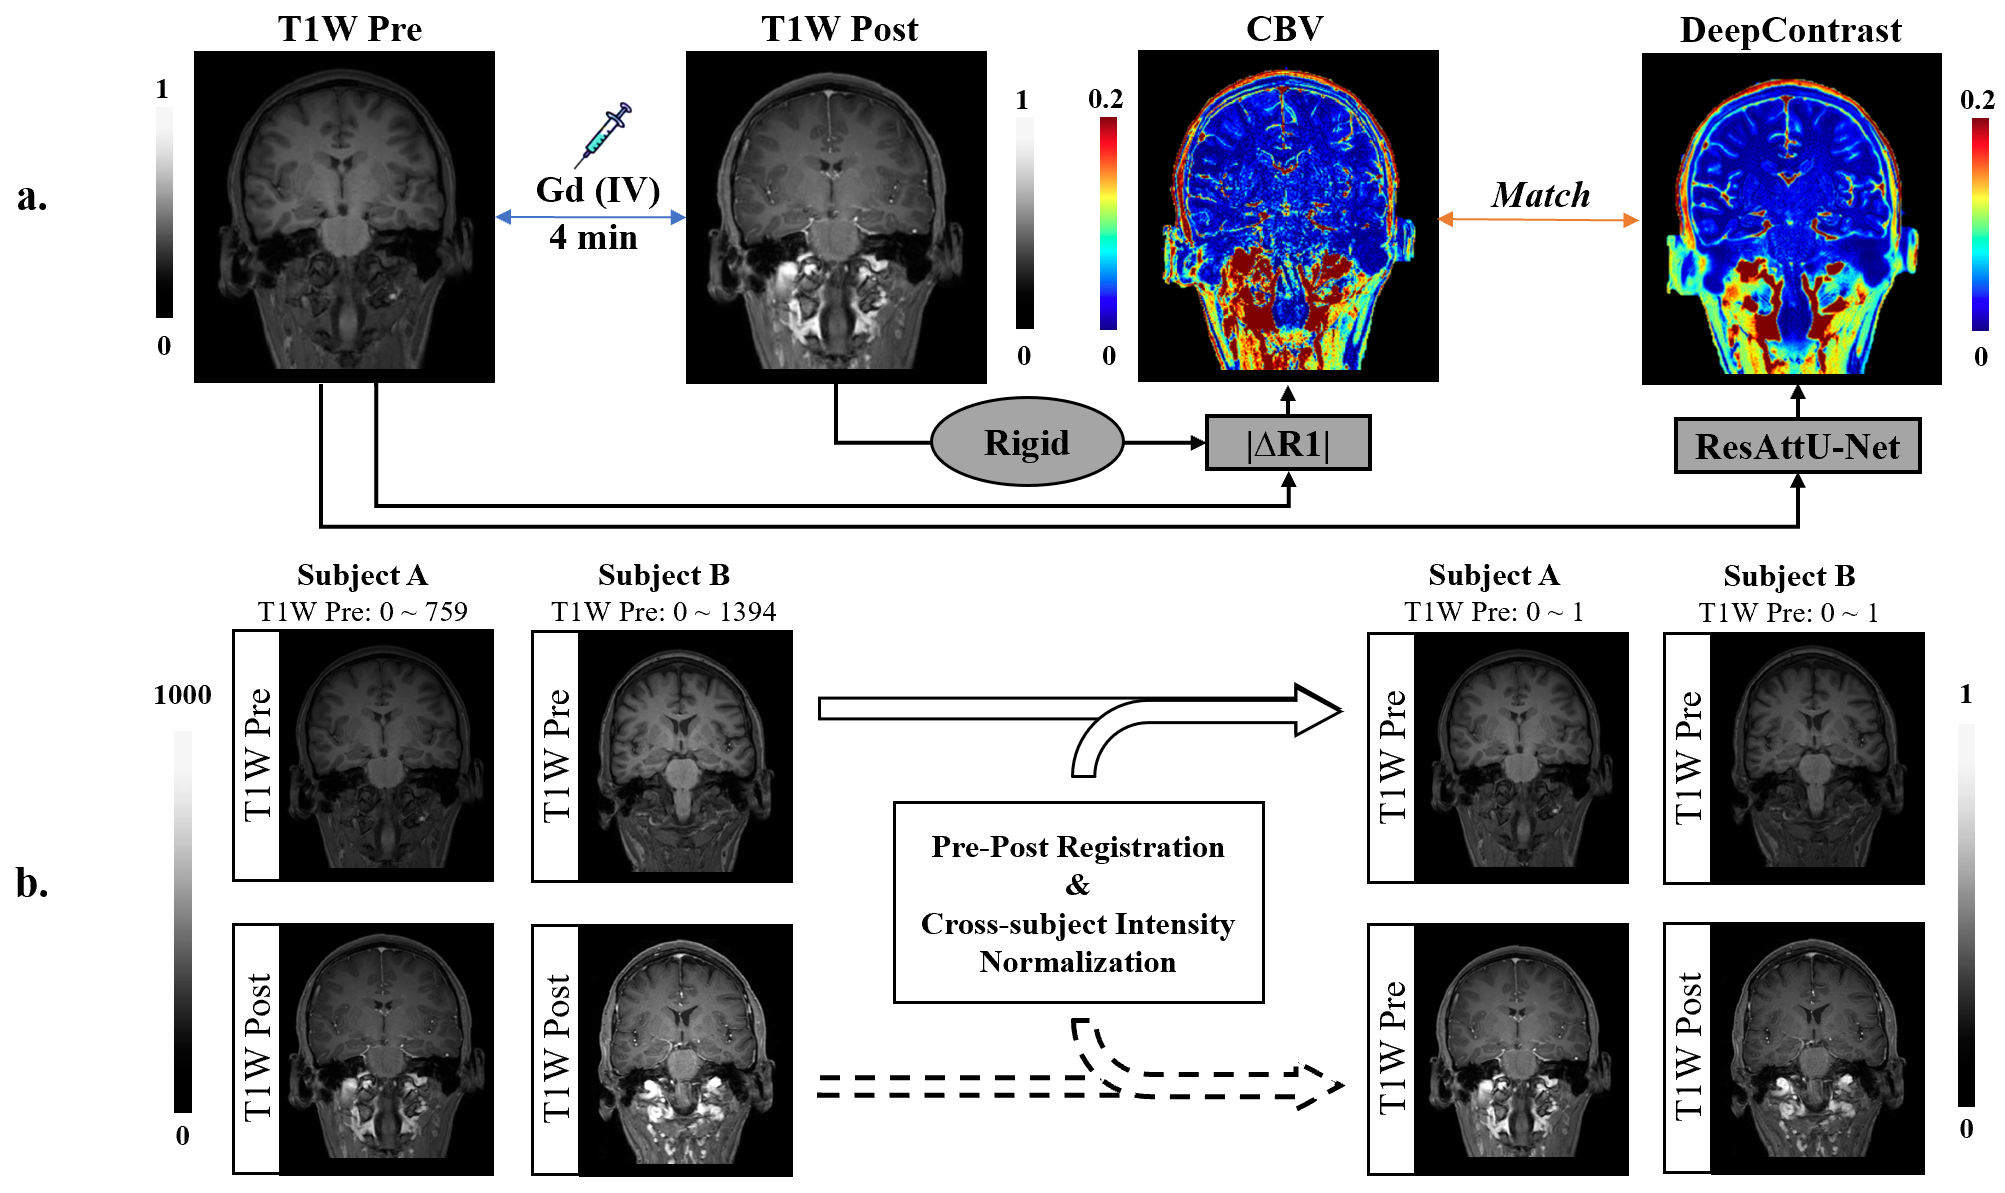
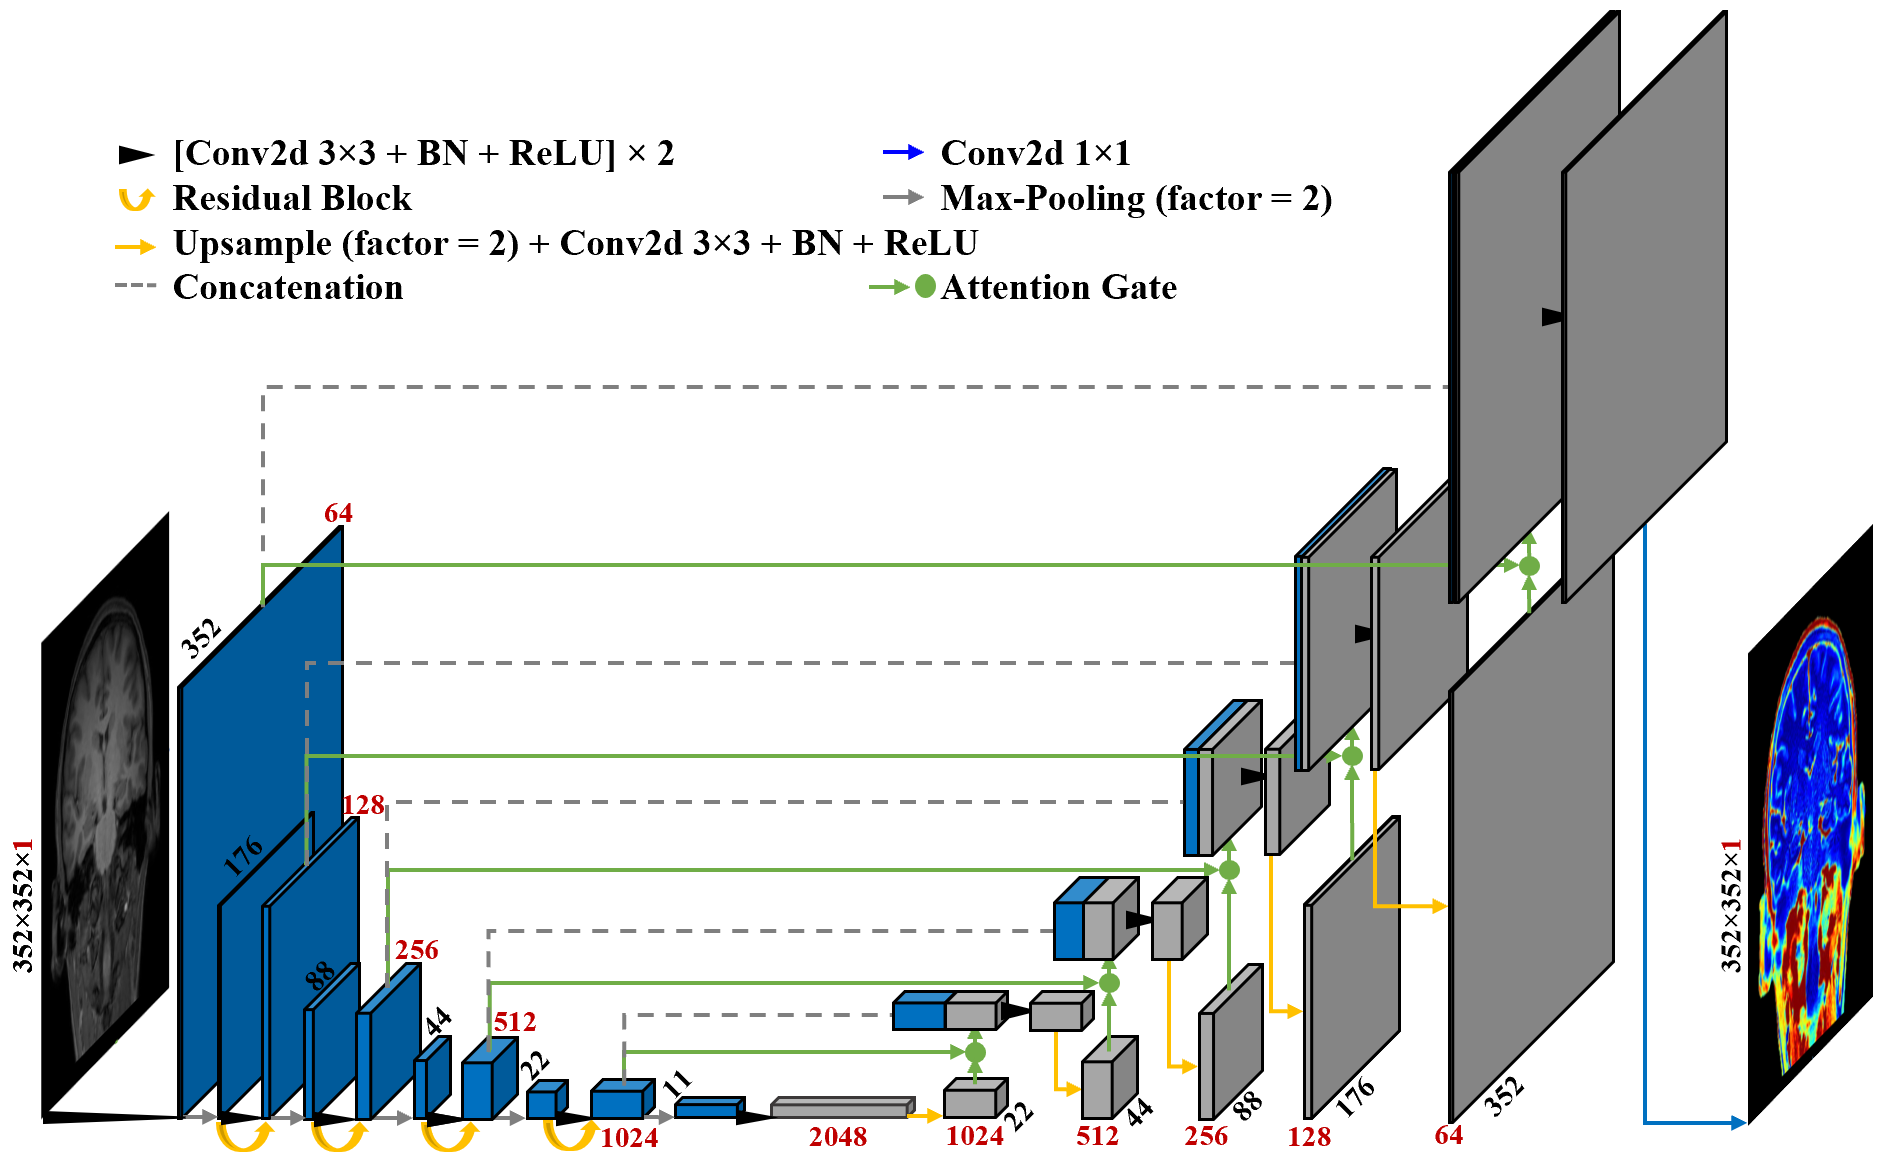
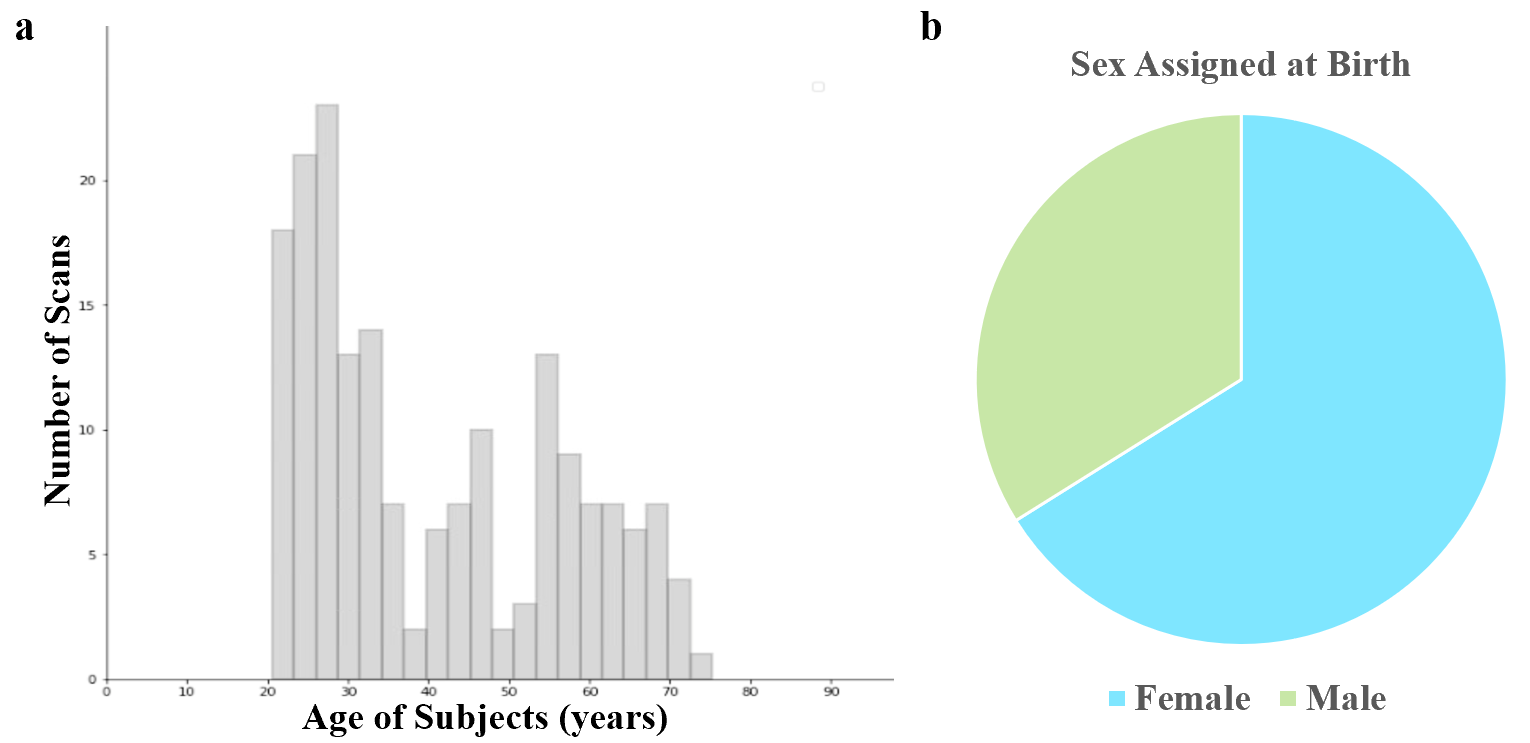
T1W human brain MRI scans are acquired at Columbia University using the protocol as described previously5,6,7, before (Pre) and 4 minutes after (Post) intravenous bolus injection of gadodiamide. Within each Pre-Post pair, the two scans share the same intensity scales. Scans are brain-extracted and spatially co-registered as described previously5,6,7. Intensity normalization is performed by mapping the Pre scans to the range of [0, 1] and propagating the scaling to the post scans. Cerebral Blood Volume (CBV), a metabolic mapping utilizing GBCA contrast, is calculated as the difference between Post and Pre for each pair. Figure 1 demonstrates the pipeline. A deep learning model with a Residual Attention U-Net architecture, as shown in Figure 2, is used to predict the GBCA contrast directly from the Pre scans. On the Pre and CBV scans of 600 subjects, a train-validation split is performed at a ratio of 6:1, while 180 subjects are left for the test set. Evaluation of the DeepContrast model comes in two aspects. In the first aspect, it is used to generate GBCA contrast predictions on the 180-scan test set and the resulting mappings are quantitatively compared to the ground truth CBV maps. In the second aspect, we test if DeepContrast is able to map the age-related CBV changes over the whole cortical mantle. To achieve this, the DeepContrast model is applied on a previously unseen dataset that consists of 178 T1W Pre scans where the subject population is described in Figure 4. The T1W Pre, CBV, and DeepContrast predictions are individually used to each generate an age-related regression t-map over 72 cortical regions-of-interest (ROIs) defined by FreeSurfer8 parcellation. The t-map is constructed by running a single-variable linear regression y~x, where the dependent variable y is the mean intensity of the ROI in each scan divided by the mean intensity of the top 10% brightest values in the white matter9 of that scan, while the independent variable x is the age of the subject. The regression t-value for each ROI is filled back to its spatial location to form the t-map. Significant negative values in the t-map indicate the brain regions with decline in metabolic activities as humans get older.Results
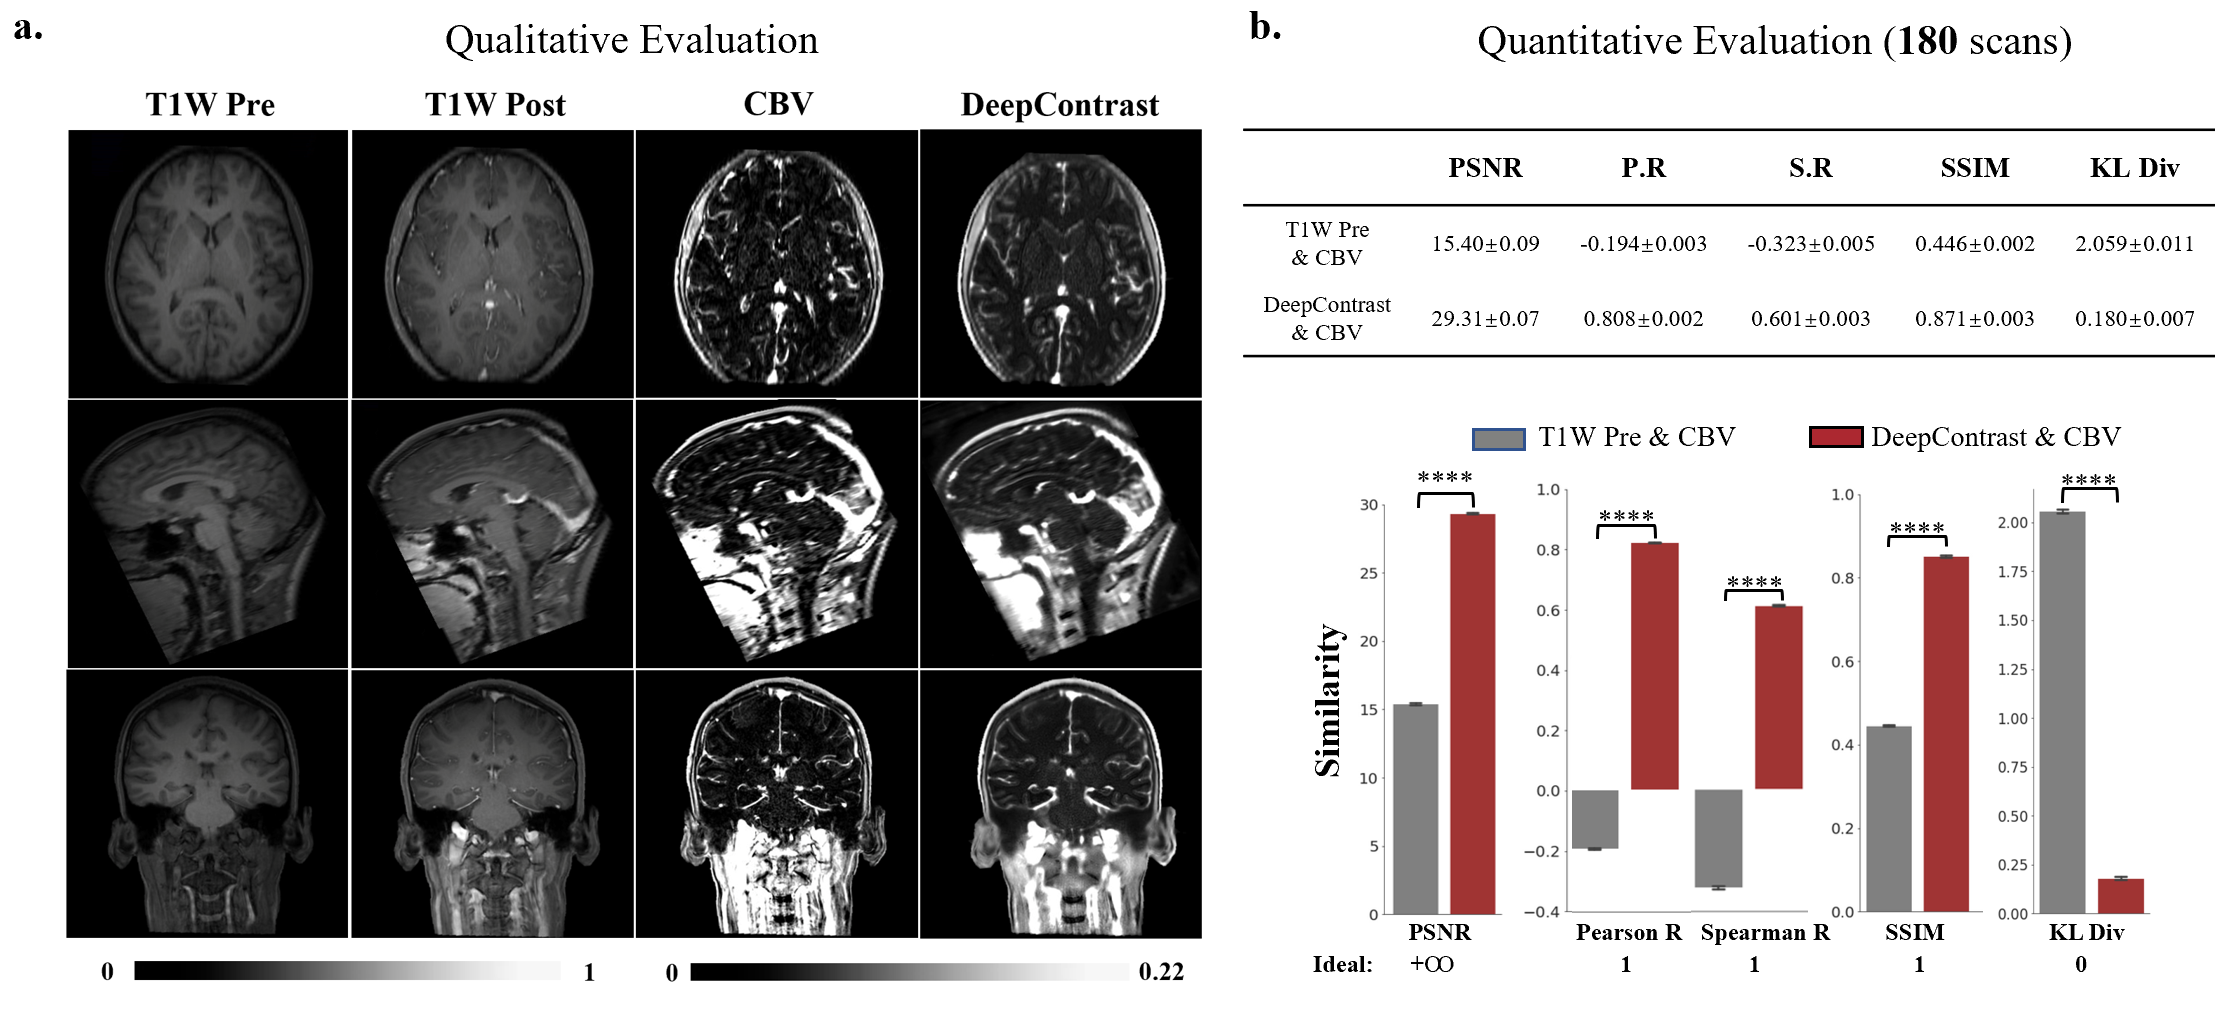
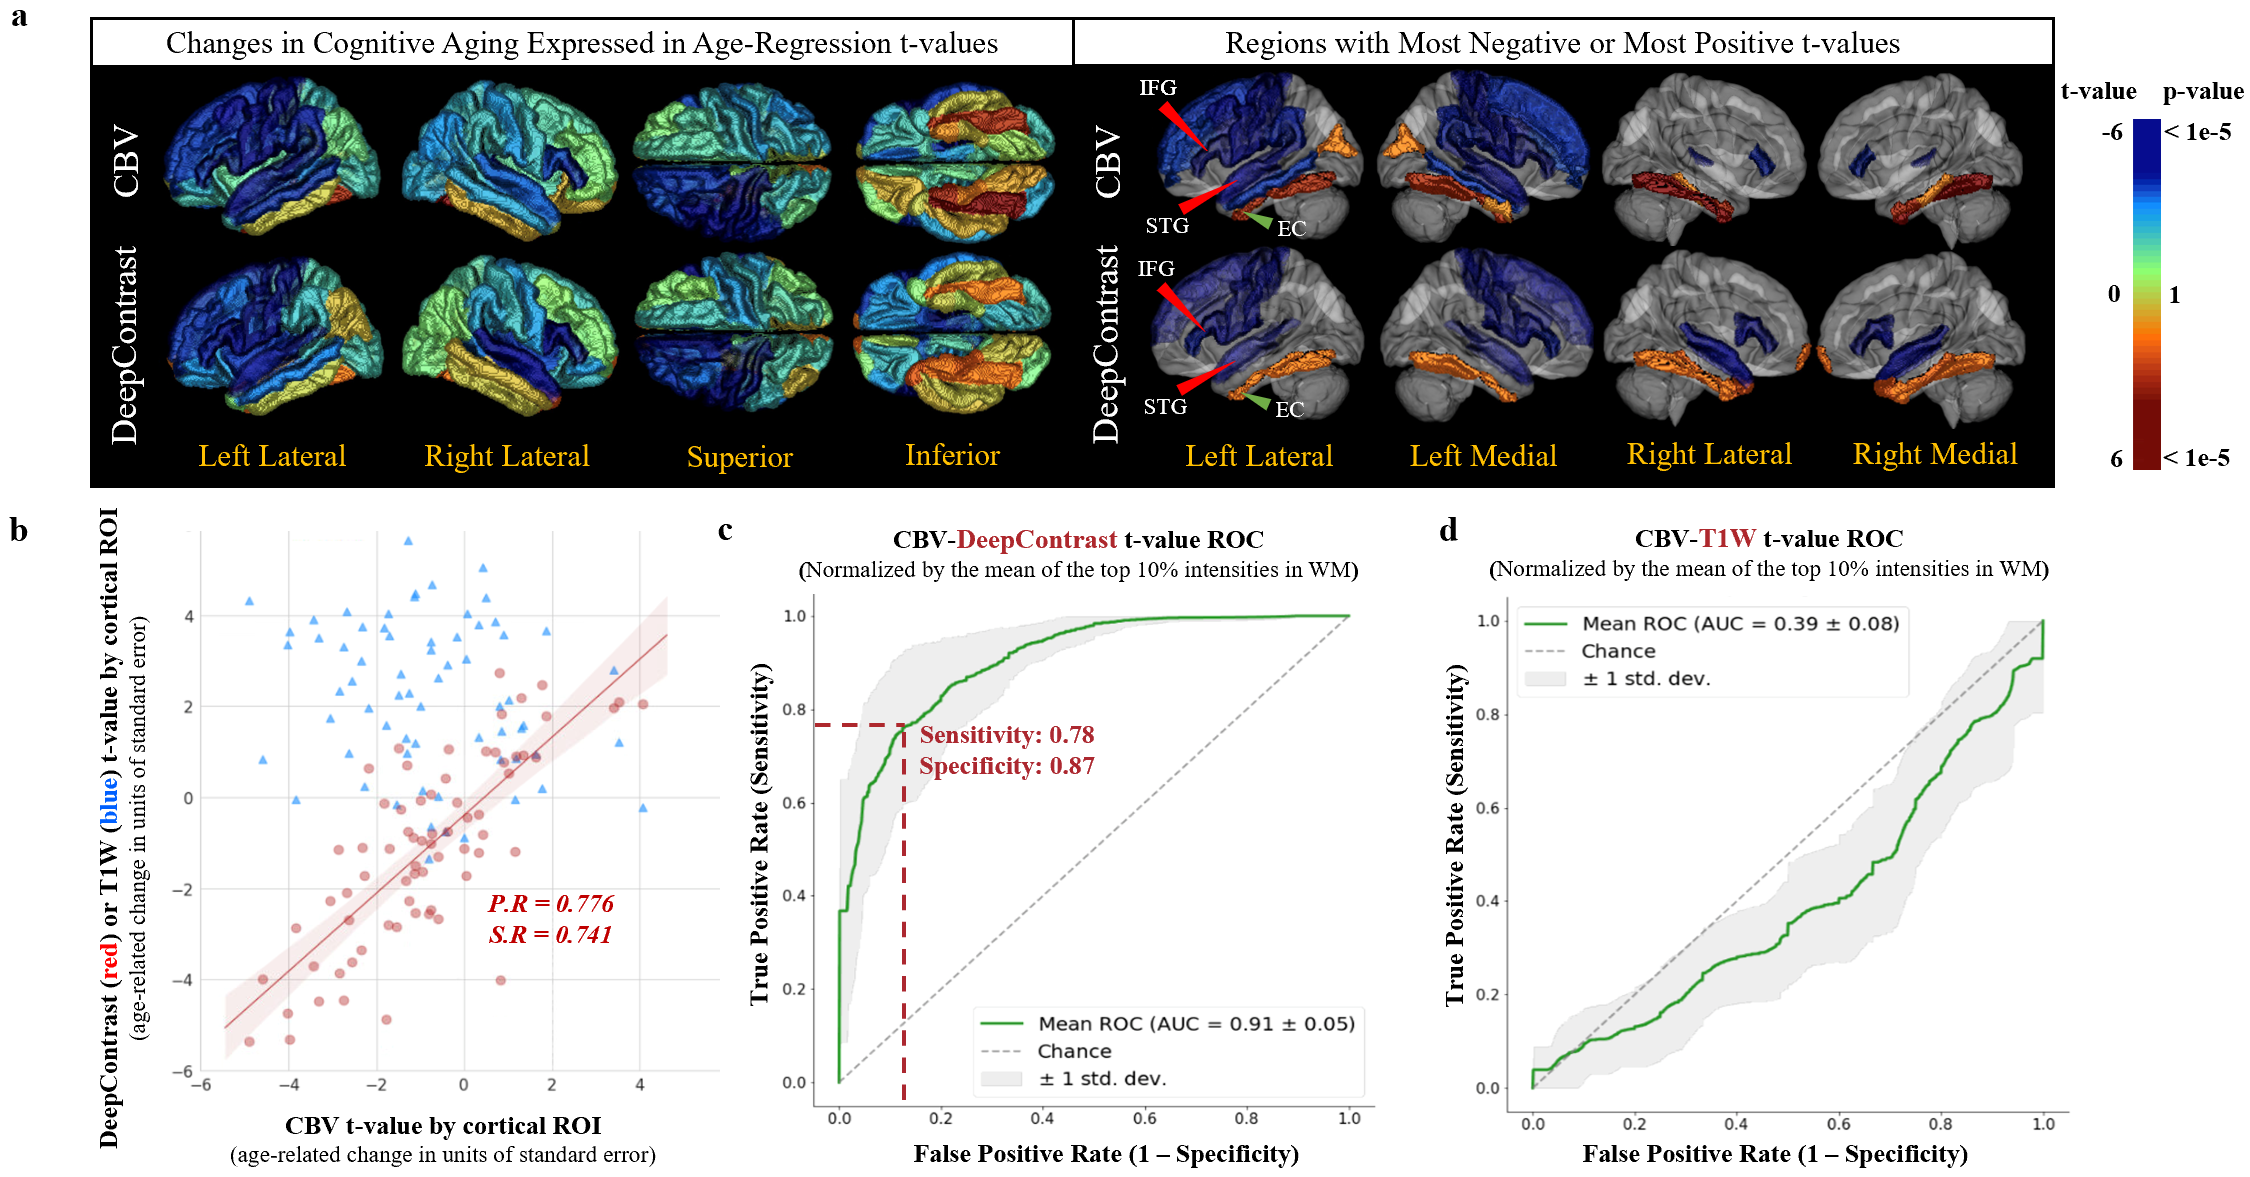
In the first aspect, the quantitative voxel-level analysis (Figure 3) yields a PSNR = 29.31, Pearson R = 0.808, Spearman R = 0.601, SSIM = 0.871, and KL divergence = 0.180. This assessment demonstrates that even though the structural T1W Pre scans are not similar to the CBV maps, DeepContrast can extract the metabolic information from them and resemble CBV. In the second aspect, DeepContrast is applied to examine imaging correlates of cognitive aging. Figure 5a shows that the spatial distribution of age-related metabolism changes seen in DeepContrast predictions are consistent to those in the CBV ground truth. Inferior frontal gyrus (IFG) and superior temporal gyrus (STG) show the most reliable aging-induced hypometabolism (indicated by the red arrows), while entorhinal cortex experiences the least metabolic degradation (indicated by the green arrow). These regions identified agree with existing findings10,11,12. Figure 5b breaks down the t-maps into a scatter plot with each point representing a cortical ROI, and it shows significant linear and monotonic correlation between DeepContrast prediction and CBV despite no correlation between T1W Pre and CBV. Figure 5c is the receiver operator characteristic (ROC) when treating the t-value concordance as a series of binary classification problems with 1000 different binarizing thresholds. The t-values from the 72 cortical ROIs are linearly mapped to [0, 1] respectively for CBV, T1W and DeepContrast predictions, and are afterwards used to indicate the regional t-value concordances. It can be inferred that the t-values in DeepContrast predictions have significant predictive power on its CBV counterpart, while those in T1W scans do not.Conclusion and Discussion
Results from our study demonstrate that the GBCA contrast mappings predicted by our DeepContrast model not only qualitatively and quantitatively resemble the ground truth CBV, but also truly contain equivalent information that can be used to generate insights that concur with existing findings. It is remarkable that our model can generate high-quality and potentially clinically-relevant contrast mappings in the human brain from nothing more than the T1W structural MRI scans, the single most prevalent modality in MRI.Acknowledgements
The CBV-MRI acquisitions were funded by US National Institutes of Health grants AG034618, AG035015, AG025161 and AG08702, the National Institute of Mental Health (NIMH) grant R01MH093398, the Taub Institute MRI Pilot Platform grant (MH), the American Epilepsy Society Seed grant AES2017SD2 (MH), the James S. McDonnell Foundation, and an unrestricted grant by MARS, Inc. The MRI data processing was performed at the Zuckerman Mind Brain Behavior Institute MRI Platform, a shared resource.References
[1] T. E. Smith, A. Steven, and B. A. Bagert, Gadolinium Deposition in Neurology Clinical Practice. Ochsner J, vol. 19, no. 1, pp. 17-25, Spring 2019, doi: 10.31486/toj.18.0111.
[2] FDA, FDA Drug Safety Communication: FDA warns that gadolinium-based contrast agents (GBCAs) are retained in the body; requires new class warnings.
[3] E. Gong, J. M. Pauly, M. Wintermark, and G. Zaharchuk, Deep learning enables reduced gadolinium dose for contrast-enhanced brain MRI. Journal of Magnetic Resonance Imaging, vol. 48, no. 2, pp. 330-340, 2018/08/01 2018, doi: 10.1002/jmri.25970.
[4] J. Kleesiek et al. Can Virtual Contrast Enhancement in Brain MRI Replace Gadolinium?: A Feasibility Study. Investigative Radiology, vol. 54, no. 10, pp. 653-660, 2019, doi: 10.1097/rli.0000000000000583.
[5] A. M. Brickman, U. A. Khan, F. A. Provenzano, L. K. Yeung, W. Suzuki, H. Schroeter, M. Wall, R. P. Sloan, S. A. Small, Enhancing dentate gyrus function with dietary flavanols improves cognition in older adults. Nature Neuroscience, vol. 17, no. 12, pp. 1798, 2014, doi: 10.1038/nn.3850.
[6] U. A. Khan, L. Liu, F. A. Provenzano, D. E. Berman, C. P. Profaci, R. Sloan, R. Mayeux, K. E. Duff, and S. A. Small, Molecular drivers and cortical spread of lateral entorhinal cortex dysfunction in preclinical Alzheimer's disease. Nature neuroscience, vol. 17, no. 2, pp.304, 2014, doi: 10.1038/nn.3606.
[7] F. A. Provenzano, J. Guo, M. M. Wall, X. Feng, H. C. Sigmon, G. Brucato, M. B. First, D. L. Rothman, R. R. Girgis, J. A. Lieberman, and S. A. Small, Hippocampal Pathology in Clinical High-Risk Patients and the Onset of Schizophrenia. Biological Psychiatry. 2019, doi: 10.1016/j.biopsych.2019.09.022.
[8] B. Fischl. FreeSurfer. Neuroimage, vol. 62, no. 2, pp.774-781, 2012, doi: 10.1016/j.neuroimage.2012.01.021.
[9] X. Feng, M. J. Hamberger, H. C. Sigmon, J. Guo, S. A. Small, and F. A. Provenzano. Temporal lobe epilepsy lateralization using retrospective cerebral blood volume MRI. NeuroImage: Clinical, vol. 19, pp. 911-917, 2018, doi: 10.1016/j.nicl.2018.05.012.
[10] S. M. McGinnis, M. Brickhouse, B. Pascual, and B. C. Dickerson. Age-Related Changes in the Thickness of Cortical Zones in Humans. Brain topography, vol. 24, no. 3-4, pp. 279, 2011, doi: 10.1007/s10548-011-0198-6.
[11] J. L. Price, A. I. Ko, M. J. Wade, S. K. Tsou, D. W. McKeel, and J. C. Morris, Neuron number in the entorhinal cortex and CA1 in preclinical Alzheimer disease. Archives of neurology, vol. 58, no.9, pp.1395-1402, 2001, doi: 10.1001/archneur.58.9.1395.
[12] A. Bakkour, J. C. Morris, D. A. Wolk, and B. C. Dickerson. The effects of aging and Alzheimer's disease on cerebral cortical anatomy: specificity and differential relationships with cognition. Neuroimage, vol. 76, pp.332-344, 2013, doi: 10.1016/j.neuroimage.2013.02.059.
Figures