1030
SUBSTITUTING GADOLINIUM IN BRAIN MRI USING DEEPCONTRAST: A PROOF-OF-CONCEPT STUDY IN MICE1Department of Biomedical Engineering, Columbia University, New York, NY, United States, 2Department of Electrical Engineering, Columbia University, New York, NY, United States, 3Department of Biological Science, Columbia University, New York, NY, United States, 4Department of Radiation Oncology, Columbia University, New York, NY, United States, 5Columbia University Irving Medical Center, Columbia University, New York, NY, United States, 6Department of Pathology and Cell Biology, Columbia University, New York, NY, United States, 7Department of Psychiatry, Columbia University, New York, NY, United States, 8Departments of Neurology, Columbia University, New York, NY, United States, 9Departments of Radiology, Columbia University, New York, NY, United States, 10Mortimer B. Zickerman Mind Brain Behavior Institute, Columbia University, New York, NY, United States
Synopsis
Cerebral blood volume (CBV) is a hemodynamic correlate of oxygen metabolism and reflects brain activity and function. High-resolution CBV maps can be generated using the steady-state gadolinium-enhanced MRI technique. Recent studies suggest that the exogenous gadolinium based contrast agent (GBCA) can accumulate in the brain after frequent use. Here, we develop and optimize a deep learning algorithm, DeepContrast, which performs equally well as exogenous GBCA in mapping CBV of the normal brain tissue and enhancing glioblastoma. Together, these studies validate our hypothesis that a deep learning approach can potentially replace the need for GBCAs in brain MRI.
INTRODUCTION
Information extracted from MRI can be dramatically enhanced with the use of the exogenous contrast agent, gadolinium (Gd). Moreover, since steady-state Gd-enhanced MRI technique can generate high-resolution maps of the cerebral blood volume (CBV) which tightly coupled with brain metabolism and can be used as an fMRI tool.1 More recently, this CBV-fMRI approach has been used to detect the earliest stages of Alzheimer's disease and schizophrenia, and to map the effects of normal aging.2-4Despite its significant advantages, reports of gadolinium retention in the brain and body after previous exposure to gadolinium based contrast agents (GBCAs) raise serious safety concerns in the clinical community.5 Given the potential safety risks and the FDA warning,6 there is an urgent need to develop alternative imaging techniques that reduce7 the dose of Gd or eliminate8 it entirely to prevent Gd retention and ensure patient safety and imaging efficiency. Although the question still remains unclear whether it is feasible to derive GBCA contrast directly from single non-contrast MRI modality.
In the current study, we test this idea in mice as a proof-of-concept study before translating the approach to humans. We utilize the residual attention U-Net (ResAttU-Net) in our deep learning model to estimate Gd contrast from noncontrast T2-weighted (T2W) MRI for CBV mapping with both wild-type (WT) and Glioblastoma (GBM) mice at 9.4T.
MATERIAL AND METHODS
2.1. Animal SubjectThe WT group contained 49 healthy C576J/BL male mice scanned at 12-14 months. The GBM group contained 10 age-matched C576J/BL male mice that were injected with PDGFB (+/+) PTEN (-/-) p53 (-/-) GBM cells.9 50,000 cells in 1 μL were stereotactically injected into the brain. GBM mice were scanned 10 days after injection.
2.2. MRI Acquisition and Preprocessing
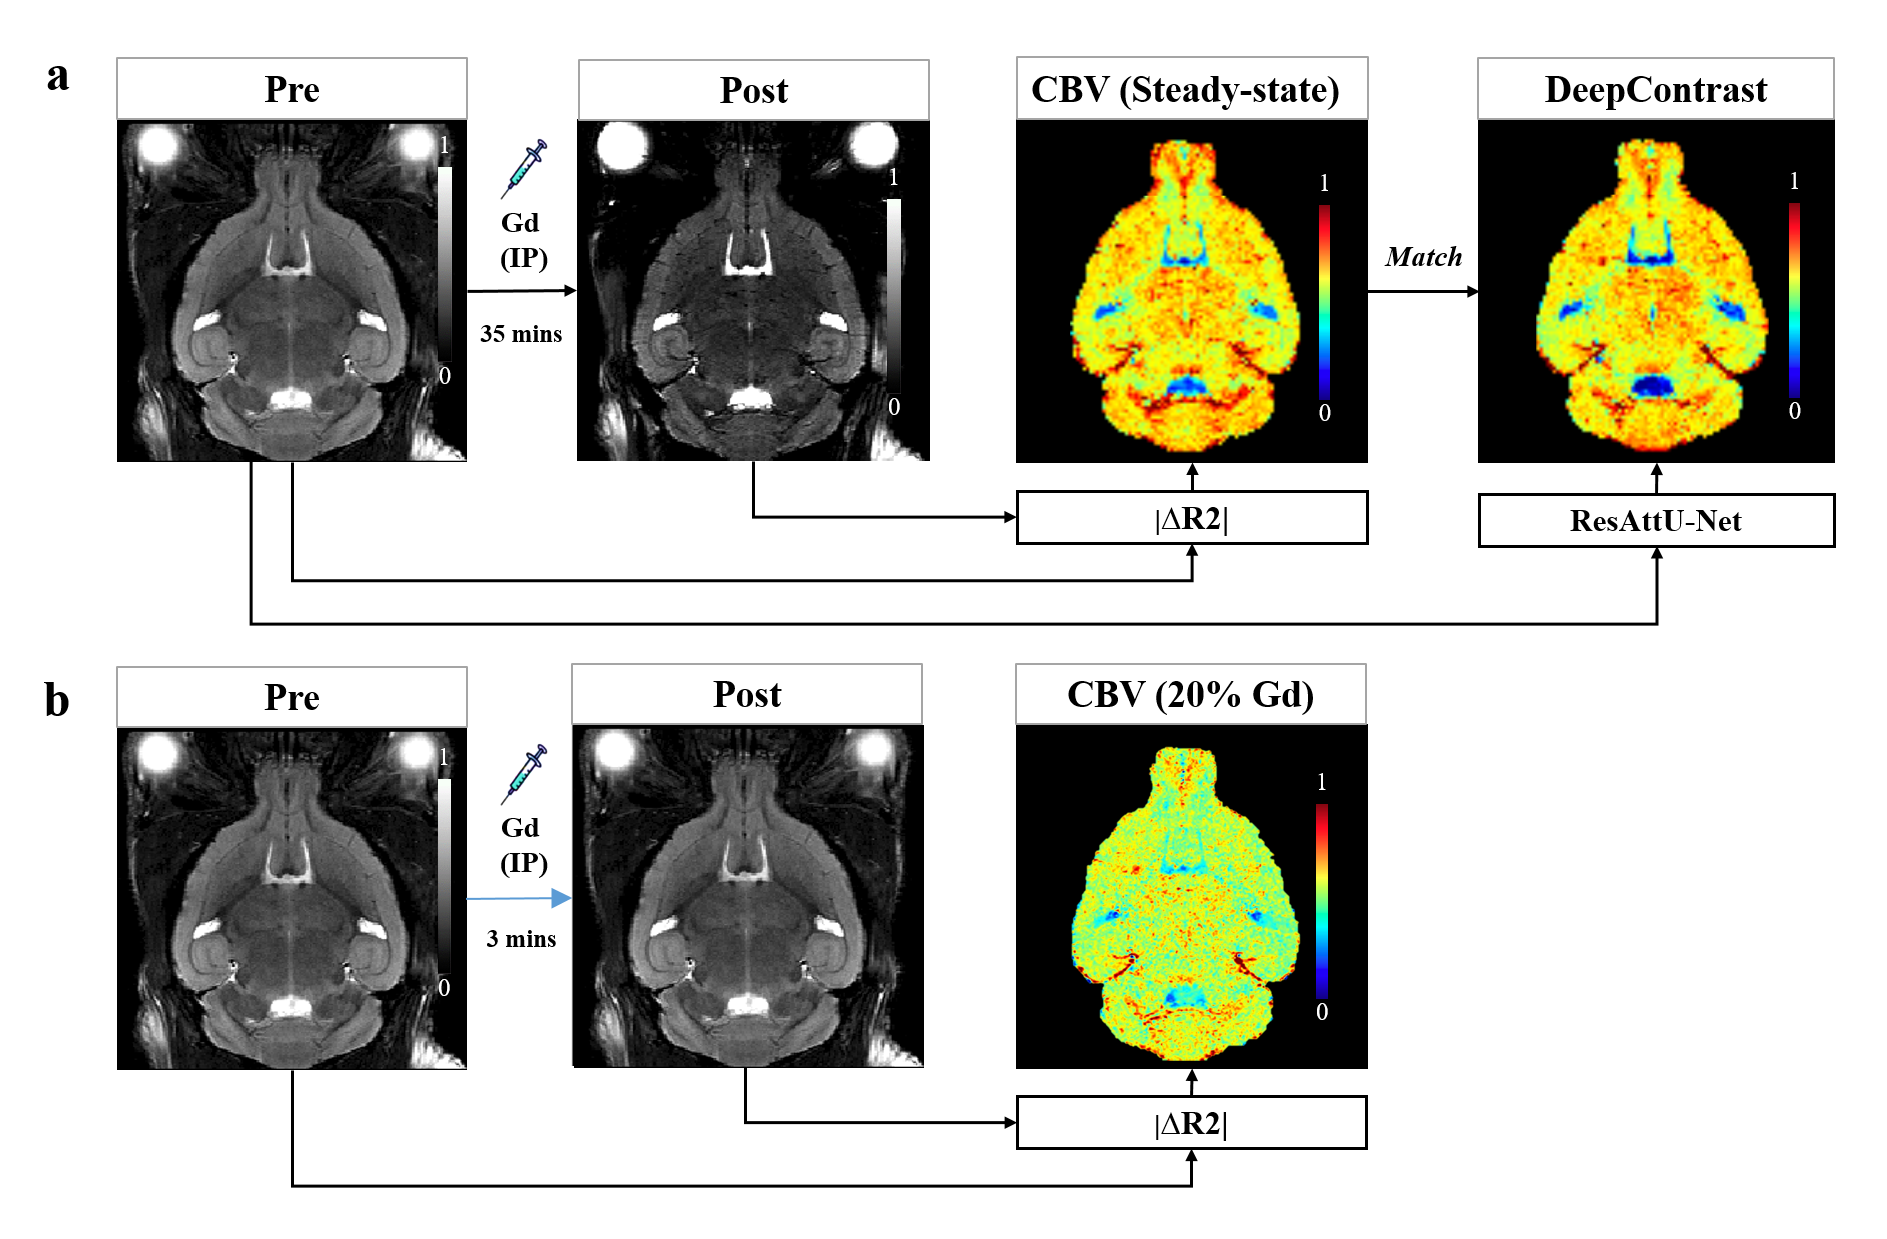
For each mouse, MRI scans were acquired using the 2D T2W Turbo Rapid Acquisition with Refocused Echoes (RARE) sequence at 9.4T (i.e., TR/TE = 3500/45, RARE-factor = 8, 76 µm in-plane resolution, 450 µm slice thickness; Bruker Biospec 94/30 USR equipped with CryoProbe). Figure 1 shows the MRI acquisition and preprocessing pipeline.
2.3. Deep Learning Model
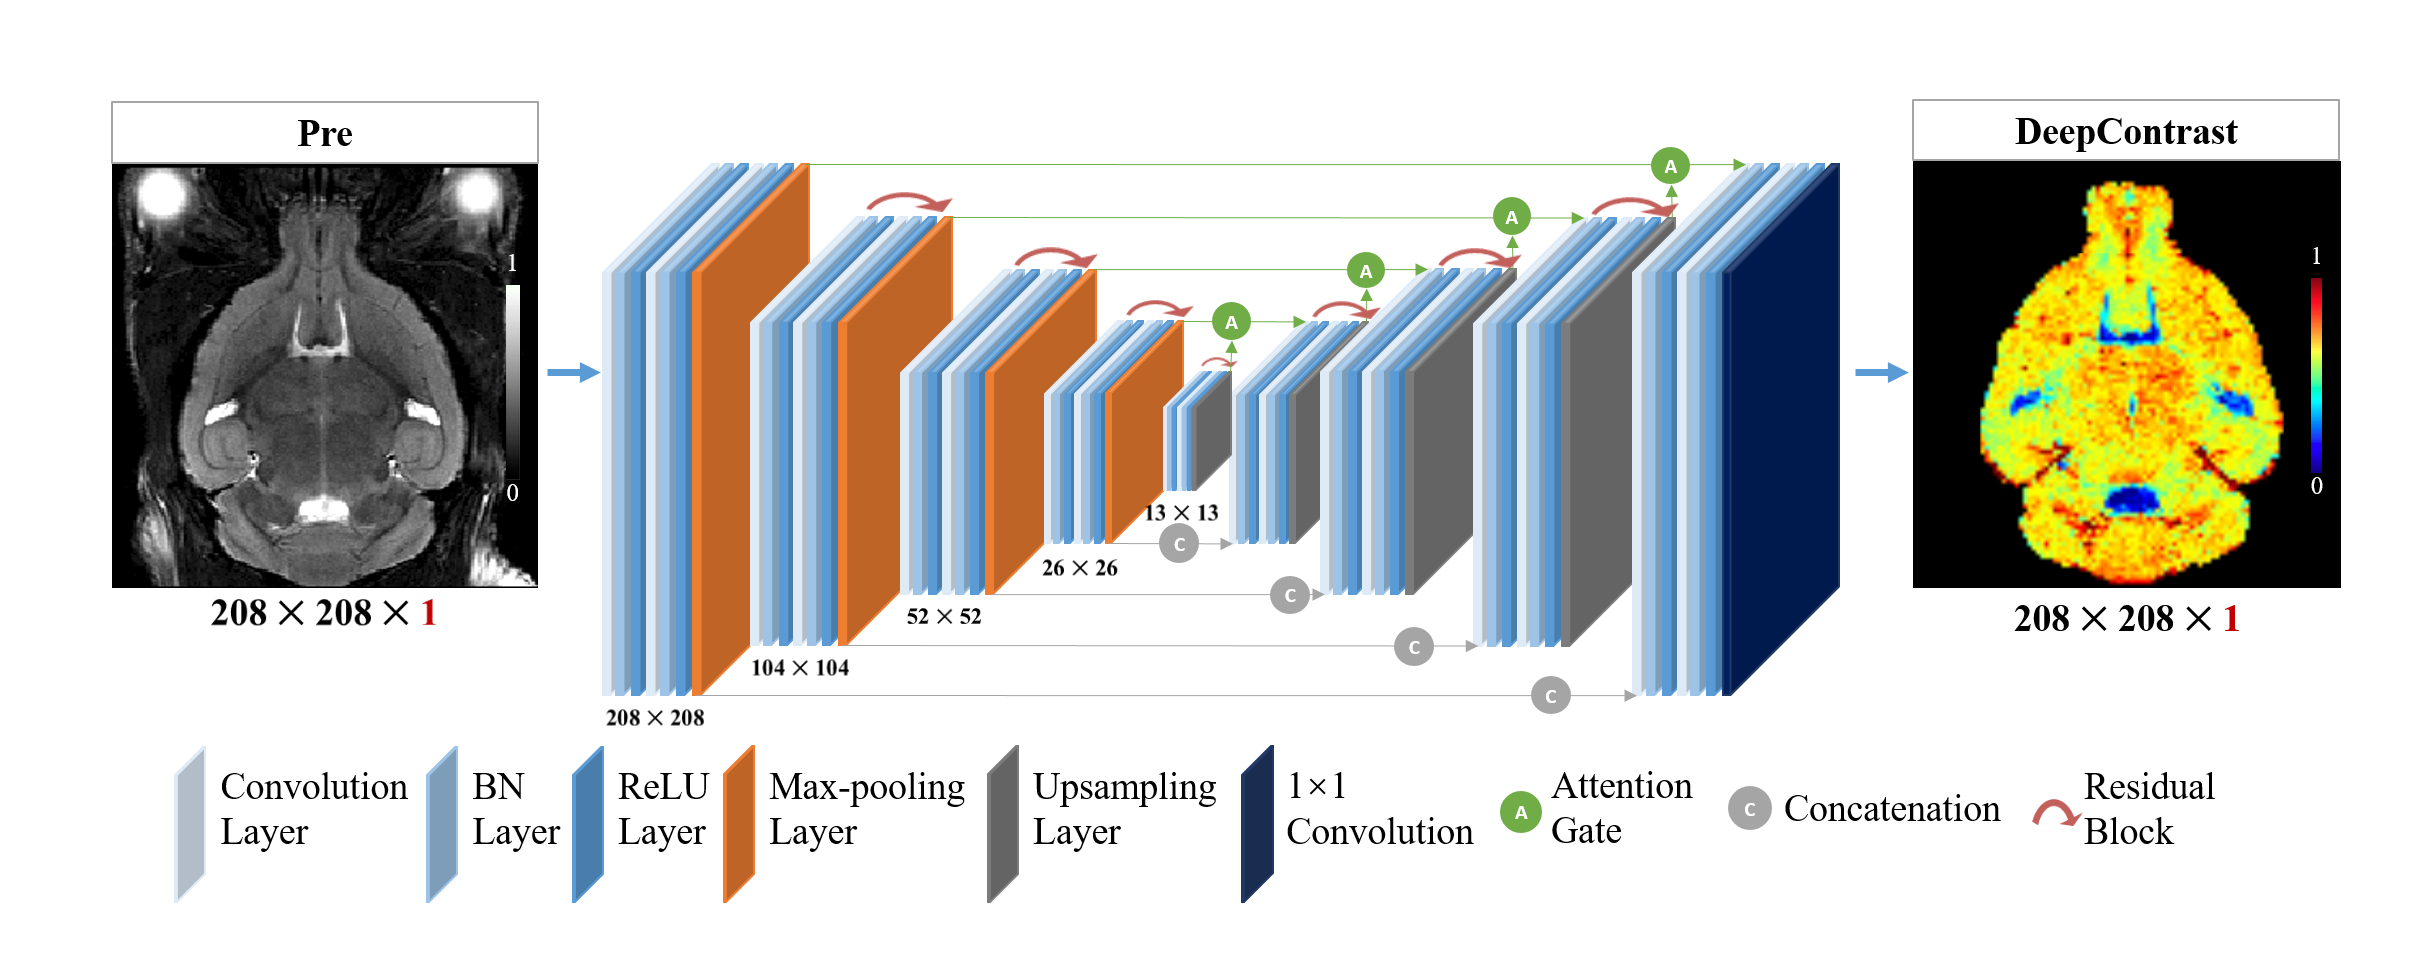
The deep learning architecture is the out-stand five-layer ResAtt-UNet as illustrated in Fig.2. We implemented our model using PyTorch with CUDA-10.0, NVIDIA RTX 2080-TI GPUs and CentOS-6. We first apply the ResAttU-Net to derive the steady-state CBV maps in WT mice directly from their noncontrast pre-scans with a randomized 37-6-6 train-validation-test split. In addition, we aimed to further verify its utility in the enhancement of pathology visibility and delineation of brain lesions by adding 6 GBM mice scans to the training and retraining the model.
RESULTS
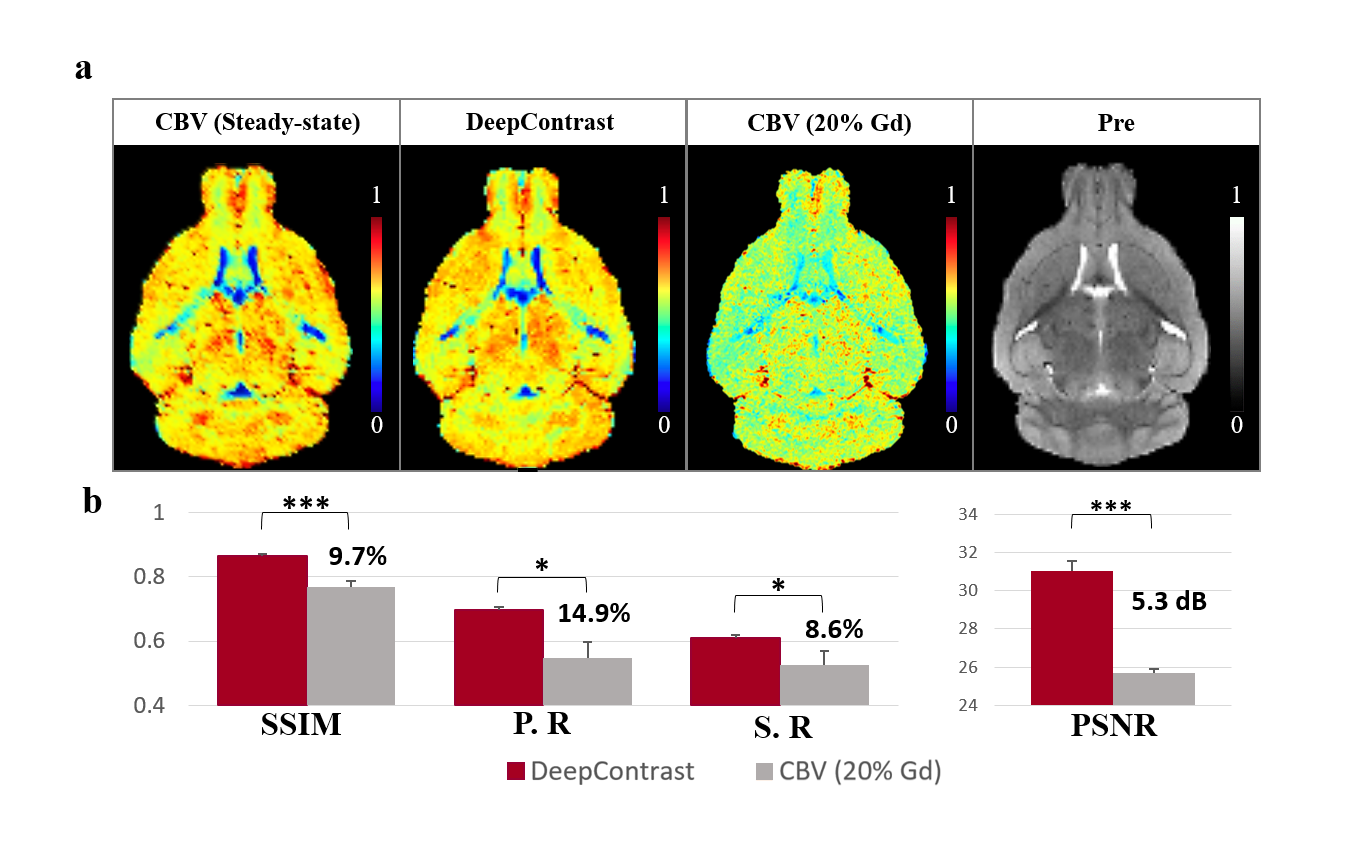
3.1. Performance of DeepContrast in Normal Brian CBV MappingExample of the DeepContrast prediction and the quantitative metrics of the standalone 6 testing subjects are shown in Fig.3. DeepContrast captured the high contrast and fine details of small blood vessels with high similarity to the CBV ground truth in the normal brain. As shown in Fig.3., the pre-image alone can provide promising prediction results that show stronger enhancement compared to the 20% low-dose CBV, a straight forward approach to reduce Gd, and are more consistent with the steady-state CBV maps.
3.2. Performance of DeepContrast in GBM CBV Enhancement
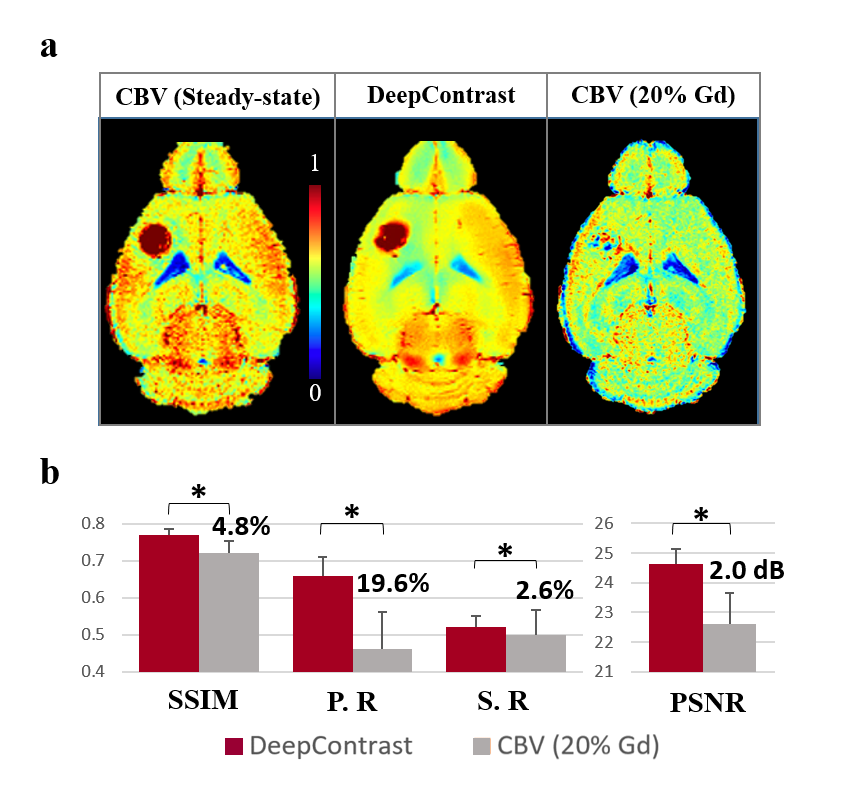
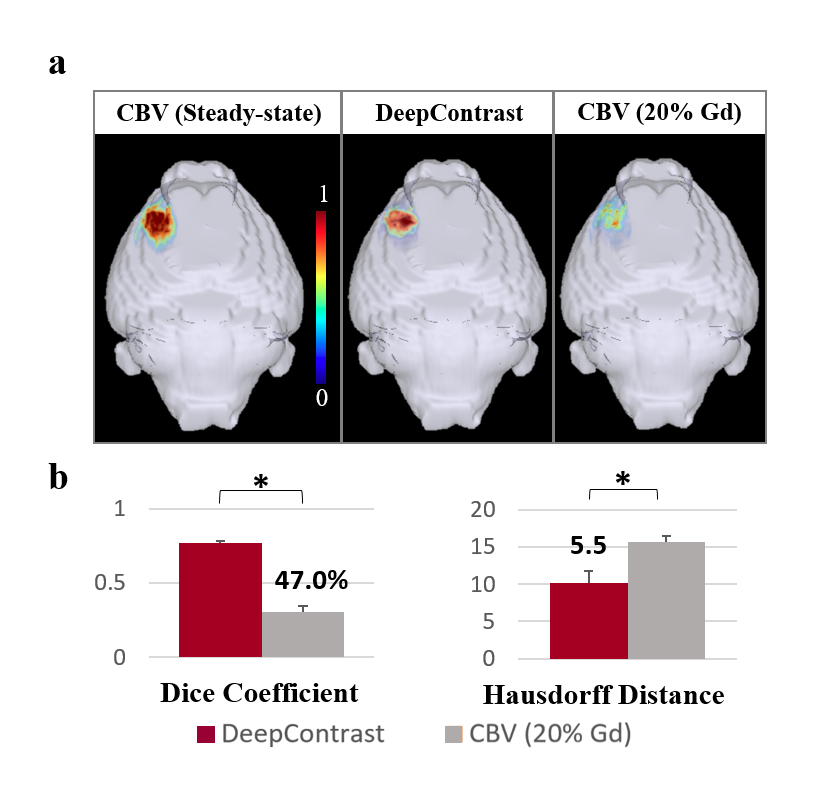
Figure 4. shows that the DeepContrast predicted results perform significantly better than the 20% Gd CBV in both visual assessment and quantitative evaluations. Compared with 20% Gd CBV, DeepContrast generated from the T2W Pre scan shows similar contrast level to the ground truth. The consistency can be observed in the fine structure and significant contrast enhancement in both normal tissue and the tumor region. Figure 5.a shows the 3D rendering results of CBV ground truth vs. DeepContrast in the FCM segmented tumor region of a single tumor subject. Figure 5.b shows the quantitative comparisons between the DeepContrast predictions and the 20% Gd CBV of the tumor region. Figure 5 further confirms that the DeepContrast models with the input of Pre only image significantly outperformed the 20% Gd for the tumor region.
DISCUSSION AND CONCLUSIONS
DeepContrast was developed to solely rely on information extracted from the commonly acquired structural MRI. Our current approach provides several improvements compared to the previous studies to predicting contrast enhancement.7,8 First, we demonstrate that Gd contrast can be directly derived from a single noncontrast T2W MRI in both normal brain and brain with lesions. Furthermore, our deep learning method is based on a hybrid deep residual attention-aware network and is the first network to use an attention residual mechanism to process brain MRI scans. Finally, our method is capable of producing CBV mapping of small vessels with high fidelity.Findings of Gd retention necessitate efforts to develop novel approaches to MRI that can decrease or even eliminate Gd exposure. Our proposed method currently can be used to generate Gd contrast in brain MRI directly from T2W MRI scans with complete omission of GBCAs. DeepContrast is a promising technique with the potential to offer benefits to patient care and the healthcare system through the reduction of Gd exposure, scan time, and cost. Of note, our work should be regarded as a proof-of-concept study in animal models; future human studies will be required to validate its clinical utility.
Acknowledgements
This study was funded by the Seed Grant Program and Technical Development Grant Program and Matheson Foundation (UR010590). This study was performed at the Zuckerman Mind Brain Behavior Institute MRI Platform, a shared resource.References
1. S. A. Small, S. A. Schobel, R. B. Buxton, M. P. Witter, and C. A. Barnes. A pathophysiological framework of hippocampal dysfunction in ageing and disease. Nat Rev Neurosci, vol. 12, no. 10, pp. 585-601, 2011, doi: 10.1038/nrn3085.
2. U. A. Khan et al. Molecular drivers and cortical spread of lateral entorhinal cortex dysfunction in preclinical Alzheimer's disease. Nat Neurosci, vol. 17, no. 2, pp. 304-311, 2014, doi: 10.1038/nn.3606.
3. S. A. Schobel et al. Imaging patients with psychosis and a mouse model establishes a spreading pattern of hippocampal dysfunction and implicates glutamate as a driver. Neuron, vol. 78, no. 1, pp. 81-93, 2013, doi: 10.1016/j.neuron.2013.02.011.
4. A. M. Brickman et al. Enhancing dentate gyrus function with dietary flavanols improves cognition in older adults. Nat Neurosci, vol. 17, no. 12, pp. 1798-1803, 2014, doi: 10.1038/nn.3850.
5. T. E. Smith, A. Steven, and B. A. Bagert. Gadolinium Deposition in Neurology Clinical Practice. Ochsner J, vol. 19, no. 1, pp. 17-25, Spring 2019, doi: 10.31486/toj.18.0111.
6. FDA. FDA Drug Safety Communication: FDA warns that gadolinium-based contrast agents (GBCAs) are retained in the body; requires new class warnings.
7. E. Gong, J. M. Pauly, M. Wintermark, and G. Zaharchuk, Deep learning enables reduced gadolinium dose for contrast-enhanced brain MRI. Journal of Magnetic Resonance Imaging, vol. 48, no. 2, pp. 330-340, 2018/08/01 2018, doi: 10.1002/jmri.25970.
8. J. Kleesiek et al. Can Virtual Contrast Enhancement in Brain MRI Replace Gadolinium?: A Feasibility Study. Investigative Radiology, vol. 54, no. 10, pp. 653-660, 2019, doi: 10.1097/rli.0000000000000583.
9. L. Lei et al. Glioblastoma models reveal the connection between adult glial progenitors and the proneural phenotype. PLoS One, vol. 6, no. 5, pp. e20041-e20041, 2011, doi: 10.1371/journal.pone.0020041.
Figures