1026
Assessing the effect of registration and model quality using attention gates for brain-age prediction with convolutional neural networks.1WIN, University of Oxford, Oxford, United Kingdom, 2IBME, University of Oxford, Oxford, United Kingdom
Synopsis
Nonlinear registration forms a part of standard MRI neuroimaging pipelines but leads to suppression of morphological information. Using attention gates within a convolutional neural network, we explore the effect of the nonlinear registration on age prediction, comparing to linear registration. We show that the network is driven by interpolation effects near the ventricles when trained with nonlinear data, whereas when trained with linear data it considers the whole brain volume. The network may, therefore, be missing cortical changes, limiting the utility of the networks in detecting the early stages of neurological disease.
Introduction
Many pipelines for processing MRI neuroimaging datasets, including the UK Biobank pipeline1, incorporate a nonlinear registration step. Whilst this step is necessary for many automated tools, nonlinear registration to the MNI template visually suppresses morphological information, such as ventricular atrophy. Here the effect of this is considered when training neural networks for tasks where we know morphological changes are strong biomarkers; the results are compared to those achieved using linear registration, of the same data, to the MNI template. Here we focus on age prediction from structural MRI: as a better understanding of the healthy ageing process can help us to discriminate normal age-related changes from neurodegenerative diseases2, it is important to understand what drives these models.Methods
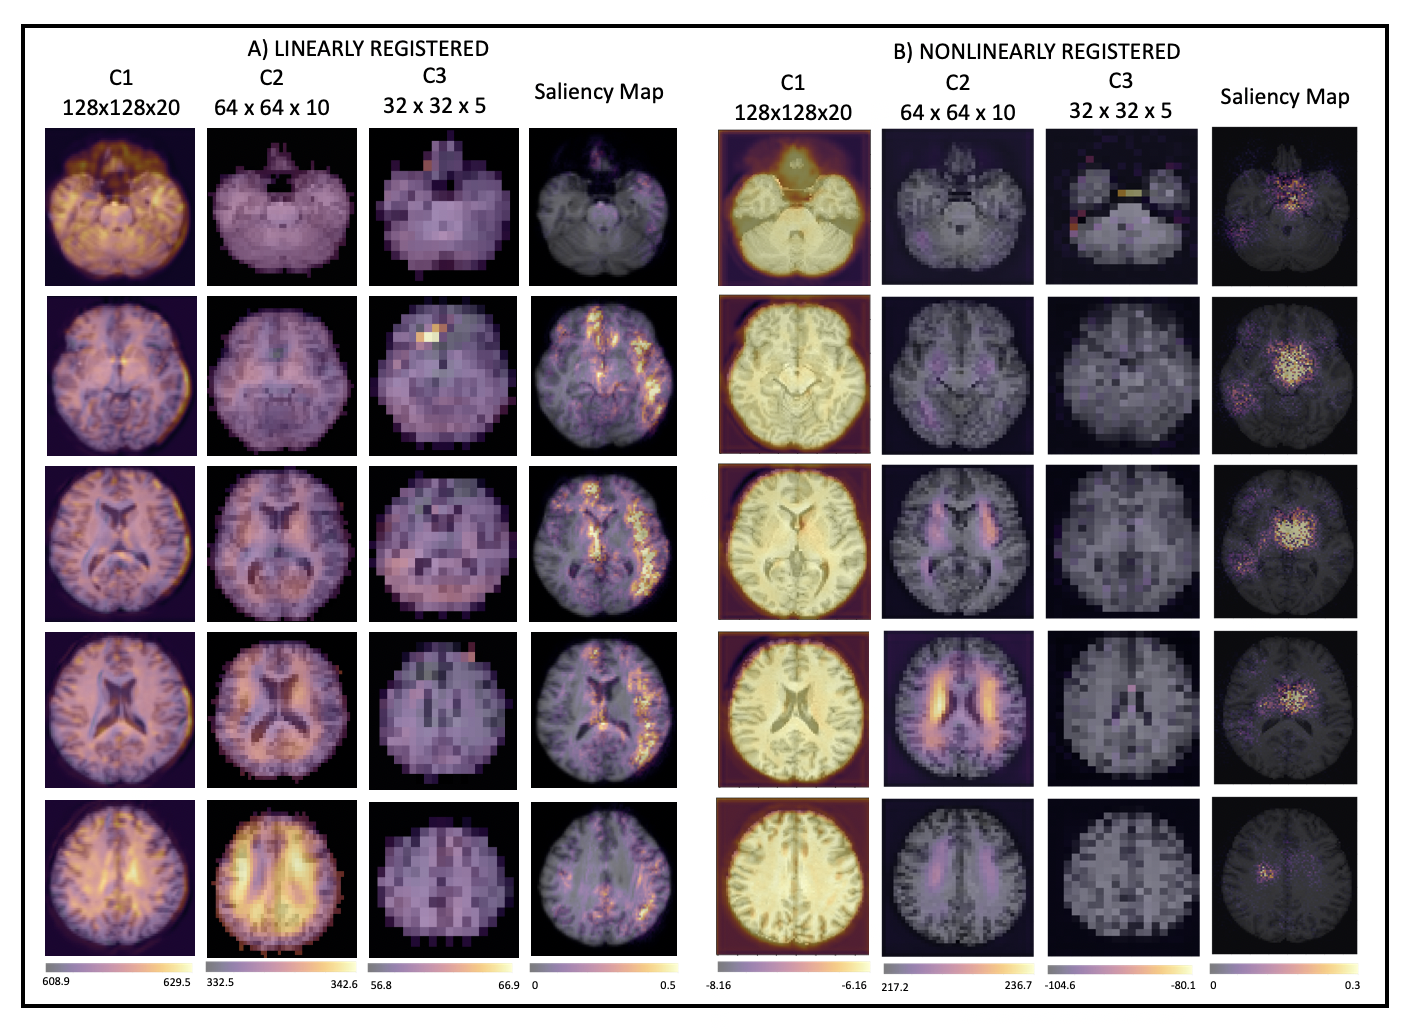
The network shown in Figure 1a - a 3D CNN ensemble of three identical networks based on the VGG-16 architecture3 with independently trained weights – was trained for age prediction using T1-weighted brain images. The network was trained using a mean squared error loss function and consisted of 12 convolutional layers, all with a kernel size of 3x3x3, followed by three fully connected layers, the last of which has a single feature to enable the network to regress age. It is vital that this network performs well at age prediction to enable analysis of what is driving these predictions. The network was trained using a total of 12,802 T1-weighted MRI images and a further testing set of 6885 images from the UK Biobank database4, acquired using a 3D MPRAGE sequence and processed using the UK Biobank Pipeline1. Both the linearly registered and nonlinearly registered versions of the images were used to train the network separately. The input image dimensions were 128 x 128 x 20, where the 20 slices were equally spaced and chosen to include as much as the brain as possible while reducing redundancy and memory requirements.Residual attention gates5 were then added to the network (Figure 1b) at three resolutions. Attention gates enhance regions of the image which are useful for the task and suppress the other regions. The features passed to the attention gates are post batch normalization but before the max pooling layer, so that the features are the deepest features at that resolution. The three feature vectors produced are concatenated to create a single feature vector that is finally connected via a single linear layer to produce the regressor.
The results of the attention gates are also compared to saliency maps6. These indicate how the input image should be changed to increase the activations and so make the prediction closer to the true label and therefore show the regions of the image which are key to the prediction. They are, however, performed post-hoc on the trained network and therefore show different information to the attention gates which are trained directly7.
Results
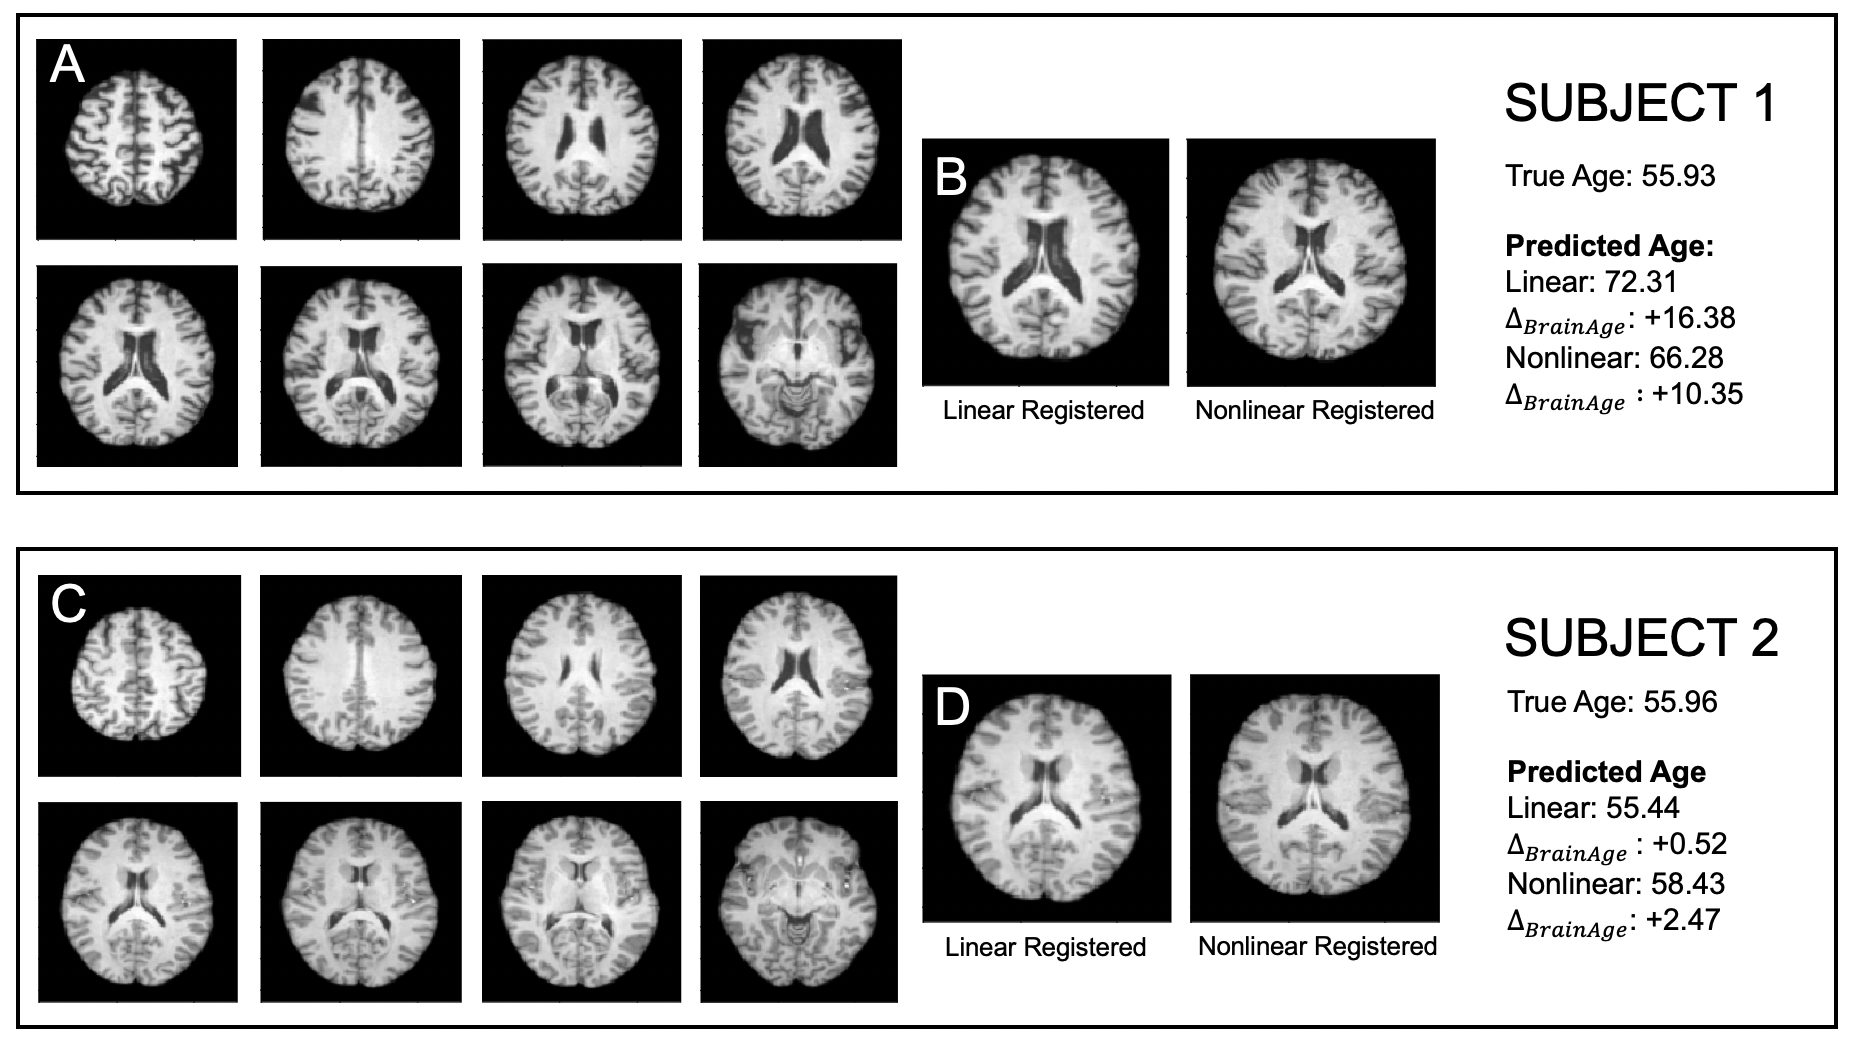
The results of the age prediction can be seen in Figure 2. There was no significant difference between the results for the two registration types and these results are competitive with the MAE range of 3-5 years in the literature8-12 and the winning result in PAC201913, despite not all of the subjects in the UK Biobank being healthy.The effect of the registration type can be seen in Figure 3. Subjects one and two are both the same true age; however, their MRI scans show very different levels of atrophy and lead to different predictions. The different predictions produced by the two networks clearly shows that they are capturing different information.
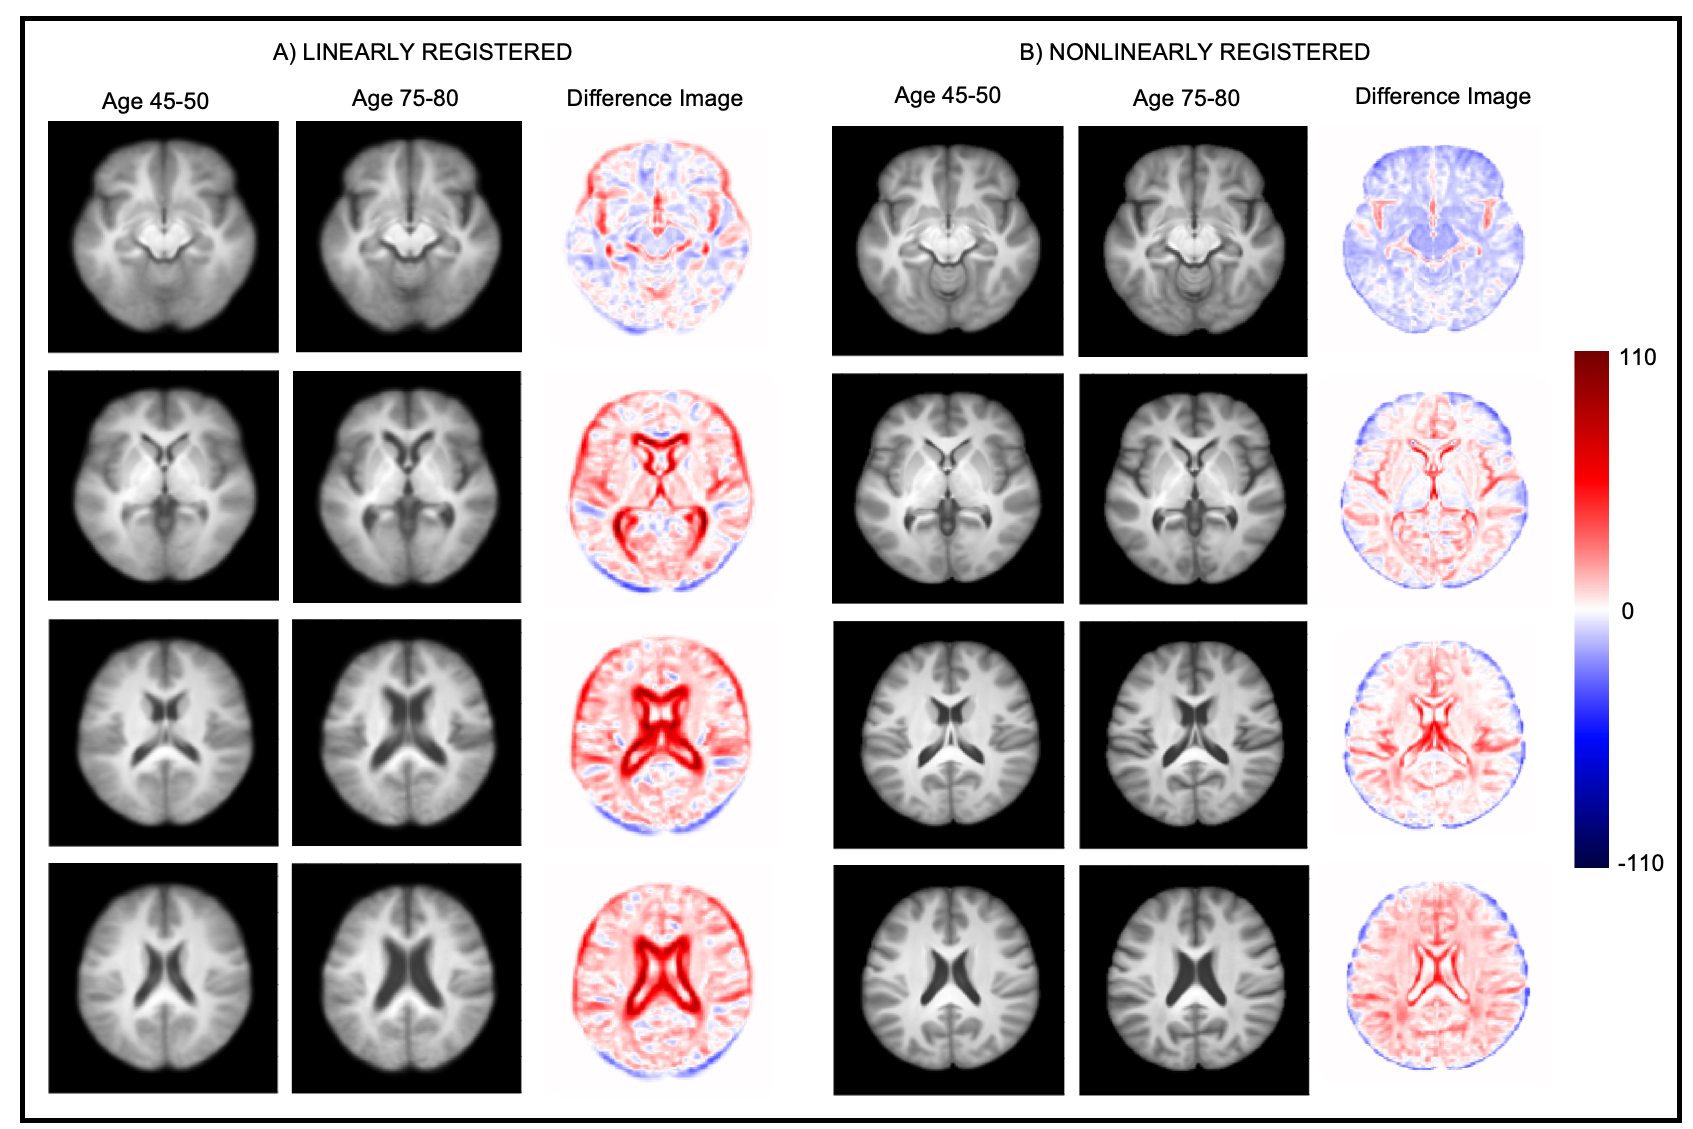
To roughly examine which brain features the network predicts to be older, all subjects predicted to be between 75-80 by the CNN were averaged to form a composite image; similarly for those predicted to be between 45-50 (Figure 4). It can be seen that the differences are very subtle for the nonlinearly registered images and very obvious in the linearly registered images.
Figure 5 shows the results from the attention gates for both types of registration and the saliency maps. For the nonlinear registration, the network is driven by the regions where the brain tissue has been stretched and the CSF squashed in the ventricles to match the template (C2). For the linearly registered data, however, the network looks all over the brain volume and so considers more information. The saliency maps agree with the attention maps, with the network concentrating on the ventricles for the nonlinear registration and considering a far greater proportion of the brain volume for the linear registration.
Conclusion
The results show that the network trained on the nonlinearly registered data performs well on the age prediction task but focuses its attention on a small amount of the brain volume, whereas, with the linearly registered data, the network considers a much larger proportion of the brain volume. Therefore, the nonlinear version might be concentrating on finding interpolation effects near the ventricles. However, the cortical changes may be missed by this nonlinear version, limiting the utility of the networks in detecting the early stages of neurological disease, as the early stages of several disease states resemble advanced ageing14, highlighting the need to explore and understand what features are driving decisions made by neural networks.Acknowledgements
This work was supported by the Engineering and Physical Sciences Research Council (EPSRC) and Medical Research Council (MRC) [grant number EP/L016052/1] (N.D, E.B). E.B is grateful for support from the Clarendon fund (E.B). A.N. is grateful for support from the UK Royal Academy of Engineering under the Engineering for Development Research Fellowships scheme. M.J. is supported by the National Institute for Health Research (NIHR) and the Oxford Biomedical Research Centre (BRC). The Wellcome Centre for Integrative Neuroimaging is supported by core funding from the Wellcome Trust (203139/Z/16/Z). Computation used the Oxford Biomedical Research Computing (BMRC) facility, a joint development between the Wellcome Centre for Human Genetics and the Big Data Institute supported by Health Data Research UK and the NIHR Oxford Biomedical Research Centre. The views expressed are those of the author(s) and not necessarily those of the NHS, the NIHR or the Department of Health.References
1. F. Alfaro-Almagro, M. Jenkinson et al. Image processing and quality control for the first 10,000 brain imaging datasets from UK Biobank. Neuroimage (2018) 166:400-424
2. N. T. Doan, A. Engvig et al. Distinguishing early and late brain aging from the Alzheimer’s disease spectrum: consistent morphological patterns across independent samples. Neuroimage (2017) 158:292-295
3. K. Simonyan, A. Zisserman. Very deep convolutional networks for large scale image recognition. ICLR (2015)
4. C. Sudlow, J. Gallacher et al. UK Biobank: An open access resources for identifying the causes of a wide range of complex diseases of middle and old age. PLoS Med. (2015) 12(3)
5. F. Wang, M. Jiang et al. Residual attention network for image classification. CVPR (2017) 6450-6458
6. K. Simonyan, A. Vedaldi et al. Deep inside
convolutional networks: Visualising image classification models and saliency
maps. ICLR (2013)
7. S. Jetley, N. Lord et al. Learn to pay attention. ICLR (2018)
8. D.P. Varikuti, S. Genon et al. Evaluation of non-negative matric factorization of grey matter in age prediction. Neuroimage (2018) 173:394-410
9. K. Franke, G. Ziegler et al. Estimating the age of healthy subjects from T1-weighted MRI scans using kernel methods: exploring the influence of various parameters. Neuroimage (2010) 883-892
10. L. Su, L. Wang et al. Age related classification and prediction based on MRI: A sparse representation method. Procedia Environmental Sciences (2011) 8:645-652
11. J. Cole, R. Poudel et al. Predicting age with deep learning from raw imaging data results in a reliable and heritable biomarker. Neuroimage (2017) 163
12. S. A. Valizadeh, J. Hanggi et al. Age prediction on the basis of brain anatomical measures. Human Brain Mapping (2017) 38
13. Predictive Analytics Competition 2019 - https://www.photon-ai.com/pac2019. Accessed 02/11/2019
14. N. Raz, P. Ghisletta et al. Trajectories
of brain aging in middle-aged and older adults: Regional and individual
differences. Neuroimage (2010) 51(2) 501-511.
Figures

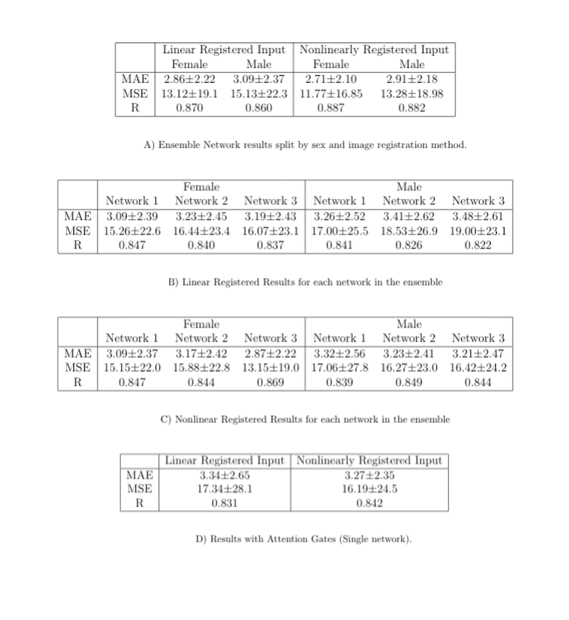
Results of the age prediction task for each gender and registration type respectively. MAE = mean absolute error. MSE = mean squared error. R = correlation coefficient.
There was no significant difference between the results achieved for the linearly registered data and the nonlinearly registered data (p values from paired t-test between the results from the linearly registered images and nonlinearly registered images: female p = 0.710 n=3654, male p = 0.810 n=3231).