1022
Learning white matter fingerprints from structural information1Computer Science, Vanderbilt University, Nashville, TN, United States, 2Sherbrooke Connectivity Imaging Laboratory (SCIL), Universite de Sherbrooke, Sherbrooke, QC, Canada, 3Intelligent Systems Engineering, Indiana University Bloomington, Bloomington, IN, United States, 4Laboratory of Behavioral Neuroscience, National Institute on Aging, Baltimore, MD, United States, 5Vanderbilt University Institute of Imaging Science, Nashville, TN, United States, 6Biomedical Engineering, Vanderbilt University, Nashville, TN, United States, 7Radiology and Radiological Sciences, Vanderbilt University Medical Center, Nashville, TN, United States, 8Electrical Engineering, Vanderbilt University, Nashville, TN, United States
Synopsis
Here, we present a tool and reconstruction method to label white matter pathways directly on structural images without the need for diffusion MRI or tractography. A 3D U-net was trained utilizing 1109 scan sessions where fiber pathways were segmented using two different segmentation schemes. Results on testing datasets show anatomically viable segmentations and moderate-to-high volume overlaps with gold-standard pathways, on par with scan-rescan reproducibility of tractography on the same datasets. We envision the use of this tool for visualizing the expected course of white matter pathways when diffusion data are not available.
Introduction
Diffusion MRI fiber tractography is the state-of-the-art method to delineate and segment white matter (WM) pathways of the in vivo human brain. If no diffusion MRI is acquired, atlas-based labeling can be used, however, these often treat WM as essentially homogenous or utilize regional parcellations (for example anterior/posterior internal capsule) rather than specific white matter pathways (that may overlap). Towards this end, we train a deep learning network to predict the full spatial extent of white matter pathways based only on a structural T1-weighted image. We trained the network to learn from tractography data utilizing two different sets of “definitions”, or ways to extract pathways. Thus, the tool can be used to provide multiple parcellation schemes. We describe the data and network training, show network-predicted WM pathways, and quantify similarity to gold-standard pathways from diffusion data.Methods
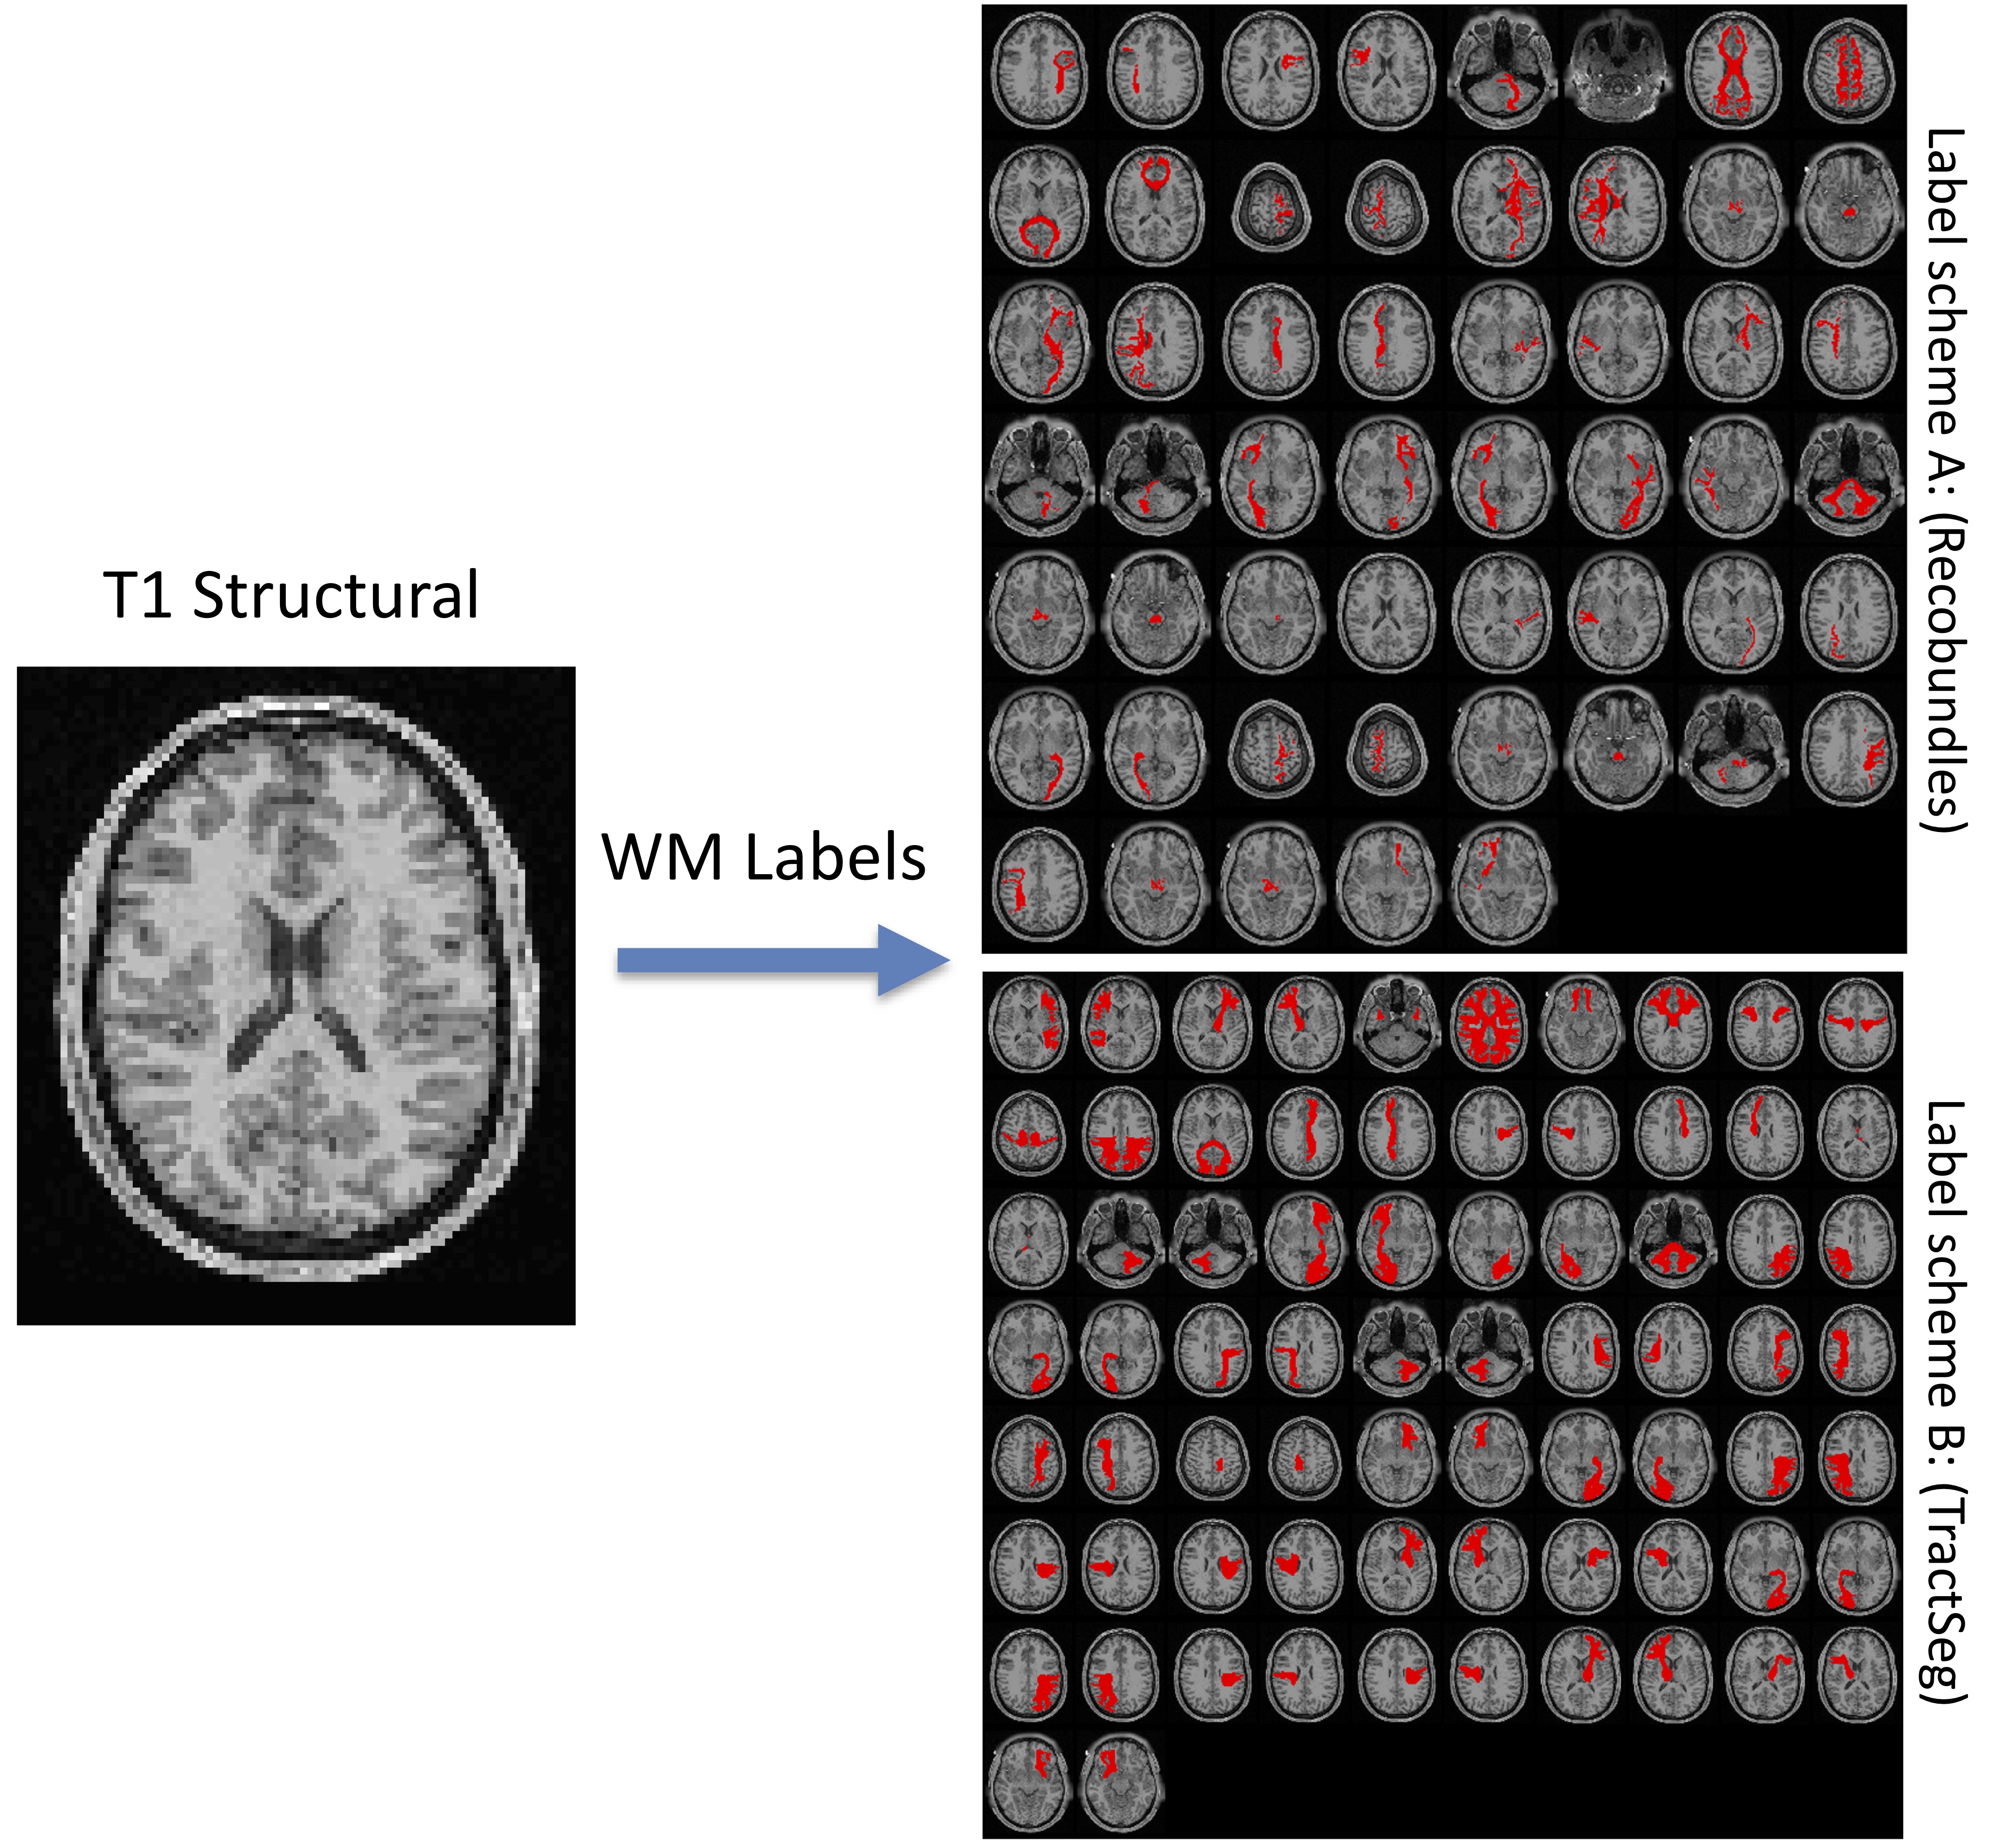
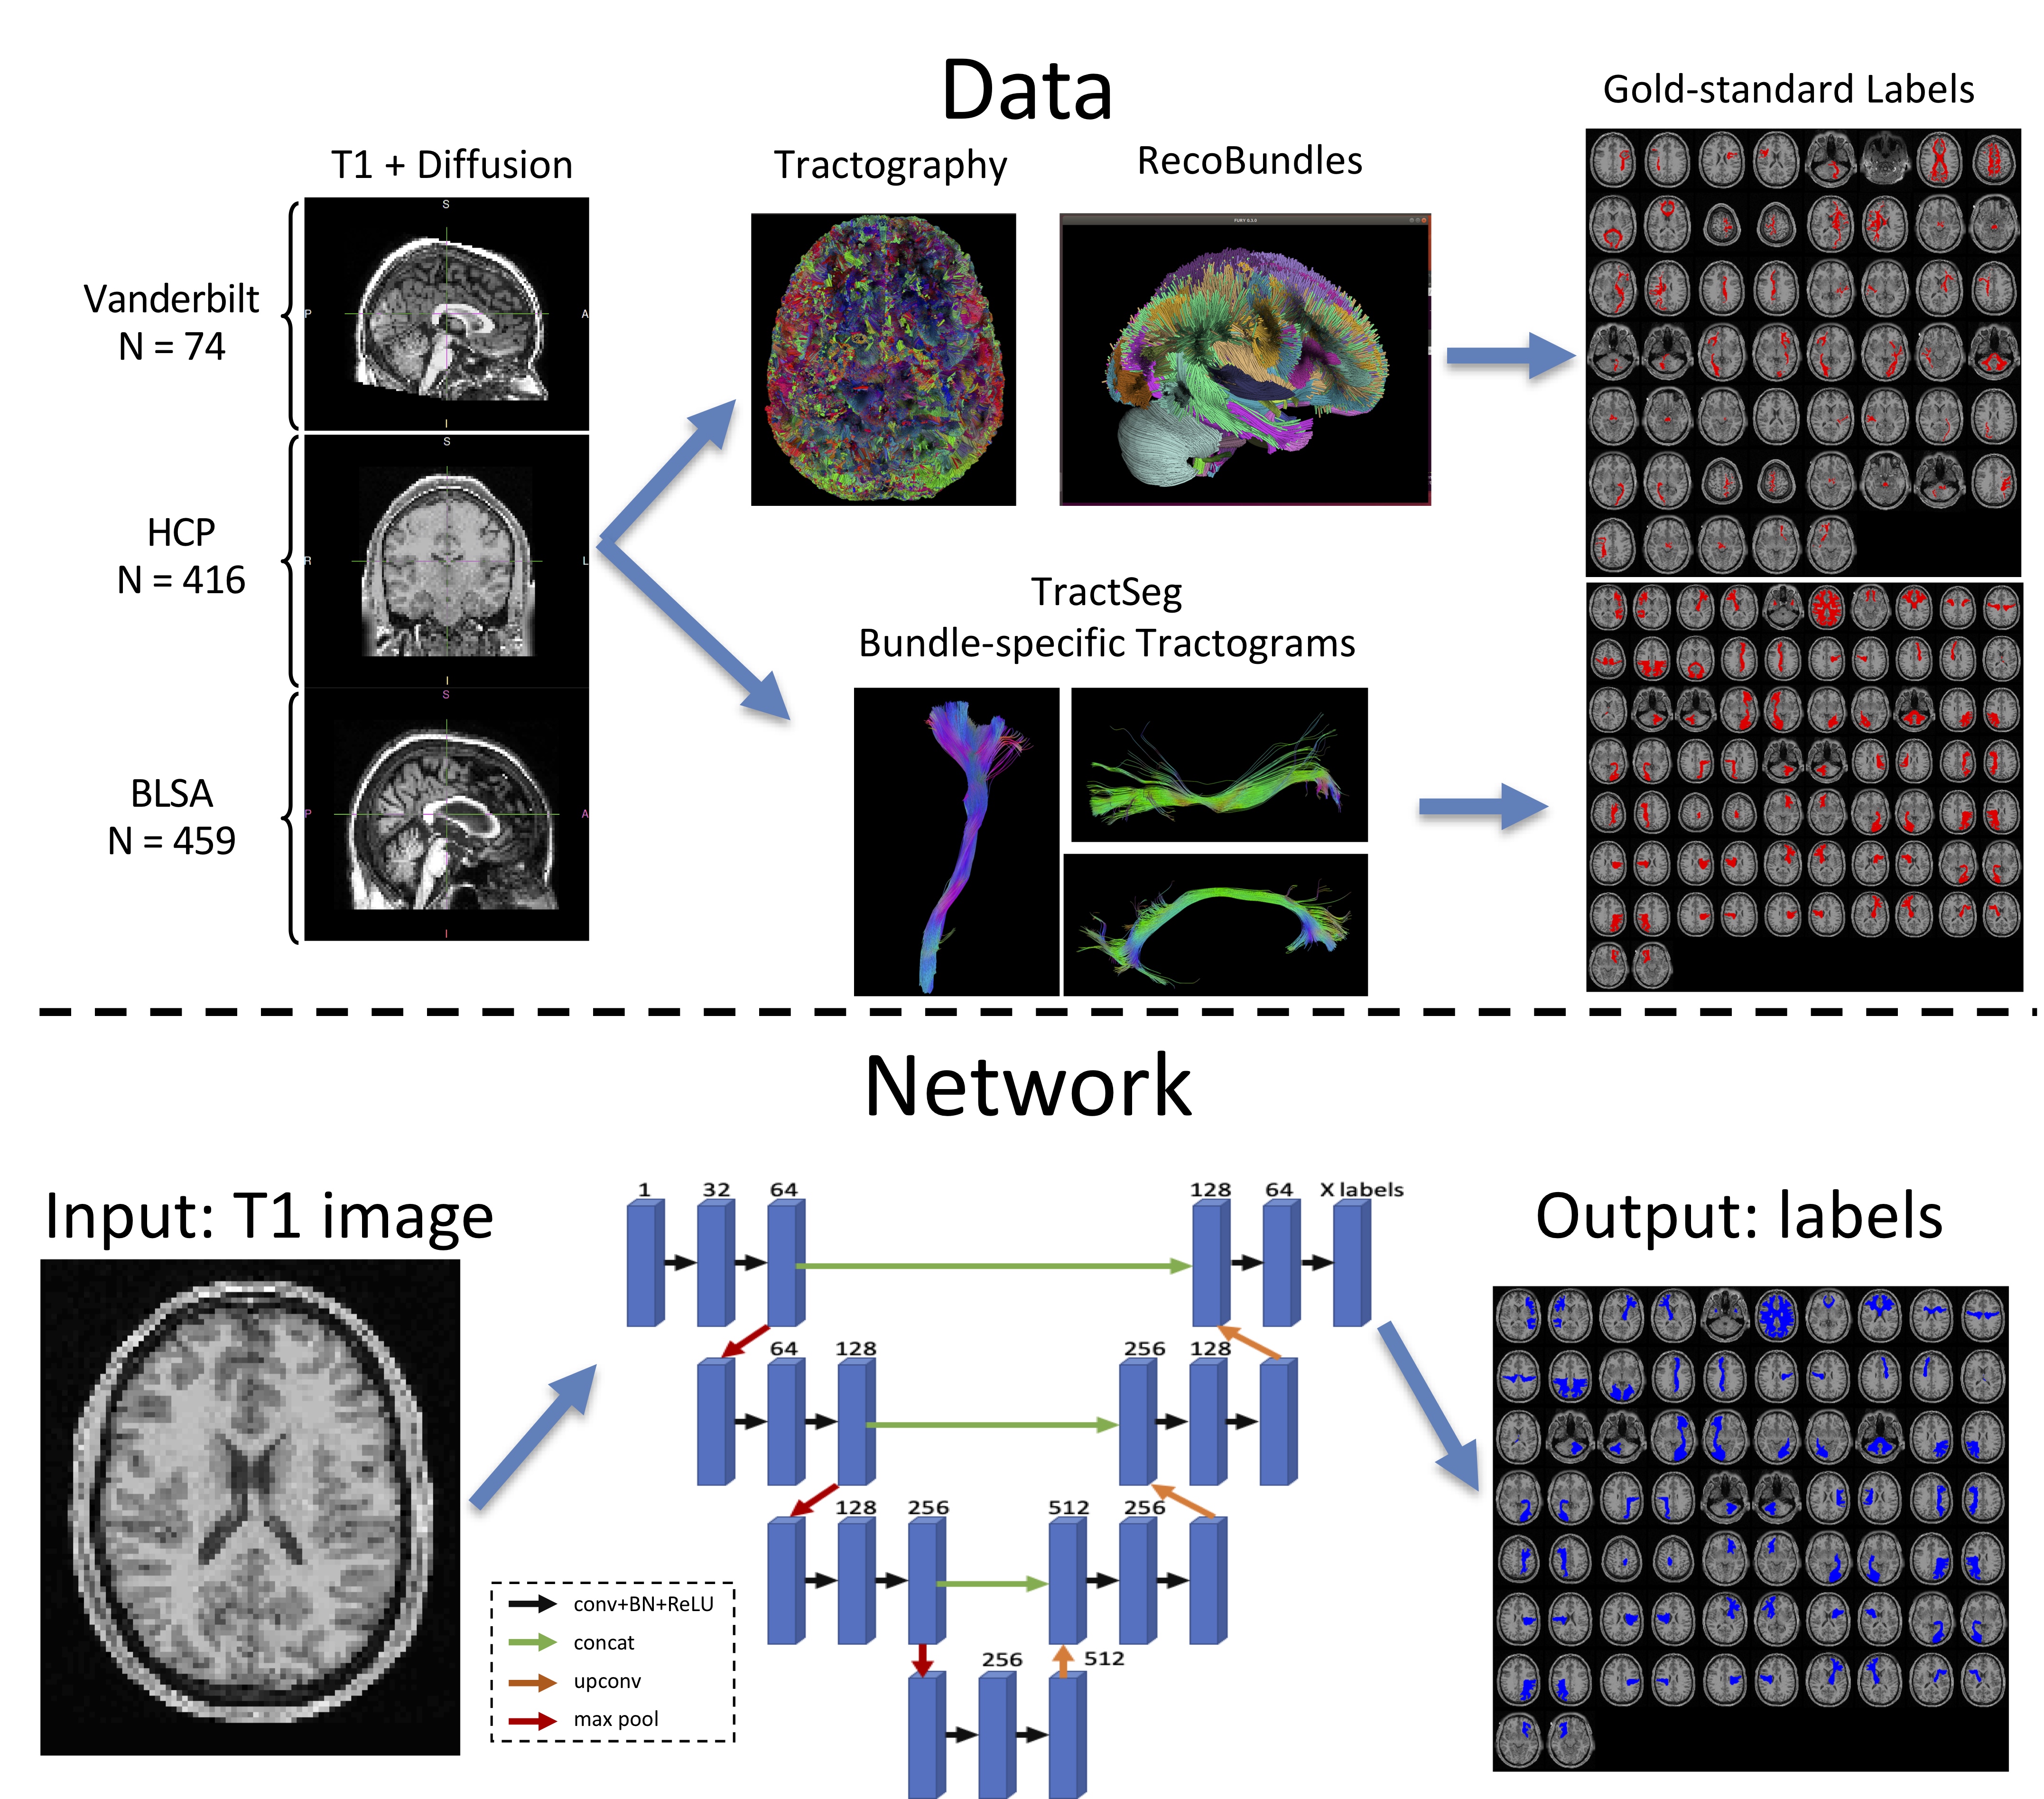
The aim of this study (Figure 1) is to predict WM labels directly from a T1-weighted structural image. We implement two labelling, or pathway dissection, schemes: Recobundles1 and TractSeg2. Alternative reconstruction strategies are possible with similar network architecture3,4.Data
With the aim to increase generalizability, the network is trained from a variety of databases, with varying acquisition techniques, data quality, and a diverse sample with broad age range- with data from the Human Connectome Project, Baltimore Longitudinal Study of Aging, and at Vanderbilt University. The gold-standard labels were derived from diffusion tractography on 1109 brain scans (798 total subjects, of which many had between 1 and 5 sessions on the scanner). We note that TractSeg results in 72 defined WM pathways, while the atlas used for Recobundles includes 79 of which 26 were not included in training (due to small sizes, failure to clustering during processing - for example cranial nerves, cerebellar tracts, etc.), resulting in 53 total bundles.
Network
All brain volumes (both T1 and binarized pathway labels) were mapped to MNI 305 standard space, and a 3D U-net was trained on down-sampled data at 2.5mm isotropic (due to GPU memory restrictions), with a separate network trained for each parcellation scheme (compatible with 53 and 72 label outputs, respectively). Data was stratified by subject into training (N=949), validation (N=53), and testing (N=107).
Results
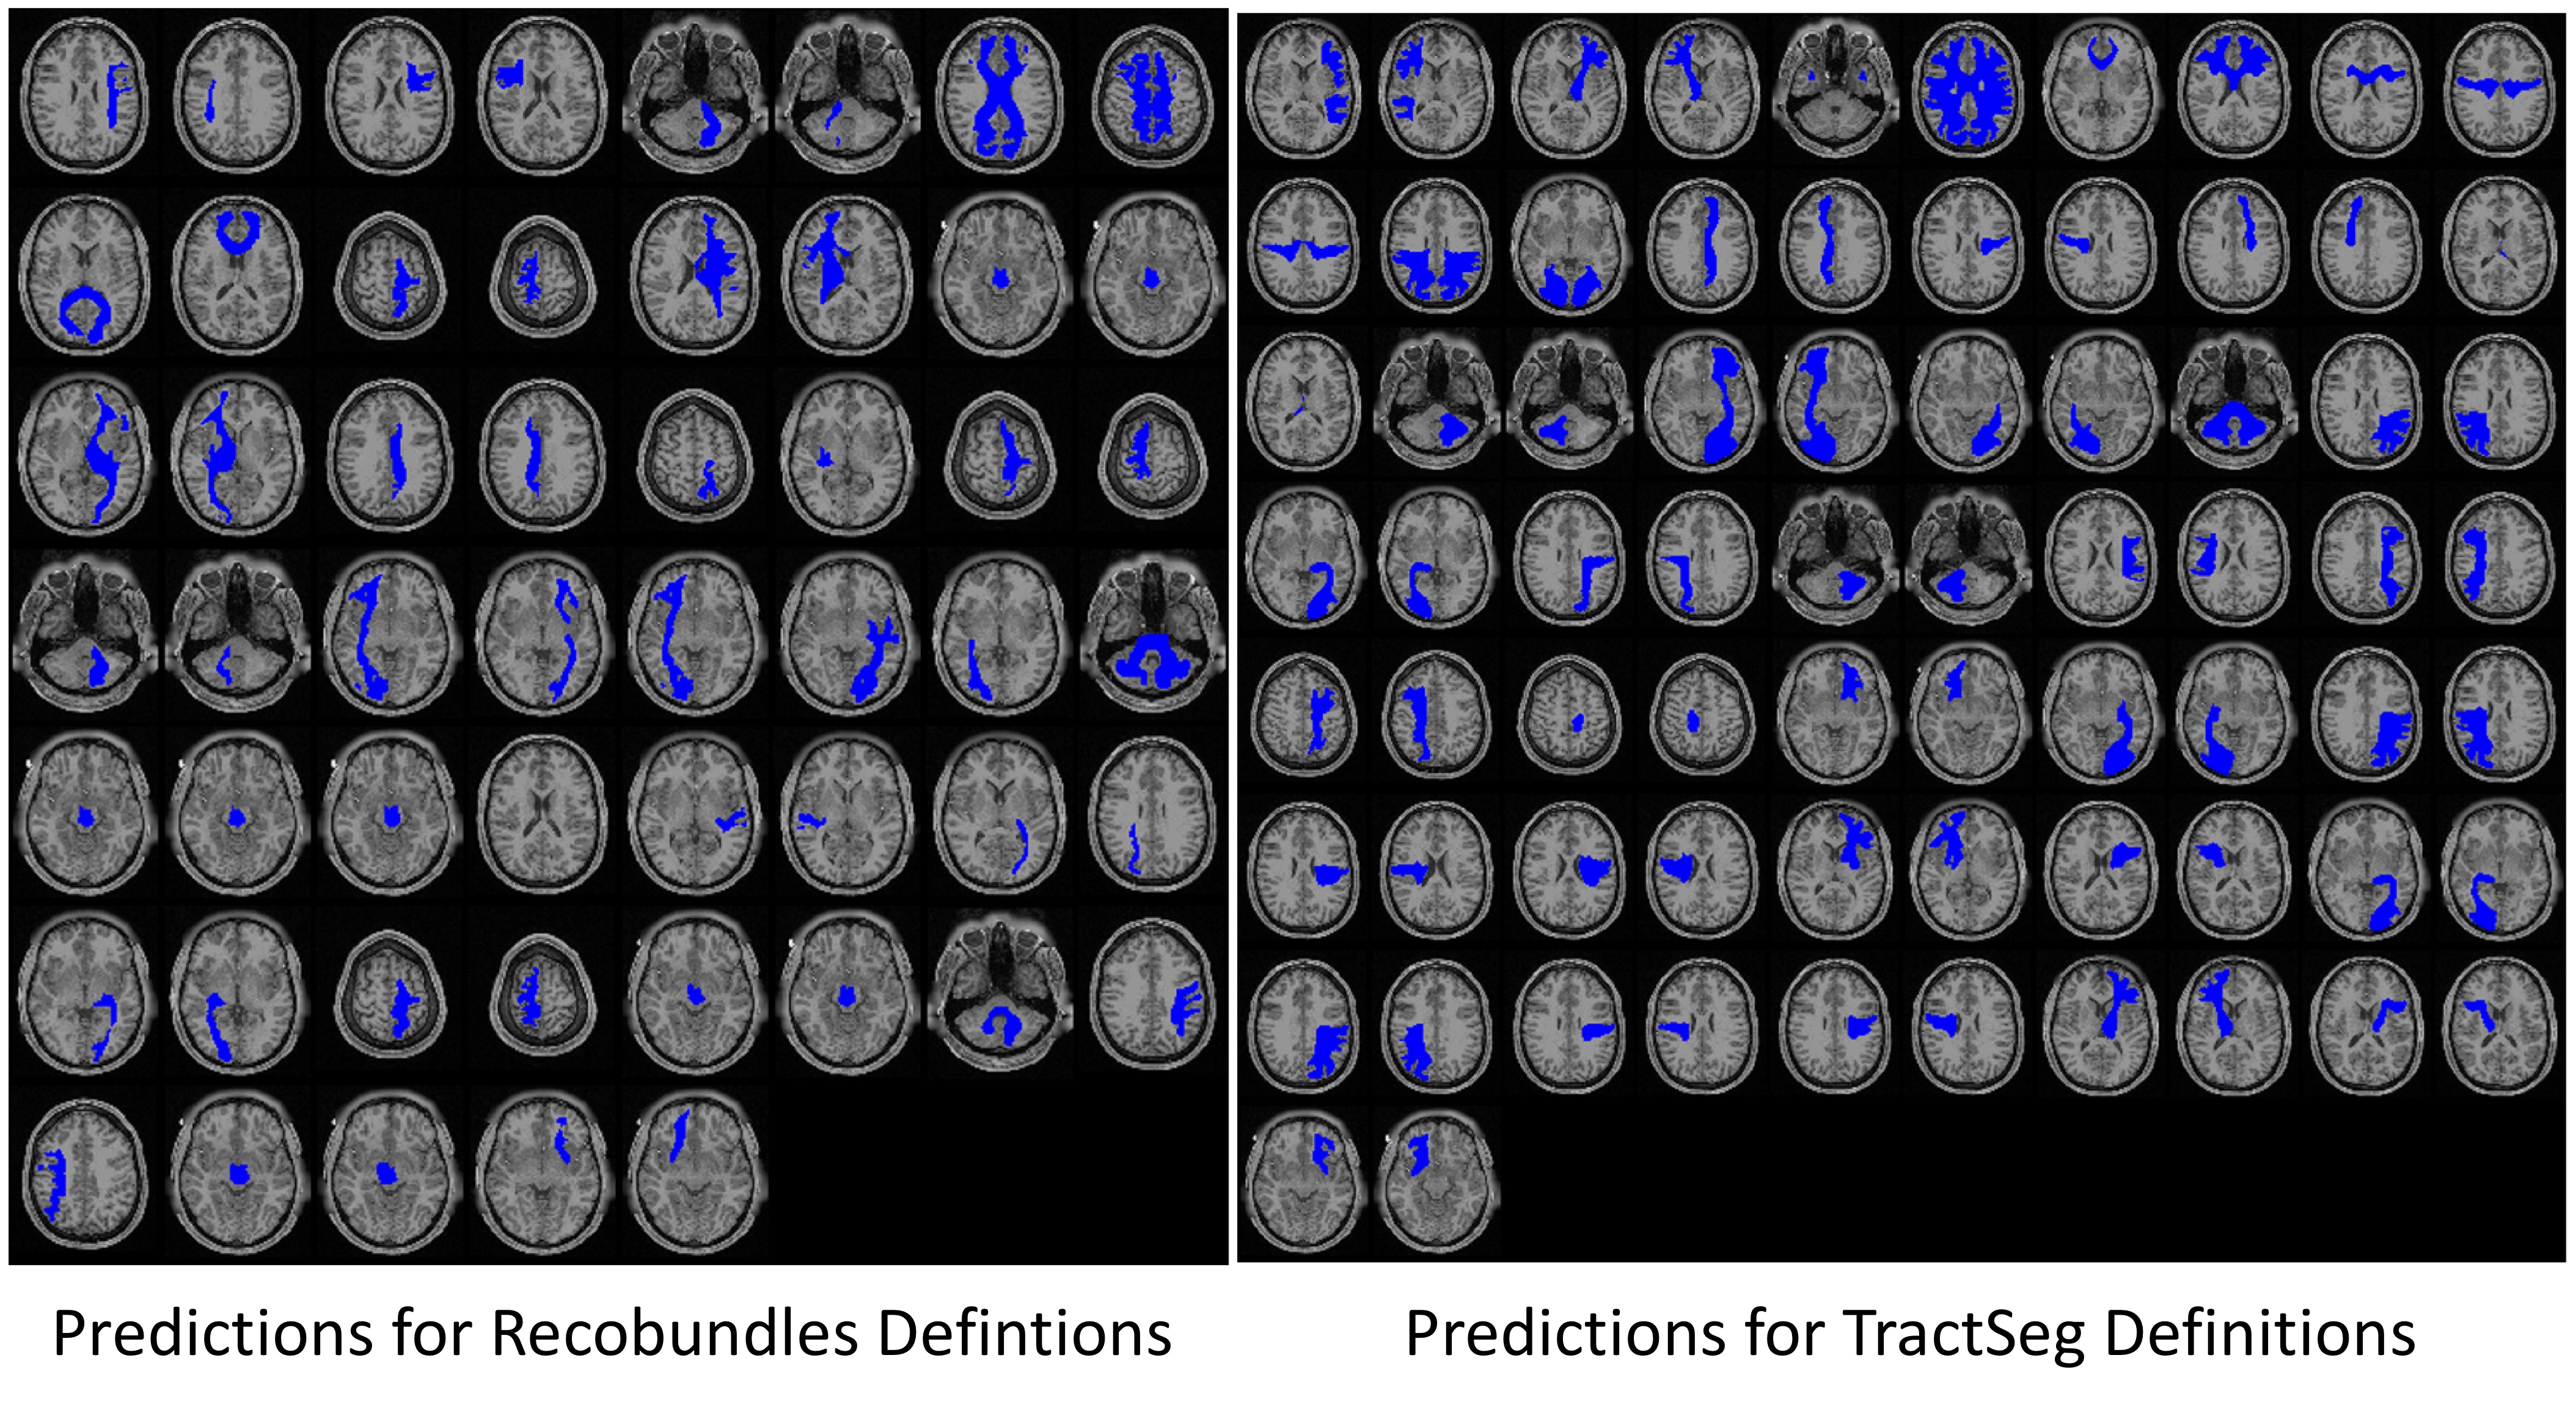
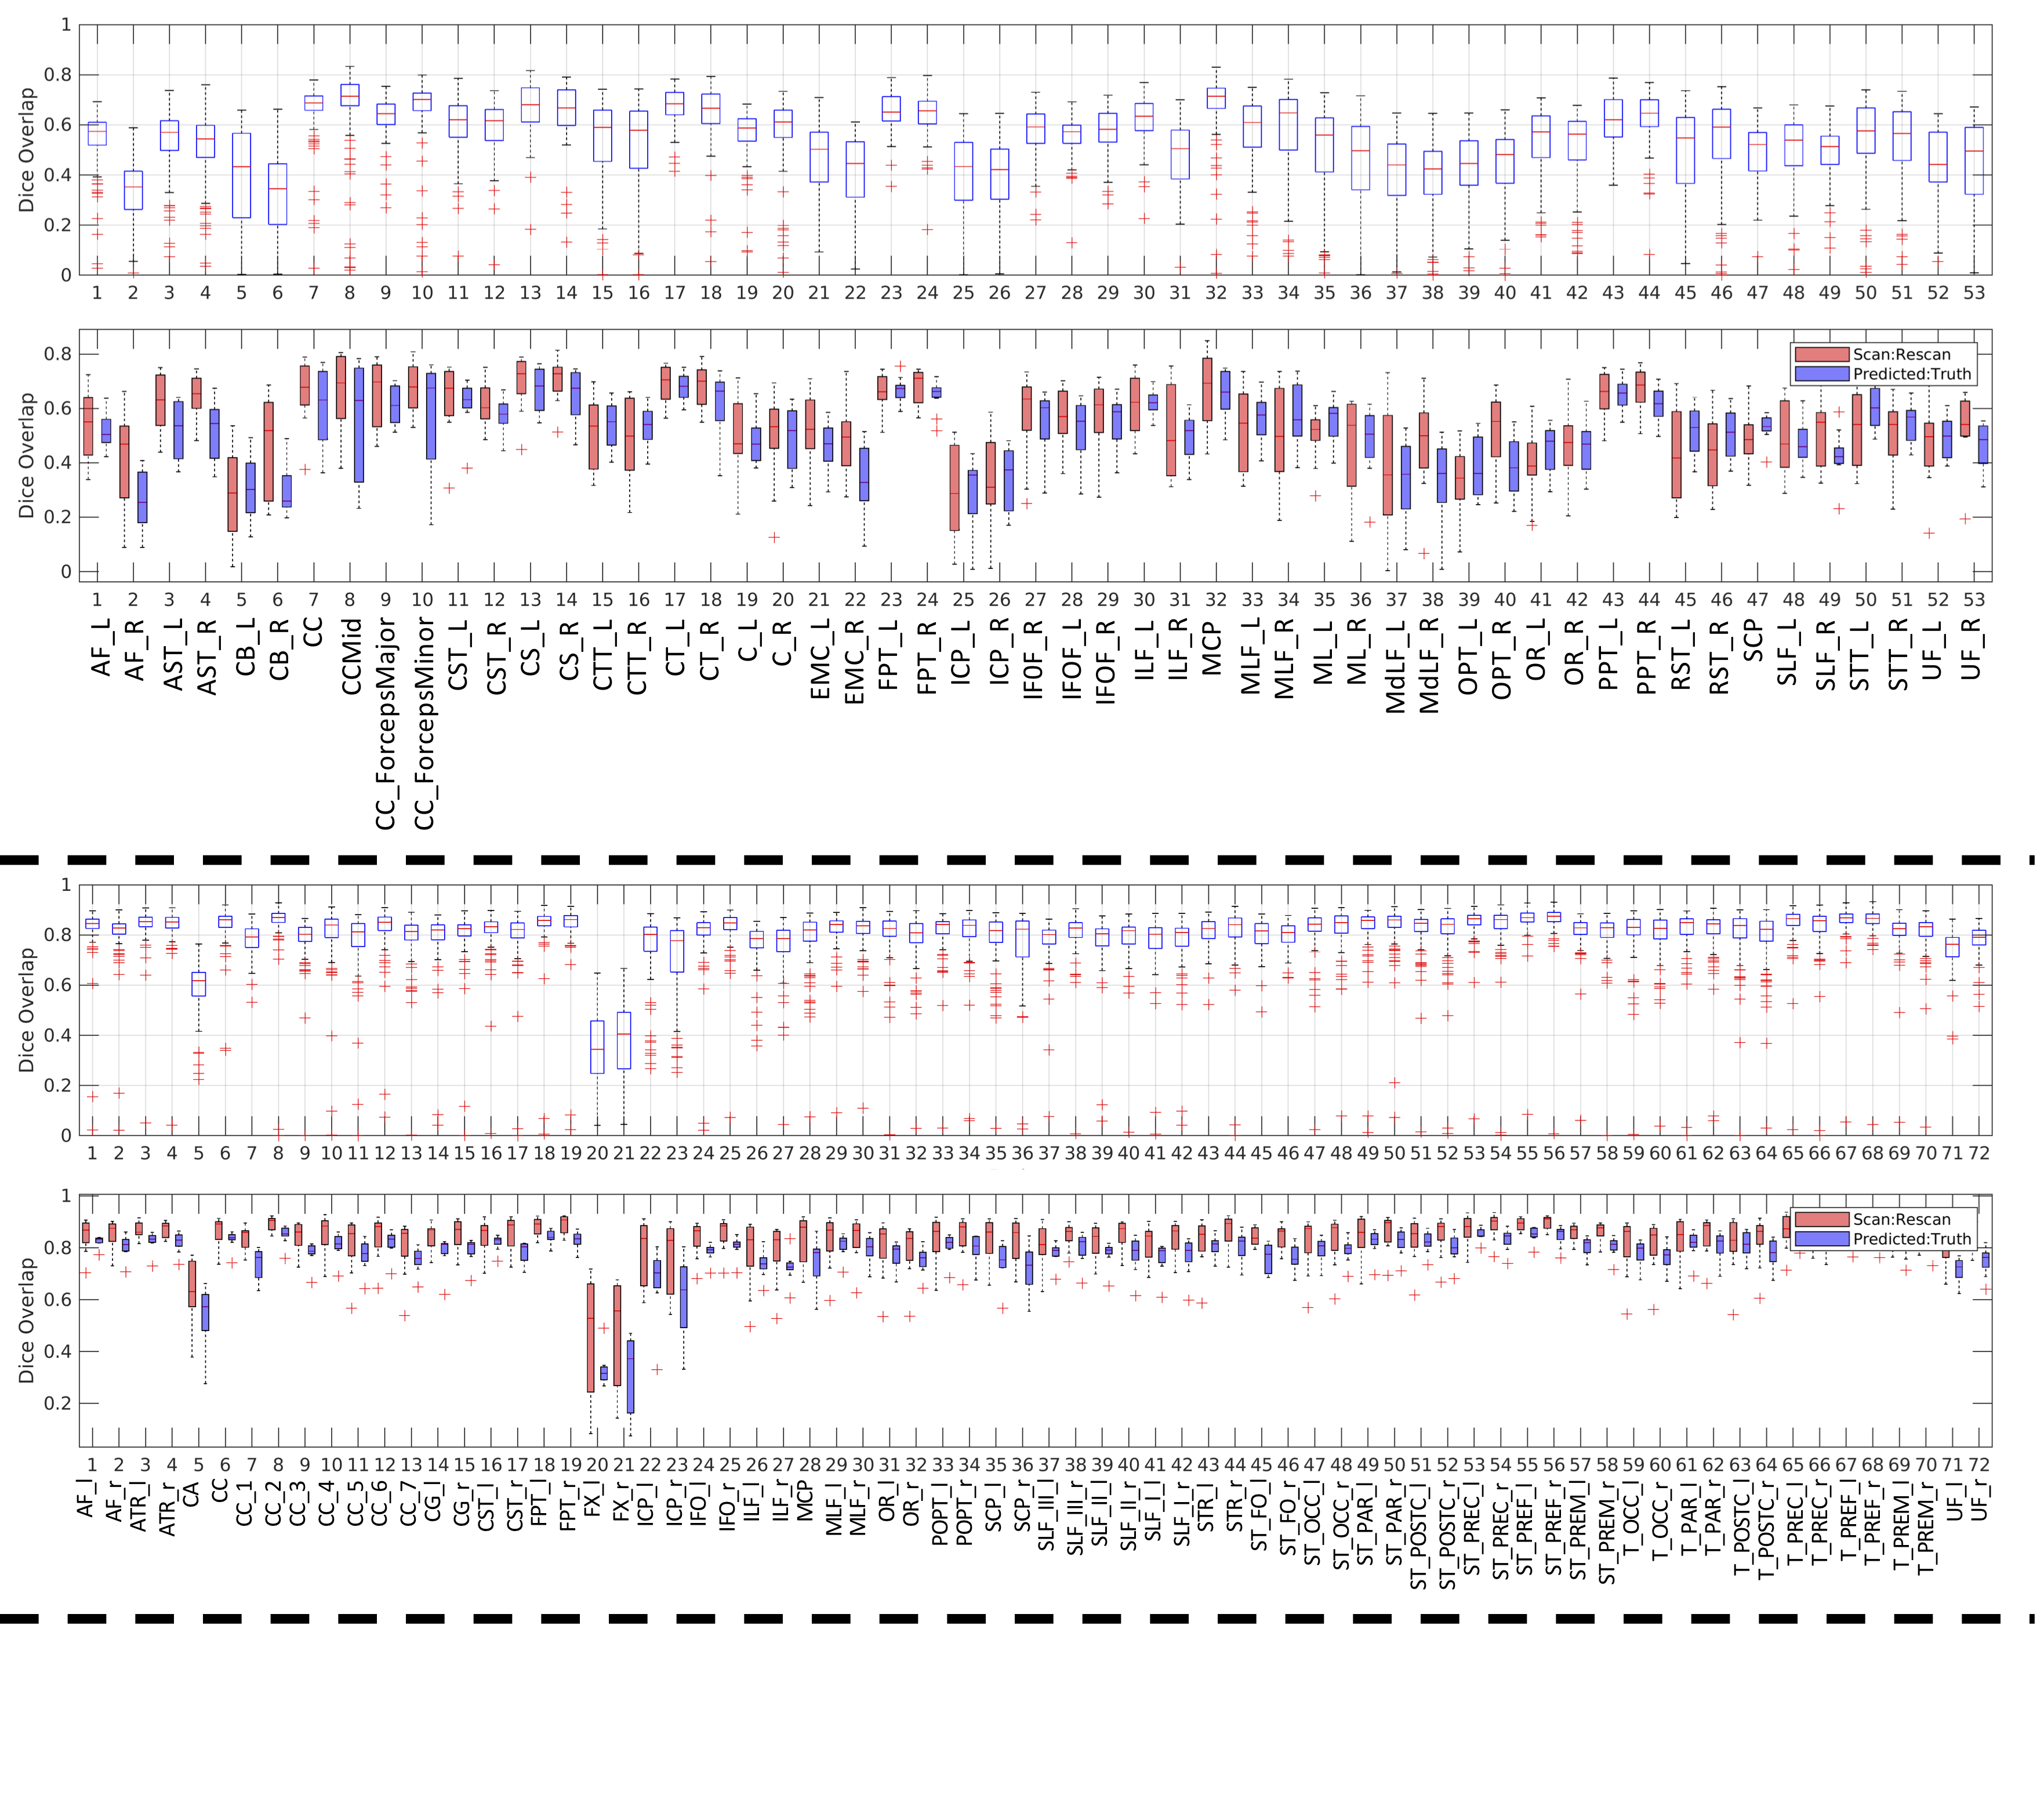
Example pathway predictions for a single subject (same subject from Figure 1) are shown in Figure 3 for both labelling schemes. In both cases, pathways qualitatively look to be in the correct anatomical location and shape, show general left/right symmetries, and similar to the gold-standard in Figure 1.Prediction accuracy was assessed through Dice Overlap coefficients (Figure 4). For the network predicting Recobundles segmentations (top) most Dice scores were between 0.3-0.7, indicating low to moderate overlap. However, we note that this segmentation scheme results in highly specific structures with smaller volumes, and Dice may not adequately convey prediction accuracy. Mean surface distances between prediction and gold-standard varied between 2.5-7mm for all bundles (1-3 voxels). When we assess Scan/Rescan Dice overlap (from the testing subjects) we find values similar to the predicted/gold-standard overlap, indicating that predictions are on par with variability expected in the tractography/reconstruction process. Predictions for TractSeg bundles generally show higher overlap (>0.8), with values similar to that from Scan/Rescan. We note that TractSeg gold-standard labels are generally a larger volume than that from Recobundles (an expected result given the models used) which may explain the favorable Dice coefficients (as binary overlap measures are biased to structure’s size).
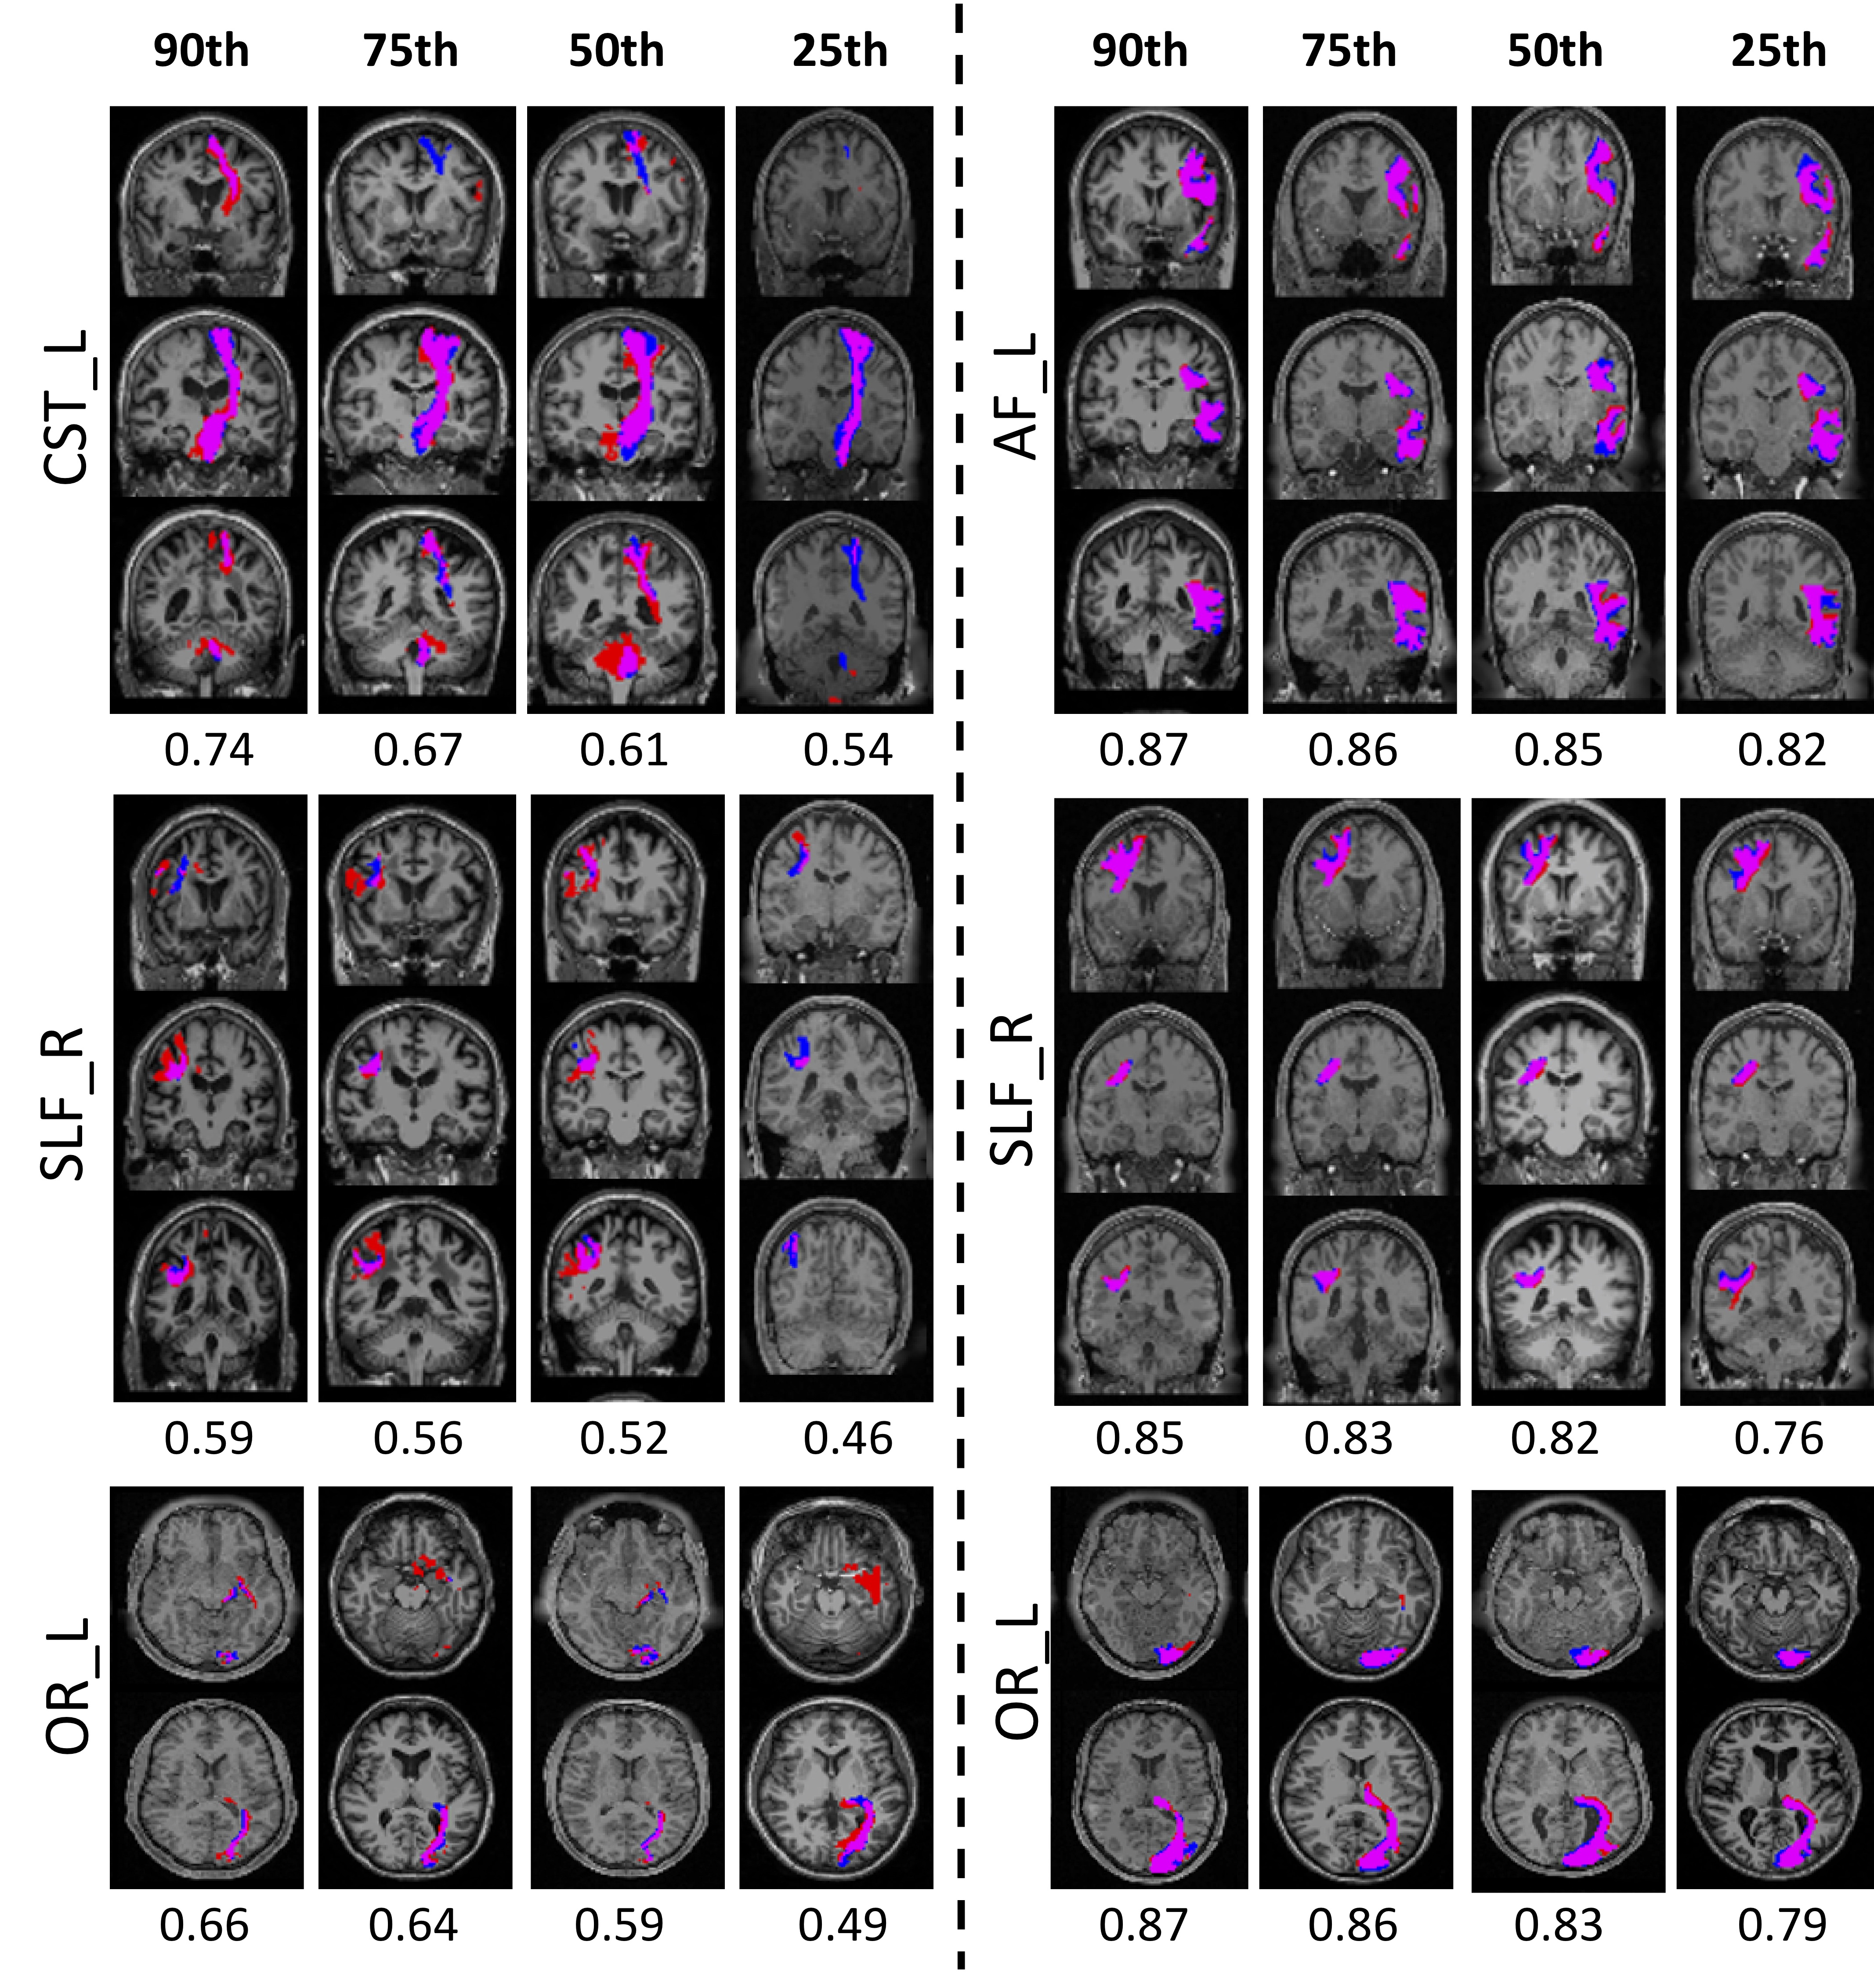
Example results for selected pathways are shown in Figure 5. Here, ranked in order of Dice overlap (per pathway) the 90th, 75th, 50th, and 25thpercentiles are shown with gold-standard labels (red), predicted labels (blue), and areas of overlap (magenta). It is clear that even in thin pathways, or low Dice, the network accurately predicts the core, or stem, of the bundles, but is inconsistent in delineating end points or cortical terminations.
Discussion
We train a network to learn WM pathway labels directly using only structural information, learning two sets of fiber “definitions” – TractSeg and Recobundles, and show that the method is able to satisfactorily delineate a majority of white matter pathways. Predicted results are generally in higher agreement with gold-standard pathways with larger pathways, or those that are clearly delineated in specific sulci/gyri. Even in subjects and pathways with low Dice overlap, the algorithms correctly identify the stem of the fiber bundles.We envision the use of this tool when no diffusion data is present (thus, tractography cannot be performed), and as an alternative to either (1) atlas-based labelling which is parcellated in spatially-separated regions-of-interest or (2) implicit assumptions of white matter locations.
This methodology is not intended to replace diffusion, but rather replaces unstated/implicit assumptions of where fibers are based on anatomy. Testing agreement with a human expert based on T1 would be of high interest in the future.
The output of the network can optionally be presented as a probability distribution, where end-users can be more/less restrictive on thresholding in order to increase sensitivity or specificity. Finally, we will also implement a number of additional parcellation or white matter labelling schemes, creating a reconstruction tool that enables users to choose not only which pathway, but also which scheme to reconstruct.
Acknowledgements
This work was conducted in part using the resources of the Advanced Computing Center for Research and Education at Vanderbilt University, Nashville, TN. This work was supported by the National Institutes of Health under award numbers R01EB017230, RO1NS058639, and T32EB001628. This research was funded in part by the Intramural Research Program of the National Institutes of Health, National Institute on Aging.References
1. Garyfallidis, E., et al., Recognition of white matter bundles using local and global streamline-based registration and clustering.Neuroimage, 2018. 170: p. 283-295.
2. Wasserthal, J., P. Neher, and K.H. Maier-Hein, TractSeg - Fast and accurate white matter tract segmentation.Neuroimage, 2018. 183: p. 239-253.
3. Watanabe, A., et al., The detection of white matter alterations in obsessive-compulsive disorder revealed by TRActs Constrained by UnderLying Anatomy (TRACULA).Neuropsychiatr Dis Treat, 2018. 1
4: p. 1635-1643.4. Warrington, S., et al., XTRACT - Standardised protocols for automated tractography and connectivity blueprints in the human and macaque brain.bioRxiv, 2019: p. 804641.
Figures