1021
Quantification of T1ρ using magnetic resonance fingerprinting1Cardiovascular and Metabolic Sciences, Cleveland Clinic, Cleveland, OH, United States, 2Biomedical Engineering, Cleveland Clinic, Cleveland, OH, United States
Synopsis
Quantitative T1ρ imaging has been studied for evaluating changes in tissue composition, in particular for detecting early cartilage degeneration in osteoarthritis. Magnetic resonance fingerprinting (MRF) provides a framework for rapid, robust acquisition of quantitative tissue property maps. Simulation experiments using spin-lock prepared MRF with different pulse schedules were conducted to demonstrate the feasibility of quantification of T1ρ in addition to T1 and T2. All tested sequences were sensitive to T1ρ and produced tissue property maps with major structures of interest. Differing accuracy and precision between sequences suggests opportunities for optimizing MRF for simultaneous T1, T2, and T1ρ quantification.
Introduction
Quantitative MRI can provide complementary information to morphologic imaging for the evaluation of degenerative musculoskeletal disease as well as injury. T1ρ, the spin-lattice relaxation in the rotation frame, and T2 relaxation times can probe early changes in proteoglycan-collagen matrix during cartilage degeneration prior to morphological or clinical changes in osteoarthritis1,2. However, T1ρ and T2 mapping techniques are in general time consuming and have shown variations using different MR systems3,4. Magnetic resonance fingerprinting (MRF) has been developed in recent years and has been shown to be an efficient quantitative imaging technique to provide T1 and T2 measures (and other quantitative measures such as perfusion and diffusion) that are reproducible across scanners5. However, no studies have yet quantified T1ρ using MRF. The addition of T1ρ quantification to the MRF framework would enable the quantification of multiple tissue properties in a single scan, thus simplifying the scan and image analysis workflows.Methods
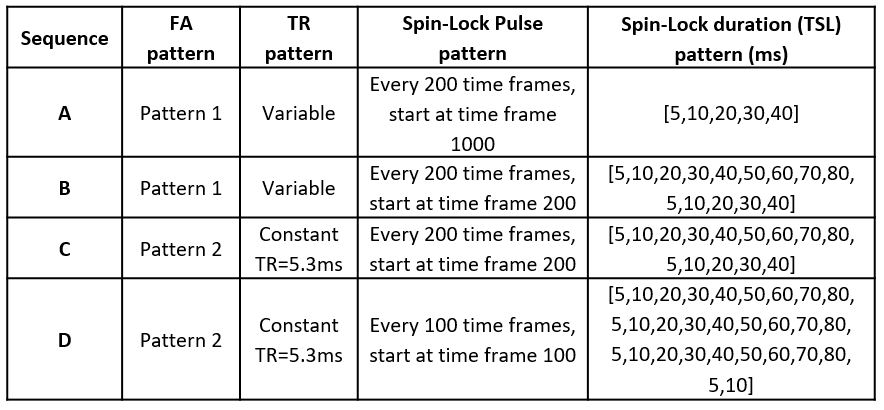
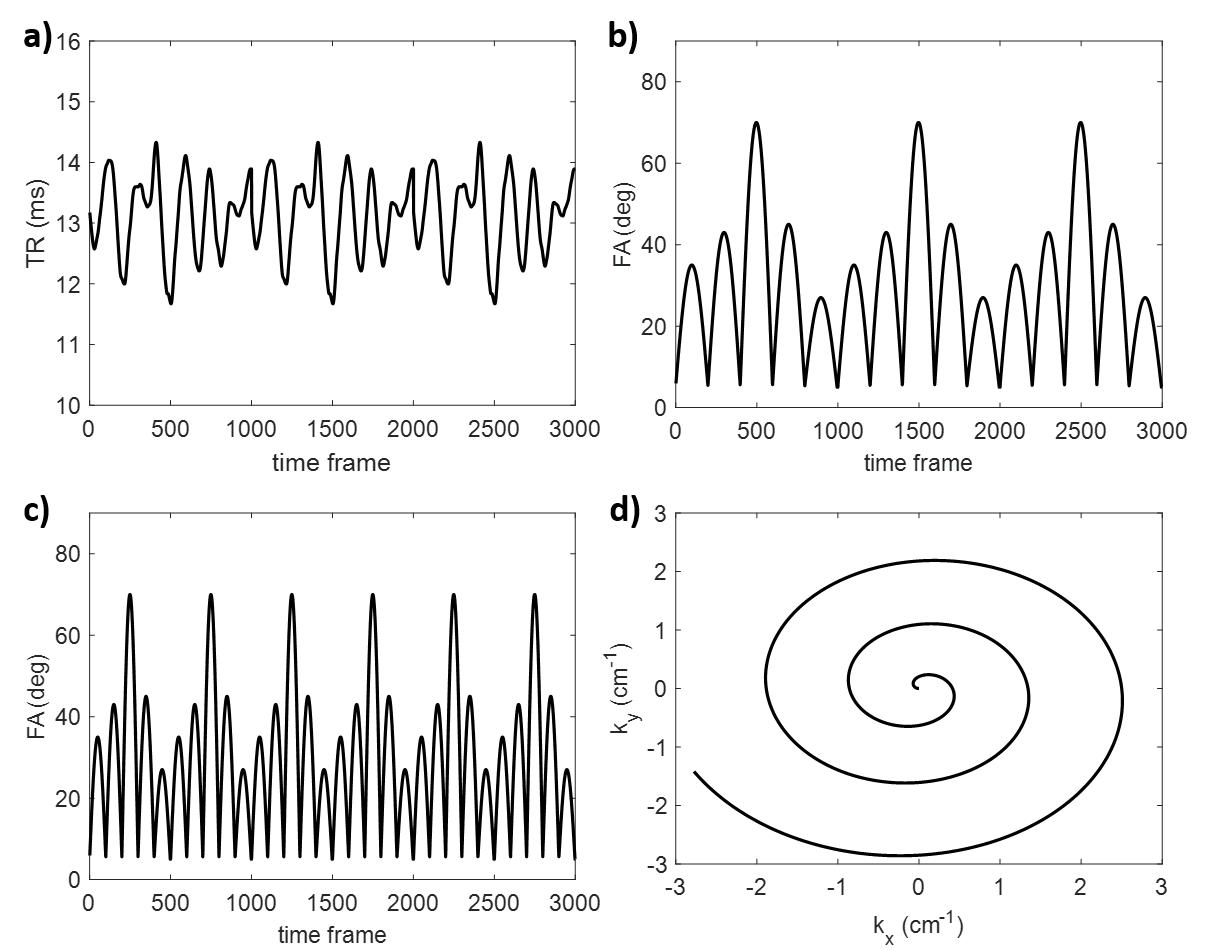
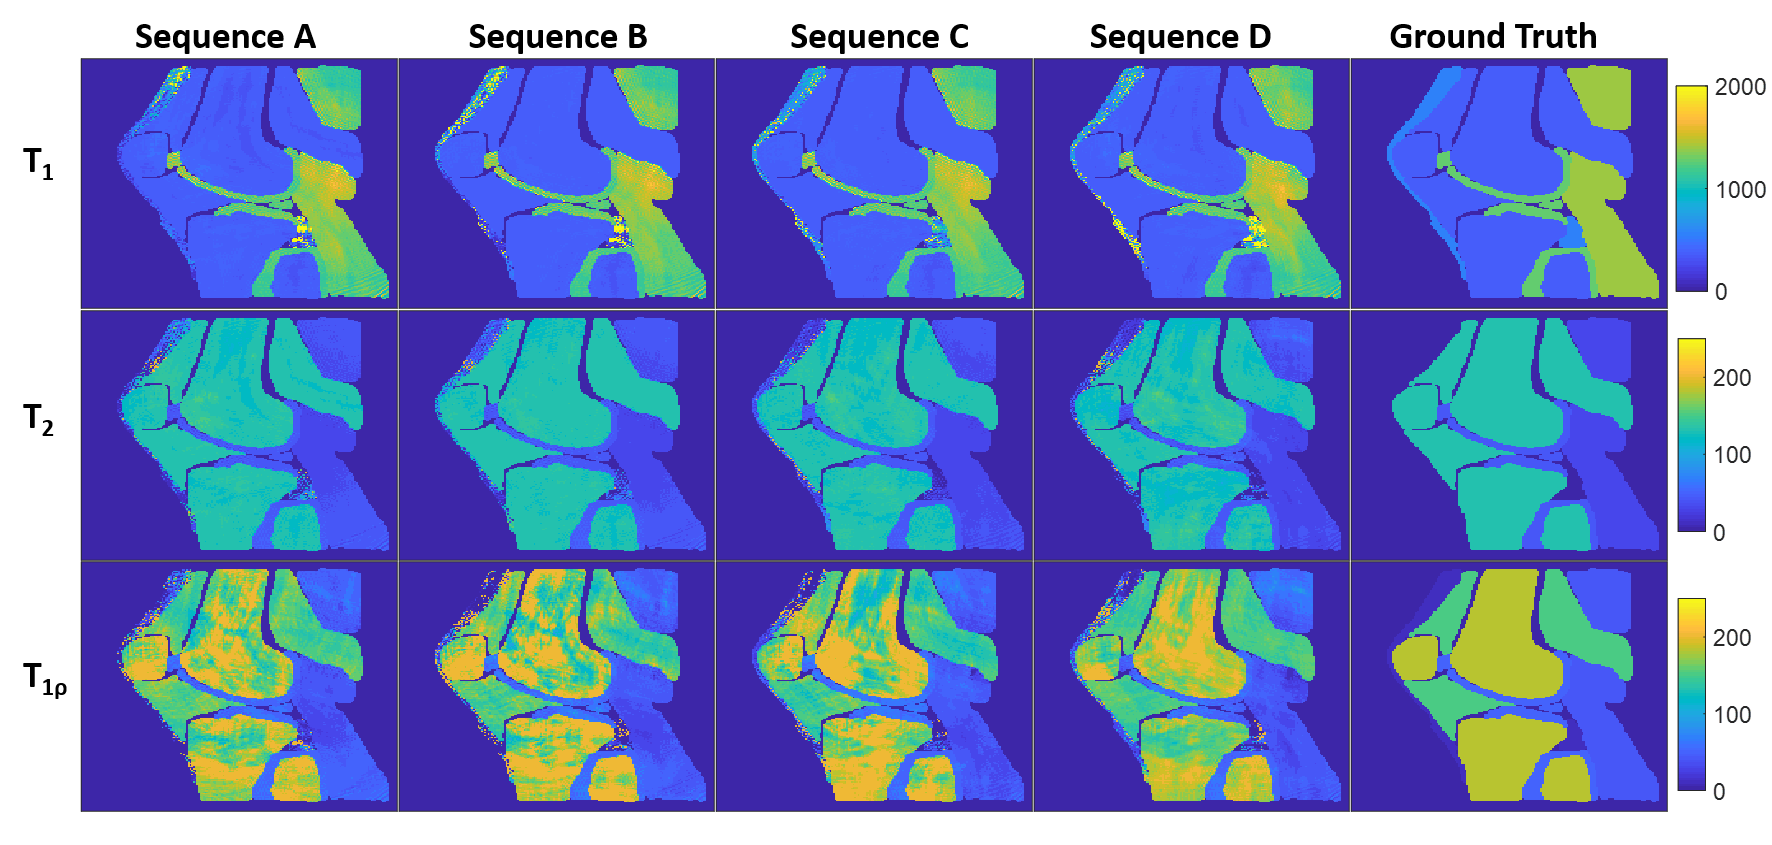
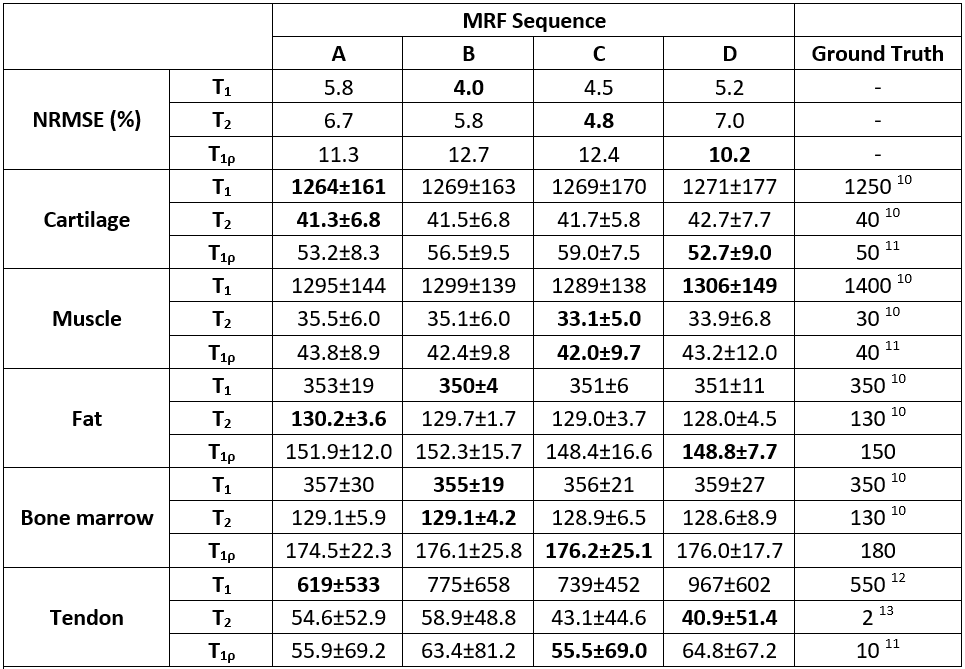
Simulated MRF scans at 3T were performed using a digital knee phantom with a sagittal slice orientation. The MRF sequences evaluated in this work were based on the MRF fast imaging with steady-state procession (FISP) sequence6. Four sequence variants were used (Table 1) to evaluate the effects of changing the flip angle (FA) pattern, TR pattern, and spin-lock preparation pulse schedule. A variable density spiral trajectory was used for all acquisitions. Pattern matching reconstruction was used with dictionary values of T1=100:50:2000 (ms), T2=2,5,10:10:200 (ms), and T1ρ=2,5,10:10:200 (ms). T1, T2, and T1ρ (at spin-lock frequency of 500Hz) values at 3T as reported in the literature were used as ground truth for the simulated tissues (Table 2). MRF sequences were compared in terms of relaxation time quantification using normalized root-mean-square error (NRMSE), average relaxation times within each tissue type, and standard deviation of relaxation times within each tissue type.Results
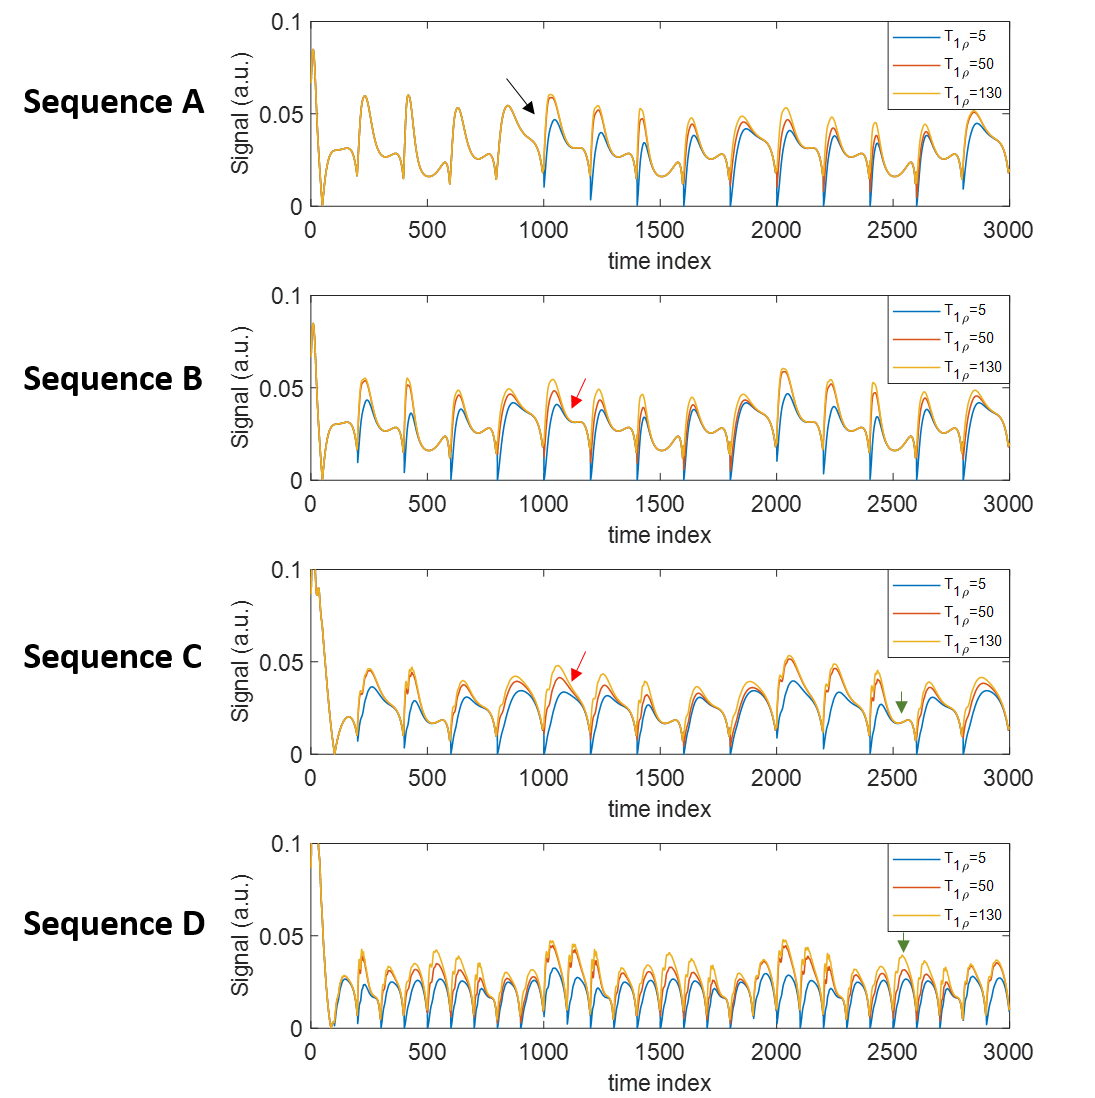
All tested sequences were sensitive to T1ρ values and produced tissue property maps with major structures of interest (Figure 2). Example signal evolutions for the sequences are shown in Figure 3, indicating that shorter TR and more frequent spin-lock preparation pulses can enhance sensitivity to T1ρ. Sequence D had lowest NRMSE for T1ρ estimation (Table 2), suggesting greatest overall quality. All sequences were unable to estimate the very short T1ρ in tendon or precisely estimate the long T1ρ in bone marrow. The optimal sequence in terms of accuracy and precision depended on the tissue type and relaxation time of interest. Changes in TR pattern, FA pattern, and spin-lock preparation pulse schedule was observed to impact precision and accuracy of relaxation time estimates to different degrees.Discussion
Spin-lock prepared MRF can enable the quantification of T1ρ in addition to T1 and T2. While both T2 and T1ρ cause exponential signal decay, the simulations showed that both can be quantified with the use of spin-lock preparation in MRF sequences. All tested sequences had differing advantages for relaxation time quantification depending on tissue type and relaxation property. The MRF Sequence D with short, constant TR and spin-lock preparation every 100 time frames provided best overall T1ρ quantification. The flexibility in the MRF framework may present an opportunity for SAR reduction as most T1ρ mapping techniques in the literature use spin-lock preparation every <100 TRs7,8. These findings demonstrate the feasibility of T1ρ quantification with MRF. Future refinements to the technique are anticipated via sequence optimization and improved image reconstruction. Evaluation of T1ρ dispersion via MRF may also be explored within this framework by incorporating different spin-lock frequencies.Conclusion
Magnetic resonance fingerprinting with spin-lock preparation pulses can be used to quantify T1ρ relaxation time in addition to T1 and T2. Further optimization of MRF sequences for simultaneous T1ρ, T1, and T2 quantification are warranted.Acknowledgements
The authors would like to thank Dr. Mark Griswold and Dr. Dan Ma for helpful discussions.References
1. Atkinson, H. F. et al. MRI T2 and T1ρ relaxation in patients at risk for knee osteoarthritis: a systematic review and meta-analysis. BMC Musculoskelet Disord 20, 182 (2019).
2. MacKay, J. W. et al. Systematic review and meta-analysis of the reliability and discriminative validity of cartilage compositional MRI in knee osteoarthritis. Osteoarthr. Cartil. 26, 1140–1152 (2018).
3. Balamoody, S. et al. Magnetic resonance transverse relaxation time T2 of knee cartilage in osteoarthritis at 3-T: a cross-sectional multicentre, multivendor reproducibility study. Skeletal Radiol. 42, 511–520 (2013).
4. Kim, J. et al. Multi-vendor Multi-site T1ρ and T2 Quantification of Knee Cartilage. ACR Meeting Abstracts. (2019)
5. Buonincontri, G. et al. Multi-site repeatability and reproducibility of MR fingerprinting of the healthy brain at 1.5 and 3.0 T. NeuroImage 195, 362–372 (2019).
6. Jiang, Y., Ma, D., Seiberlich, N., Gulani, V. & Griswold, M. A. MR fingerprinting using fast imaging with steady state precession (FISP) with spiral readout. Magnetic resonance in medicine 74, 1621–1631 (2015).
7. T1ρ‐prepared balanced gradient echo for rapid 3D T1ρ MRI - Witschey - 2008 - Journal of Magnetic Resonance Imaging - Wiley Online Library.
8. Li, X., Han, E. T., Busse, R. F. & Majumdar, S. In vivo T1ρ mapping in cartilage using 3D magnetization‐prepared angle‐modulated partitioned k‐space spoiled gradient echo snapshots (3D MAPSS). Magnetic Resonance in Medicine: An Official Journal of the International Society for Magnetic Resonance in Medicine 59, 298–307 (2008).
9. Hamilton, J. I. et al. MR fingerprinting for rapid quantification of myocardial T1, T2, and proton spin density. Magnetic resonance in medicine 77, 1446–1458 (2017).
10. Gold, G. E. et al. Musculoskeletal MRI at 3.0 T: Relaxation Times and Image Contrast. American Journal of Roentgenology 183, 343–351 (2004).
11. Ma, Y.-J. et al. 3D adiabatic T1ρ prepared ultrashort echo time cones sequence for whole knee imaging. Magnetic Resonance in Medicine 80, 1429–1439 (2018).
12. Krämer, M. et al. T1 and T2* mapping of the human quadriceps and patellar tendons using ultra-short echo-time (UTE) imaging and bivariate relaxation parameter-based volumetric visualization. Magnetic Resonance Imaging 63, 29–36 (2019).
13. Carl, M., Chiang, J., Han, E., Bydder, G. & King, K. Bloch simulations of UTE, WASPI and SWIFT for imaging short T2 tissues. in 884 (2010).
Figures