1011
Large-scale quantitative atlases over the whole adult age range1Advanced Clinical Imaging Technology, Siemens Healthcare AG, Lausanne, Switzerland, 2Department of Radiology, Lausanne University Hospital and University of Lausanne, Lausanne, Switzerland, 3LTS5, École Polytechnique Fédérale de Lausanne (EPFL), Lausanne, Switzerland, 4School of Psychology, Capital Normal University, Beijing Key Laboratory of Learning and Cognition, Beijing, China, 5Center for Brain Imaging Science and Technology, Key Laboratory for Biomedical Engineering of Ministry of Education, College of Biomedical Engineering and Instrumental Science, Zhejiang University, Hangzhou, Zhejiang, China, 6MR Collaboration, Siemens Healthcare Ltd., Shanghai, China, 7Department of Imaging Sciences, University of Rochester, Rochester, NY, United States, 8Department of Radiology, Xuanwu Hospital, Capital Medical University, Beijing, China, 9Beijing Key Laboratory of Magnetic Resonance Imaging and Brain Informatics, Beijing, China
Synopsis
It was recently shown that brain atlases of normative relaxation times enable automated detection of tissue alterations on a single-subject basis. In this work, normative quantitative T1 and T2 atlases were obtained from a large-scale adult cohort of healthy volunteers (#997) covering a comprehensive age range (19-72y) in a multi-centric study including eleven sites. Atlases were derived by linearly modelling the inter-subject variability of T1/T2 while accounting for effects such as gender and age differences. Travelling subjects were scanned in nine centers with the same protocol, the comparison of the acquired maps showed good reproducibility of the employed relaxometry sequences.
Introduction
Brain atlases are commonly used in neuroimaging studies to perform comparisons of structural and/or functional group-averaged properties from cohorts with different brain states1,2. The brevity and robustness of recently developed fast MR relaxometry methods allow for establishing normative atlases of quantitative parameters in healthy tissues which are sensitive to subtle tissue alterations on a single-subject basis3–5 – bearing great potential for clinical decision support. In addition, the high reproducibility of these fast quantitative techniques reduces the influence of confounding factors, enabling the collection and combination of large multi-site datasets to adequately represent brain characteristics of a population.Following this rationale, brain atlases of normative relaxation times are established in this work from a large cohort of 997 healthy subjects covering the whole adult age range. Relaxometry data was collected using MP2RAGE6 T1 and GRAPPATINI7 T2 mapping, and inter-subject variability of relaxation times was modelled to derive normative atlases. The reproducibility of the employed relaxometry techniques across the enrolled sites was validated by comparing maps acquired from three subjects that were scanned in nine participating centers.
Material and Methods
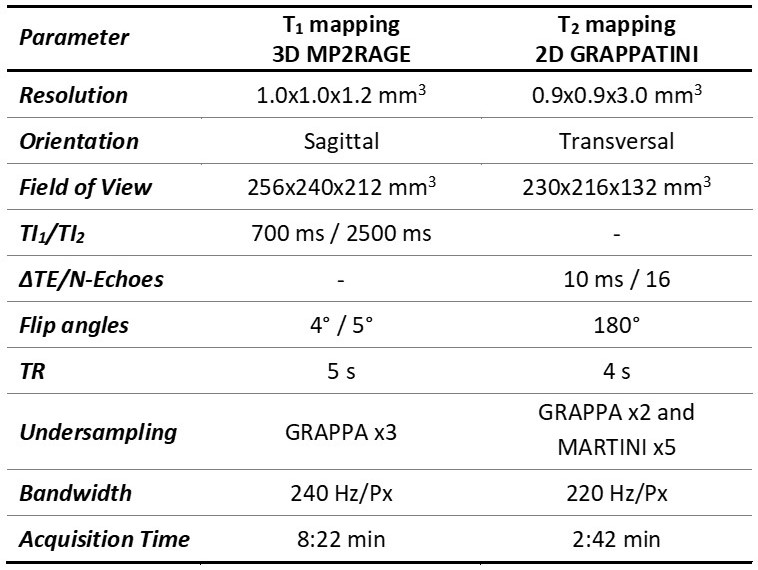
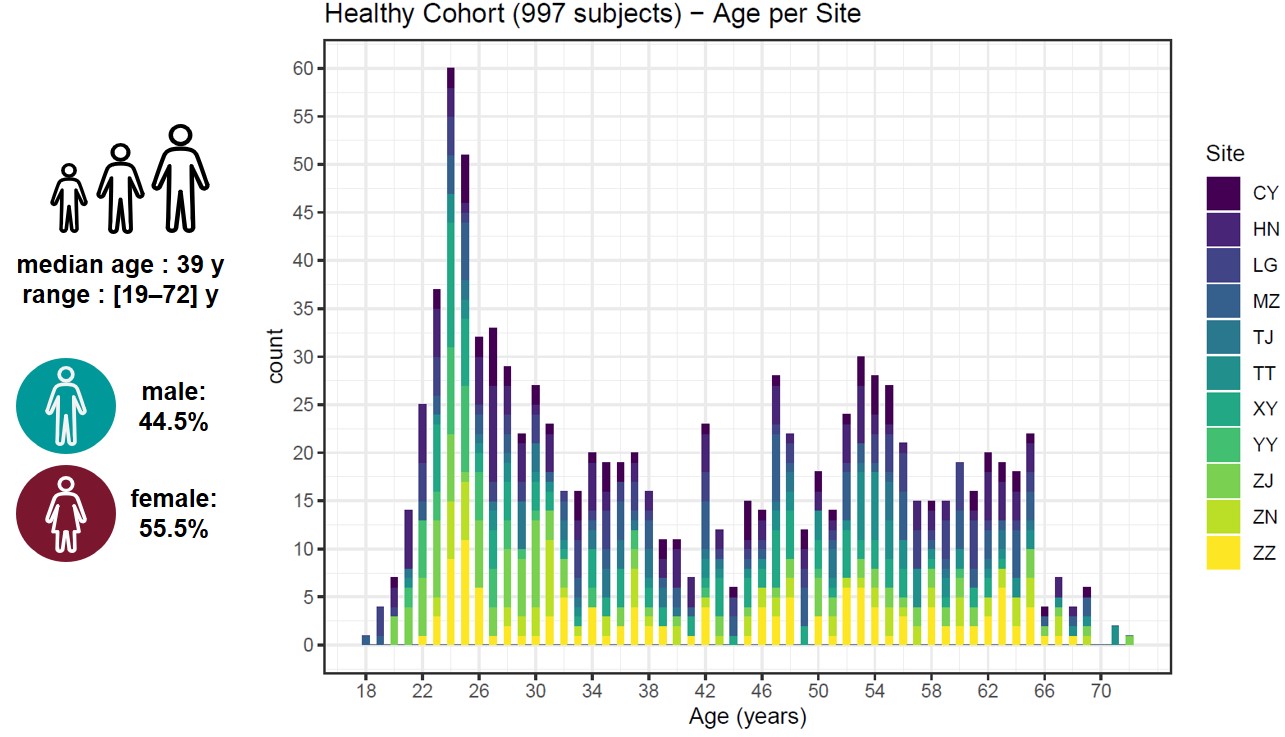
Population: 997 healthy subjects from 11 centers located in different orientations of China participated in this study. All subjects were confirmed to be cognitively healthy based on a battery of cognitive tests. MRI data were visually inspected by a radiologist. 48 subjects (4.8%) were excluded from the analysis due to missing or corrupted data files. Severe motion artifacts affecting the image quality of the acquired maps led to the exclusion of two additional subjects (0.2%). Demographics of the subjects that were included in the analysis are reported in Figure 1.Image acquisition: Acquisitions were performed at 3T (MAGNETOM Prisma, Siemens Healthcare, Erlangen, Germany) using a standard 64-channel head/neck coil after written informed consent was obtained. The prototype MP2RAGE6 and GRAPPATINI7 sequences were employed for whole brain relaxometry (see Table 1 for acquisition parameters).
Image processing: First, the T2 maps were rigidly registered to the T1 maps8. Brain tissues were then segmented from the MP2RAGE T1-weighted volumes9,10, and a study-specific anatomical T1-weighted template was built11. Brain volumes were spatially normalized to the study-specific template using a non-linear registration. The estimated transformation was subsequently applied to the T1 and T2 maps to spatially align all subjects into the same common space.
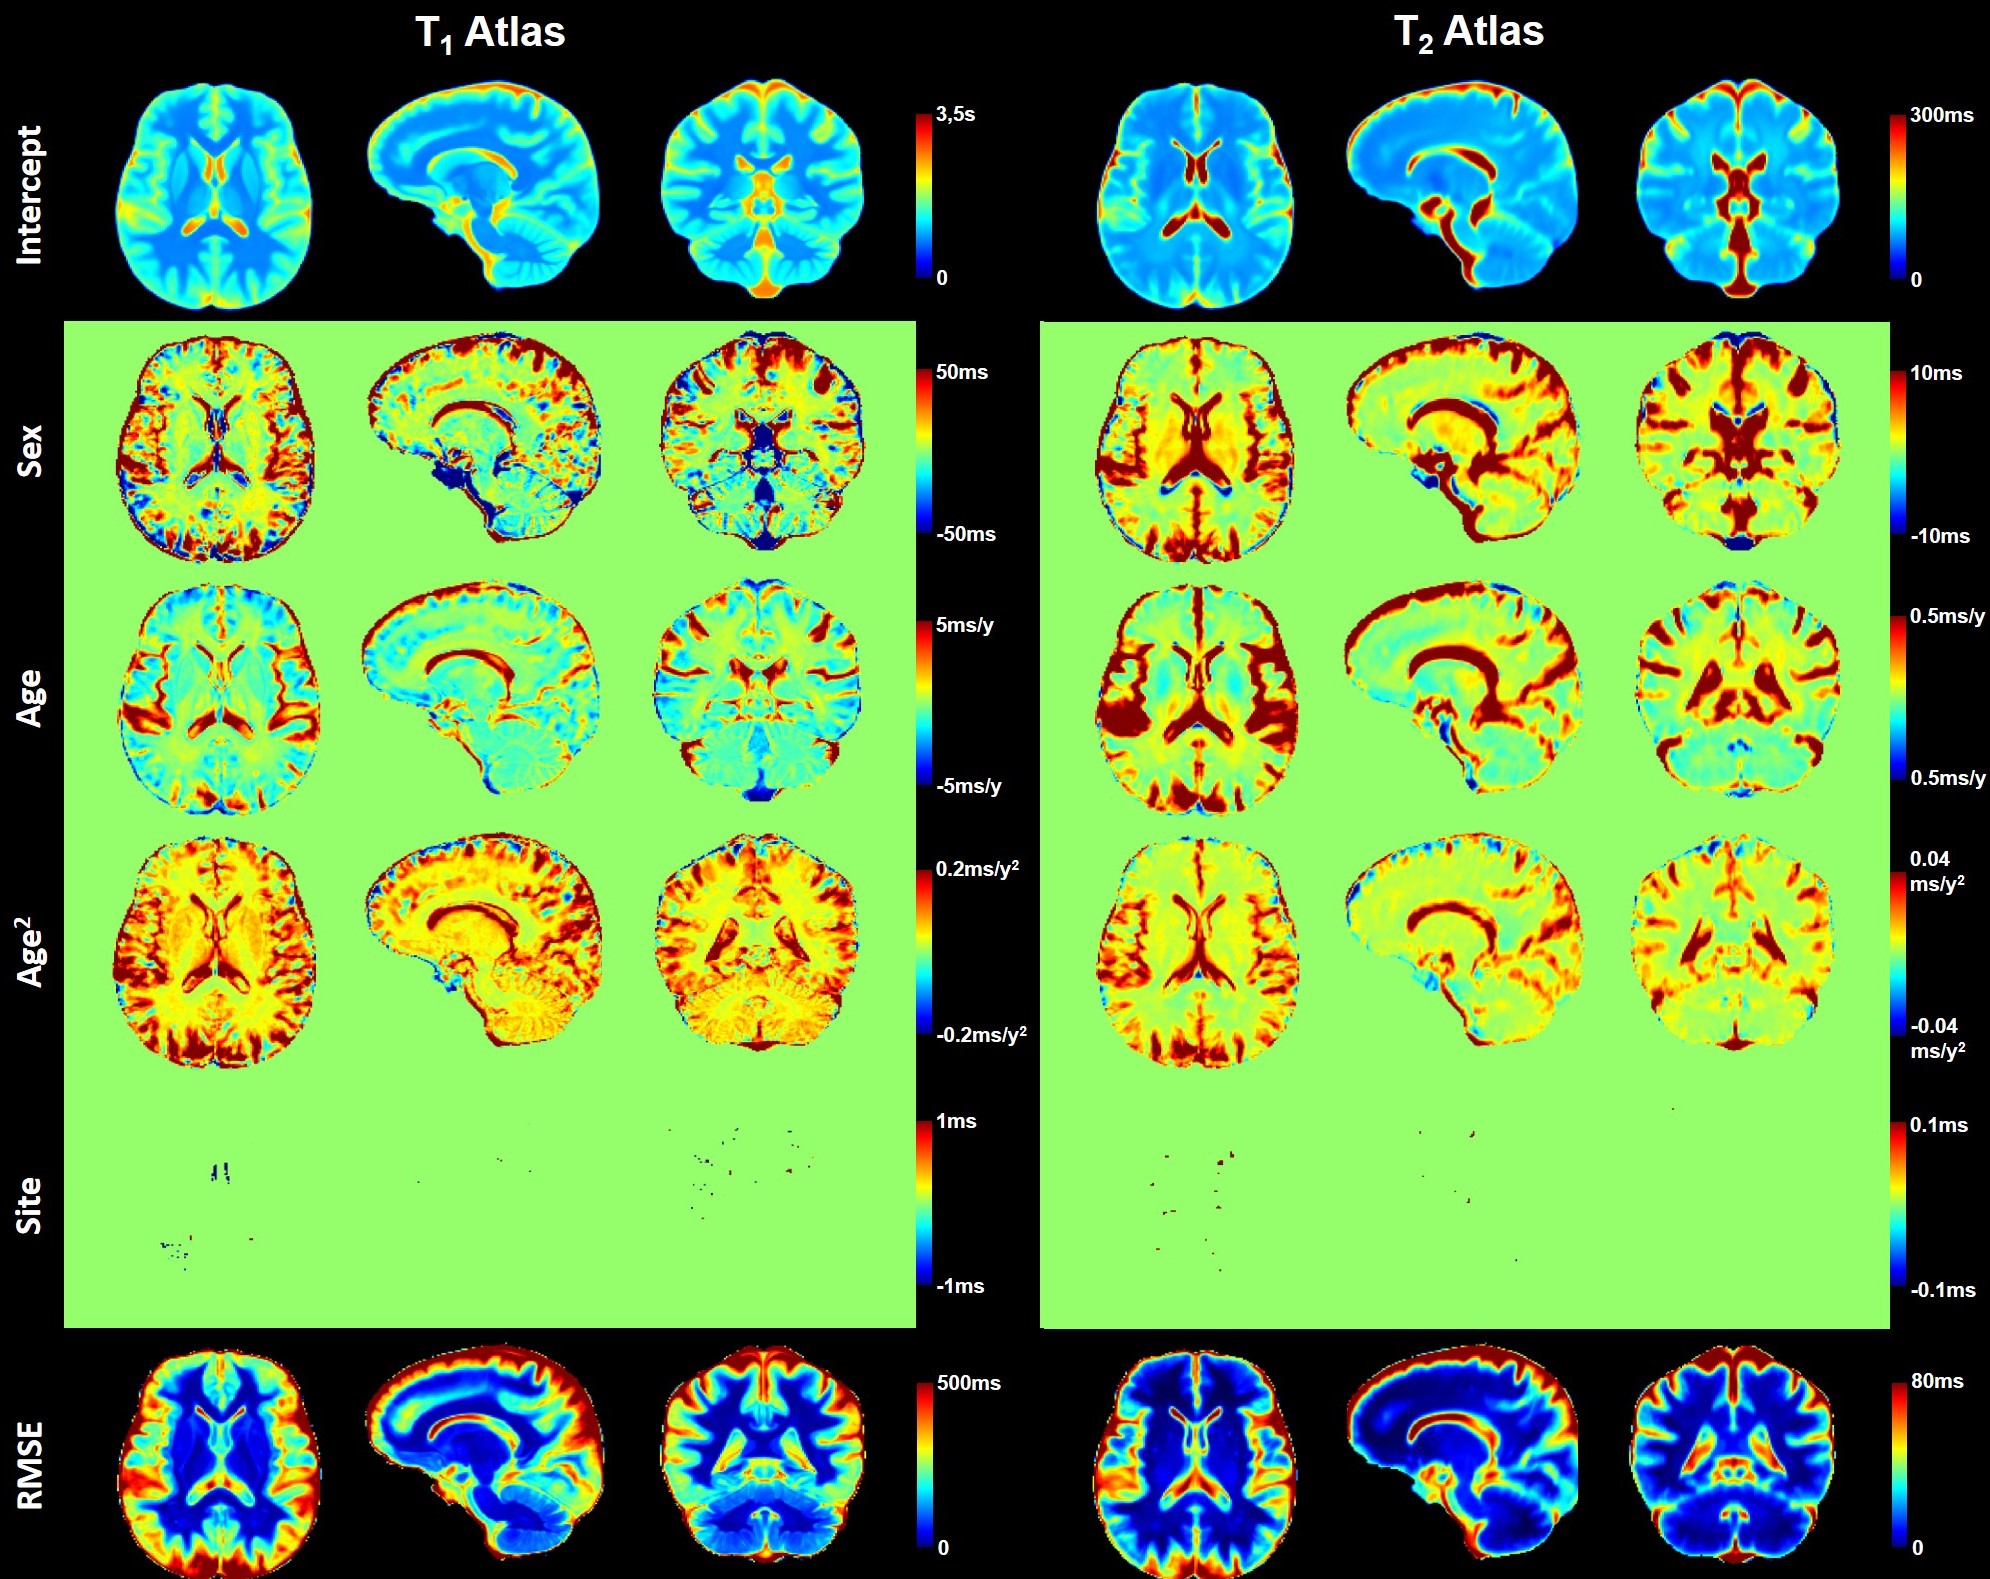
Atlas creation: The inter-subject variability of T1 and T2 values was linearly modelled for each voxel (r) accounting for age and gender differences and considering the site as a random effect (u) on the model intercept: $$E\left\{T_1(\mathbf{r})\right\}=\beta_{0,T_1}(\mathbf{r})+\beta_{sex,T_1}(\mathbf{r})\ast sex+\beta_{age,T_1}(\mathbf{r})\ast age+\beta_{age,{T_1}^2}(\mathbf{r})\ast{age}^2+u_{site,T_1}(\mathbf{r})\ast(1|site),$$ $$E\left\{T_2(\mathbf{r})\right\}=\beta_{0,T_2}(\mathbf{r})+\beta_{sex,T_2}(\mathbf{r})\ast sex+\beta_{age,T_2}(\mathbf{r})\ast age+\beta_{age,{T_2}^2}(\mathbf{r})\ast{age}^2+u_{site,T_2}(\mathbf{r})\ast(1|site).$$
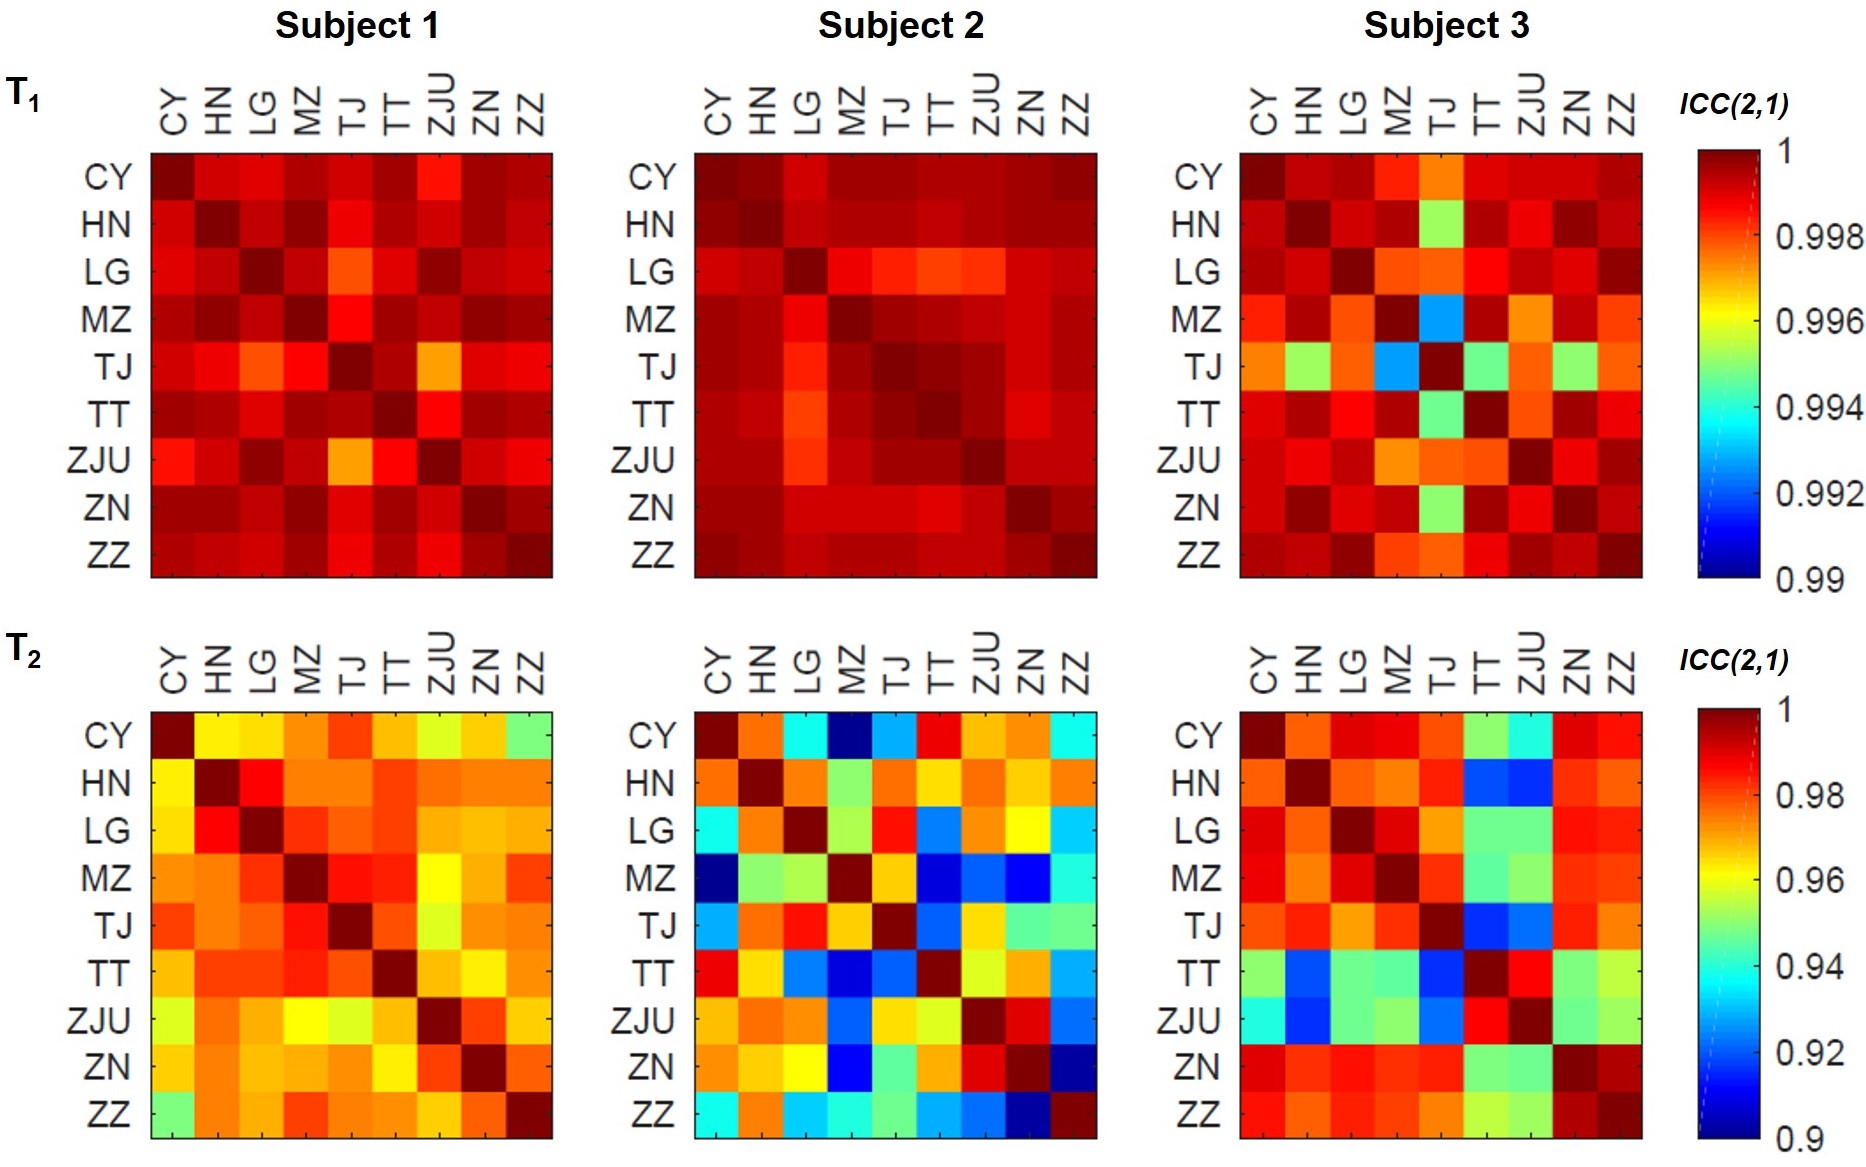
Validation: Three healthy subjects (one male, 23 years old, and two females, 26 and 23 years old) were scanned at nine centers within one month under the same MRI protocol12. The intraclass correlation coefficients (ICC(2,1)) among average T1 values and among average T2 values within brain regions of interest were computed pair-wise across the different sites to assess the reproducibility of the acquired maps.
Results
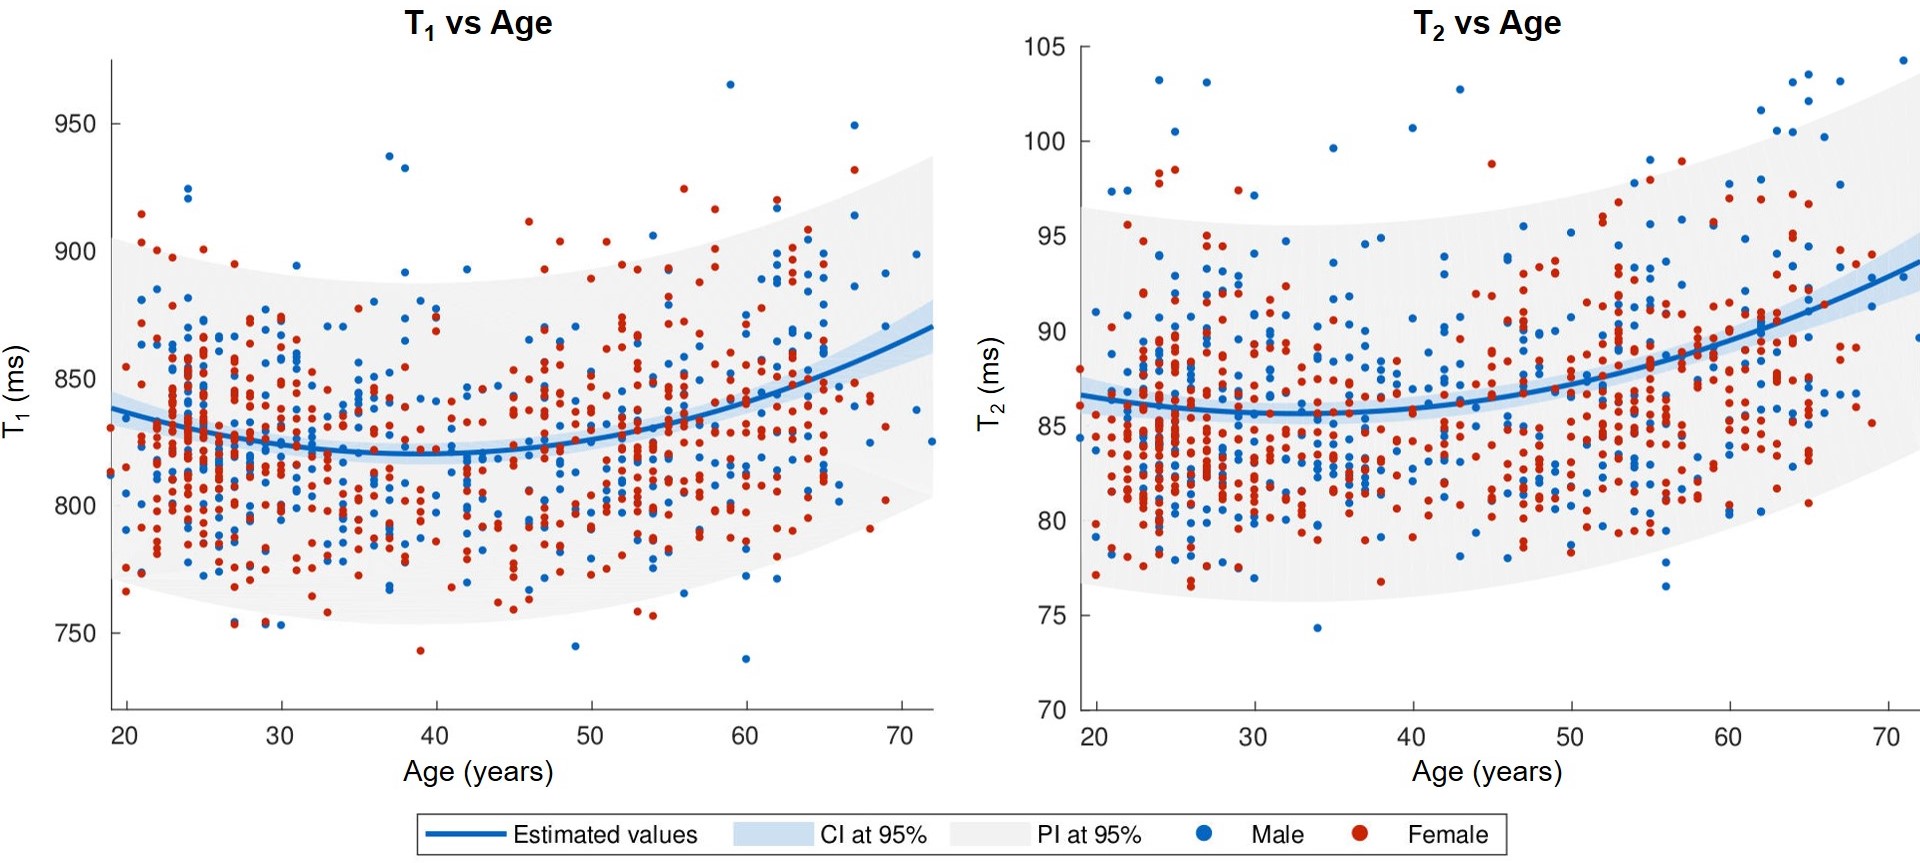
Representative slices of the established normative T1 and T2 atlases are shown in Figure 2. Expected T1 and T2 values in an example voxel of the WM frontal lobe at the mean age of the cohort (41 y) were found to be: E{T1} ± RMSE = 810 ± 31 ms, E{T2} ± RMSE = 71 ± 3 ms. A representative evolution of the relaxation times with age following the expected U-shape13 is shown in Figure 3. The effect of the site was found to be null in all WM tissues. The models exhibited a low RMSE in WM and deep GM (ΔT1 = 25–117 ms, median = 35 ms; ΔT2 = 3–42 ms, median = 5 ms), but higher values in cortical GM (ΔT1 = 37–154 ms, median = 67 ms; ΔT2 = 2–54 ms, median = 7 ms).ICCs of relaxation times computed for each pair of sites are reported in Figure 4. All ICCs were found to be higher than 0.99 for T1, and above 0.90 for T2.
Discussion and Conclusion
In this work, atlases of normative relaxation times in the brain were established and validated from – to the best of the authors’ knowledge – the largest healthy T1/T2 relaxometry cohort today, covering a comprehensive age range. Despite the large number of healthy subjects, low RMSEs were observed in subcortical tissues, demonstrating the low inter‐subject variability of T1 and T2 relaxation times when accounting for confounding effects. The good reproducibility of the acquired maps among different sites contributed to the results and was underpinned by the negligible effect the site coefficient had on the modelling, and the high ICCs resulting from the analysis of the traveling subjects. Nonetheless, reproducibility among different type of scanners remains to be tested, and a framework for reliable cortical atlas information has yet to be established.In conclusion, the presented atlases may be used as a tool in the neuroimaging research community especially for monitoring and characterization of neurodegenerative disease, but may hopefully also help to bring quantitative MRI closer to clinical applications. To these ends, the normative atlases are planned to be made publicly available.
Acknowledgements
We would like to acknowledge participation in this work from the following hospitals and institutions in China: Beijing Neurosurgical Institute, Beijing Chaoyang Hospital, Beijing Friendship Hospital, Henan Provincial People's Hospital, The First Affiliated Hospital of Zhengzhou University, Longgang District Central Hospital of Shenzhen, Tianjin First Central Hospital, Xiangya Hospital of Central South University, Meizhou People's Hospital, and Zhongnan Hospital of Wuhan University.References
1. Evans AC, Janke AL, Collins DL, Baillet S. Brain templates and atlases. Neuroimage. 2012;62(2):911-922.
2. Liang P, Shi L, Chen N, et al. Construction of brain atlases based on a multi-center MRI dataset of 2020 Chinese adults. Sci Rep. 2016;5(1):18216.
3. Warntjes JBM, Engström M, Tisell A, Lundberg P. Brain Characterization Using Normalized Quantitative Magnetic Resonance Imaging. PLoS One. 2013;8(8).
4. Bonnier G, Fischi-Gomez E, Roche A, et al. Personalized pathology maps to quantify diffuse and focal brain damage. NeuroImage Clin. 2019;21:101607.
5. Piredda GF, Hilbert T, Granziera C, et al. Quantitative brain relaxation atlases for personalized detection and characterization of brain pathology. Magn Reson Med. 2020;83(1):337-351.
6. Marques JP, Kober T, Krueger G, van der Zwaag W, Van de Moortele P-F, Gruetter R. MP2RAGE, a self bias-field corrected sequence for improved segmentation and T1-mapping at high field. Neuroimage. 2010;49(2):1271-1281.
7. Hilbert T, Sumpf TJ, Weiland E, et al. Accelerated T2 mapping combining parallel MRI and model-based reconstruction: GRAPPATINI. J Magn Reson Imaging. 2018;48(2):359-368.
8. Klein S, Staring M, Murphy K, Viergever MA, Pluim J. elastix: A Toolbox for Intensity-Based Medical Image Registration. IEEE Trans Med Imaging. 2010;29(1):196-205.
9. Fujimoto K, Polimeni JR, van der Kouwe AJW, et al. Quantitative comparison of cortical surface reconstructions from MP2RAGE and multi-echo MPRAGE data at 3 and 7T. Neuroimage. 2014;90:60-73.
10. Schmitter D, Roche A, Maréchal B, et al. An evaluation of volume-based morphometry for prediction of mild cognitive impairment and Alzheimer’s disease. NeuroImage Clin. 2015;7:7-17.
11. Avants BB, Yushkevich P, Pluta J, et al. The optimal template effect in hippocampus studies of diseased populations. Neuroimage. 2010;49(3):2457-2466.
12. Tong Q, He H, Gong T, et al. Reproducibility of multi-shell diffusion tractography on traveling subjects: A multicenter study prospective. Magn Reson Imaging. 2019;59:1-9.
13. Slater DA, Melie‐Garcia L, Preisig M, Kherif F, Lutti A, Draganski B. Evolution of white matter tract microstructure across the life span. Hum Brain Mapp. 2019;40(7):2252-2268.
Figures