1009
Multi-Center Phantom Validation of a Novel Method for Temperature Correction in PDFF Estimation using Magnitude Chemical Shift-Encoded MRI
Ruvini Navaratna1,2, Timothy J Colgan1, Ruiyang Zhao1,2, Houchun Harry Hu3, Mark Bydder4, Takeshi Yokoo5, Mustafa R Bashir6,7,8, Michael S Middleton9, Suraj D Serai10, Daria Malyarenko11, Thomas Chenevert11, Mark Smith3, Walter Henderson9, Gavin Hamilton9, Yunhong Shu12, Claude B Sirlin9, Jean A Tkach13, Andrew T Trout13, Jean H Brittain14, Diego Hernando1,2, and Scott B Reeder1,2,15,16,17
1Radiology, University of Wisconsin-Madison, Madison, WI, United States, 2Medical Physics, University of Wisconsin-Madison, Madison, WI, United States, 3Radiology, Nationwide Children's Hospital, Columbus, OH, United States, 4Radiological Sciences, University of California - Los Angeles, Los Angeles, CA, United States, 5Radiology, University of Texas Southwestern Medical Center, Dallas, TX, United States, 6Radiology, Duke University Medical Center, Durham, NC, United States, 7Division of Gastroenterology, Duke University Medical Center, Durham, NC, United States, 8Center for Advanced Magnetic Resonance Development, Duke University Medical Center, Durham, NC, United States, 9Radiology, University of California - San Diego, San Diego, CA, United States, 10Radiology, Children's Hospital of Philadelphia, Philadelphia, PA, United States, 11Radiology, University of Michigan, Ann Arbor, MI, United States, 12Radiology, Mayo Clinic, Rochester, MN, United States, 13Radiology, Cincinnati Children's Hospital Medical Center, Cincinnati, OH, United States, 14Calimetrix, LLC, Madison, WI, United States, 15Biomedical Engineering, University of Wisconsin-Madison, Madison, WI, United States, 16Medicine, University of Wisconsin-Madison, Madison, WI, United States, 17Emergency Medicine, University of Wisconsin-Madison, Madison, WI, United States
1Radiology, University of Wisconsin-Madison, Madison, WI, United States, 2Medical Physics, University of Wisconsin-Madison, Madison, WI, United States, 3Radiology, Nationwide Children's Hospital, Columbus, OH, United States, 4Radiological Sciences, University of California - Los Angeles, Los Angeles, CA, United States, 5Radiology, University of Texas Southwestern Medical Center, Dallas, TX, United States, 6Radiology, Duke University Medical Center, Durham, NC, United States, 7Division of Gastroenterology, Duke University Medical Center, Durham, NC, United States, 8Center for Advanced Magnetic Resonance Development, Duke University Medical Center, Durham, NC, United States, 9Radiology, University of California - San Diego, San Diego, CA, United States, 10Radiology, Children's Hospital of Philadelphia, Philadelphia, PA, United States, 11Radiology, University of Michigan, Ann Arbor, MI, United States, 12Radiology, Mayo Clinic, Rochester, MN, United States, 13Radiology, Cincinnati Children's Hospital Medical Center, Cincinnati, OH, United States, 14Calimetrix, LLC, Madison, WI, United States, 15Biomedical Engineering, University of Wisconsin-Madison, Madison, WI, United States, 16Medicine, University of Wisconsin-Madison, Madison, WI, United States, 17Emergency Medicine, University of Wisconsin-Madison, Madison, WI, United States
Synopsis
Chemical shift-encoded MRI (CSE-MRI) is well-established to quantify proton density fat-fraction (PDFF) as a quantitative biomarker of hepatic steatosis.1 However, temperature is known to affect the accuracy and precision of PDFF quantification.2 In this study, we aim to characterize the effects of temperature on PDFF quantification using computer simulations, temperature-controlled phantom experiments, and a multi-center phantom study. Further, we present a novel method to minimize temperature-related fat quantification bias for magnitude-based CSE-MRI methods.
Introduction
CSE-MRI is well established as an accurate and precise method to quantify proton density fat-fraction (PDFF) as a quantitative biomarker of hepatic steatosis.1 PDFF is reconstructed using a multi-peak spectral model:3 $$S(TE_n)=[W+F{c_N}]e^{i{2 \pi}{f_B}TE_n}e^{-R_2^*TE_n}$$ where $$$W$$$ and $$$F$$$ are the complex signal amplitudes of water and fat, respectively, $$$c_N=\sum_{p=1}^P {\alpha_p}e^{i{2\pi}{f_{F,p}}TE_n}$$$ is the multi-fat peak model with $$$P$$$ peaks of amplitude $$$\alpha_p$$$ and frequencies $$$f_{F,p}$$$ relative to the water resonance, $$$f_B$$$ is the bulk field shift, and $$$TE_n$$$ is the $$$n$$$th echo time. The PDFF can be calculated as: $$PDFF=100\times\frac{F}{W+F}$$ Generally, the spectral model of fat assumes an in vivo temperature of 37.0°C with the relative water and fat methylene peak separated by 3.4ppm.2However, the proton resonance frequency of water will change with temperature.4,5 The temperature-corrected signal can be modeled: $$S(TE_n)=[We^{i{2\pi}{f_{T}}TE_n}+F{c_N}]e^{i{2\pi}{f_B}TE_n}e^{-R_2^*TE_n}$$ where $$$f_T$$$ is the frequency offset of water due to temperature, which shifts by −0.01 ppm/°C.
In ex vivo tissue or phantom studies, where the object is not at body temperature (eg. 21°C), PDFF estimation with a temperature-uncorrected model may lead to meaningful bias.2
Here, a novel method to minimize global temperature-related bias in PDFF estimation is proposed and evaluated using simulations, temperature-controlled experiments, and as part of a multi-center round-robin phantom study.
Methods
Simulations:Noiseless multi-echo fat-water signals were simulated at 1.5T and 3T with $$$R_2^*=0 s^{-1}$$$ and $$$f_B = 0 Hz$$$ at temperatures from 0°C to 37.0°C for fat-fraction values of 0-50%. Six echoes were assumed with echo times typical for magnitude-based CSE-MRI PDFF estimation, with an initial TE of 2.3ms (1.15ms) and $$$\Delta$$$TE of 2.3ms (1.15ms) at 1.5T (3T). PDFF estimation was performed using magnitude nonlinear least-squares fitting, $$$|S(TE_n)|$$$ from Eq. 1, using a nonlinear least-squares fit to estimate PDFF, without temperature.
Phantom Setup:
A fat phantom previously described as part of a multi-center Quantitative Imaging Biomarkers Alliance (QIBA) study,6 was used for a set of temperature-controlled experiments. Twelve vials with PDFF ranging from 0 to 100% (Figure 1) were fixed in a spherical phantom housing (Model 300, Calimetrix, Madison, WI).
Temperature-Controlled Phantom Experiments:
The phantom was imaged at 1.5T and 3T (1.5T 450w, 3.0T Signa Premier, GE Healthcare, Waukesha, WI) using standard head coils (1.5T - 8 Channel Hi-Res Brain Coil, 3.0T - 48 channel head coil) at three temperatures, nominally 2°C, 21°C, and 37.0°C. Surface temperature of the phantom was measured using an infrared temperature probe (Lasergrip 1080, Etekcity, Anaheim, CA). Data were acquired using a 2D multi-echo acquisition to provide magnitude only data. Acquisition parameters are listed in Table 1.
Multi-Center Phantom Experiments:
Multi-center validation of the temperature-corrected model was performed using data acquired from the QIBA PDFF study,6 which used the same phantom. 68 magnitude datasets, acquired on 24 unique MR systems, were acquired at 9 different sites across the U.S., using 3 different vendors (GE, Siemens, Philips), at both 1.5T and 3T. Acquisition parameters are listed in Table 1. All acquisitions were performed at room temperature.
Reconstruction and Analysis:
Magnitude fitting was performed using Eq. 3, assuming temperatures from 0°C to 37.0°C to generate PDFF maps. For each reconstruction, the slope of apparent vs true PDFF was recorded. Slope difference, ie: true slope – apparent slope, or 1 – apparent slope, was recorded as an error metric. Voxel-wise fit error, or the sum of squared residuals, $$$\sum_{TE} (S_{est}(TE) - S_{meas}(TE))^2$$$ was also measured, and the average over all ROIs was used as a second error metric.
To minimize temperature-related PDFF estimation bias, we determine the minimum of these global fit errors over 0-37.0°C. The temperature at which fit error is minimized is used for the temperature-corrected signal to minimize PDFF bias, even if the true temperature of the phantom is unknown.
Results
Simulations:Simulations showing PDFF bias as a function of temperature are plotted in Figure 2. PDFF bias increases as the temperature deviates further from 37.0°C and at higher PDFF.
Temperature-Controlled Phantom Experiments:
For the temperature-controlled experiment, the fit error for each temperature-controlled scan is shown in Figure 3. The fit error was minimized close to the true temperature of the phantom vials.
Multi-Center Phantom Experiments:
An example of apparent vs. true PDFF is shown in Figure 4a. This demonstrates the error metric of slope difference. A summary of the PDFF bias, shown as the deviation in true slope (1.0) and apparent slope, before and after correction for temperature, is shown for all 68 acquisitions performed in the QIBA round-robin study in Figure 4b. The PDFF bias is greatly reduced after correction for temperature using the proposed method (p = 0.001).
Discussion and Conclusions
In this work we investigated the effects of temperature on the accuracy of magnitude based CSE-MRI to quantify PDFF in phantoms. Our simulations demonstrate that PDFF bias is highly dependent on temperature. Further, we have proposed a strategy that minimizes the effects of temperature by identifying the temperature that minimizes fitting error. PDFF bias from a large multi-site round-robin phantom study was reduced by correcting for the temperature through a proposed technique that minimizes global fitting error, without any a priori information on the phantom temperature.Acknowledgements
The authors wish to acknowledge support from the NIH (R41-EB025729, R01 DK088925, K24 DK102595), as well as GE Healthcare and Bracco Diagnostics who provides research support to the University of Wisconsin, and from Calimetrix for providing use of the phantom used in this study. Finally, Dr. Reeder is a Romnes Faculty Fellow, and has received an award provided by the University of Wisconsin-Madison Office of the Vice Chancellor for Research and Graduate Education with funding from the Wisconsin Alumni Research Foundation.References
- Yokoo et al. Linearity, Bias, and Precision of Hepatic Proton Density Fat Fraction Measurements by Using MR Imaging: A Meta-Analysis. Radiology; 2017.
- Hernando et al. On the Confounding Effect of Temperature on Chemical Shift Encoded Fat Quantification. Magn Reson Med; 2014.
- Hernando et al. Chemical shift-based water/fat separation: a comparison of signal models. Magn Reson Med; 2010.
- Kuroda et al. Temperature mapping using the water proton chemical shift: a chemical shift selective phase mapping method. Magn Reson Med 1997; 38:845–851
- Sprinkhuizen et al. Temperature‐induced tissue susceptibility changes lead to significant temperature errors in PRFS‐based MR thermometry during thermal interventions. Magn Reson Med 2010;64:1360–1372.
- Hu et al. Multi-Site, Multi-Vendor, and Multi-Platform Reproducibility and Accuracy of Quantitative Proton-Density Fat Fraction (PDFF) at 1.5 and 3 Tesla with a Standardized Spherical Phantom: Preliminary Results from a Study by the RSNA QIBA PDFF Committee. International Society for Magnetic Resonance in Medicine Annual Meeting. Montreal, Canada. May 16, 2019. Program Number: 1023.
- Reeder et al. Quantitative Assessment of Liver Fat with Magnetic Resonance Imaging and Spectroscopy. J Magn Reson Imaging. 2011;34(4):729–749.
Figures
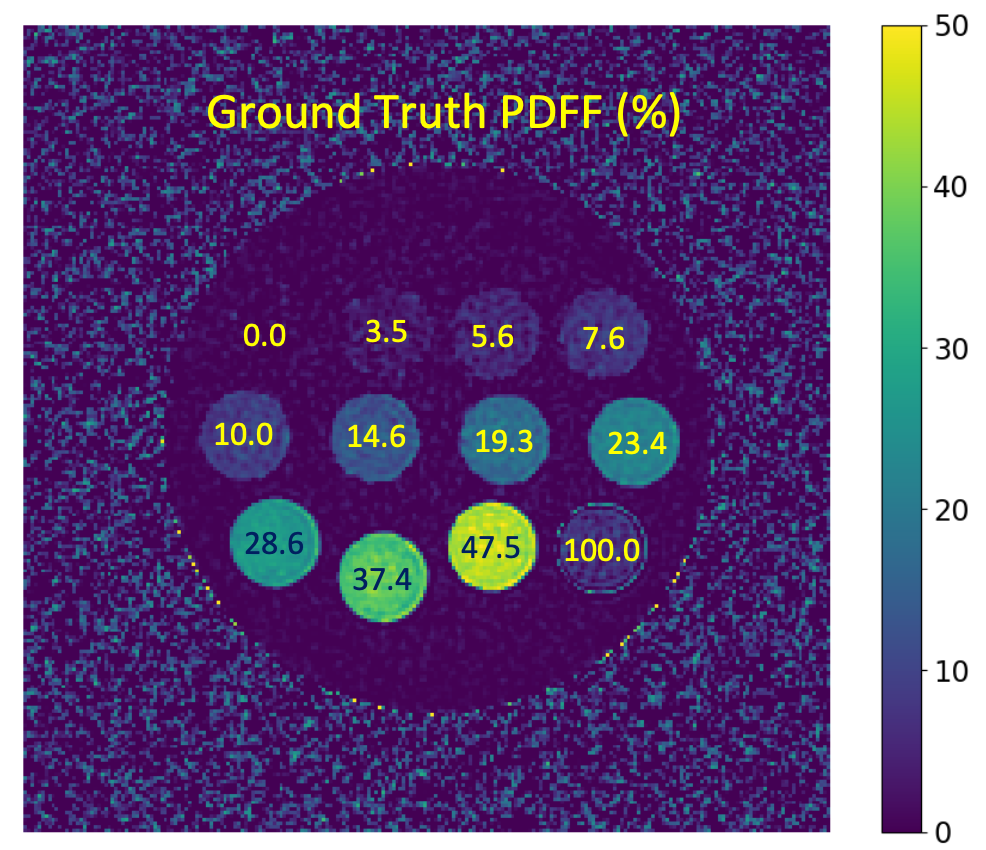
Figure 1. Example PDFF map
with ground truth PDFF values labeled for each vial. The vial corresponding to PDFF = 100% was excluded
in the analysis due to the limitation that magnitude fitting cannot estimate
PDFF values above 50%.7
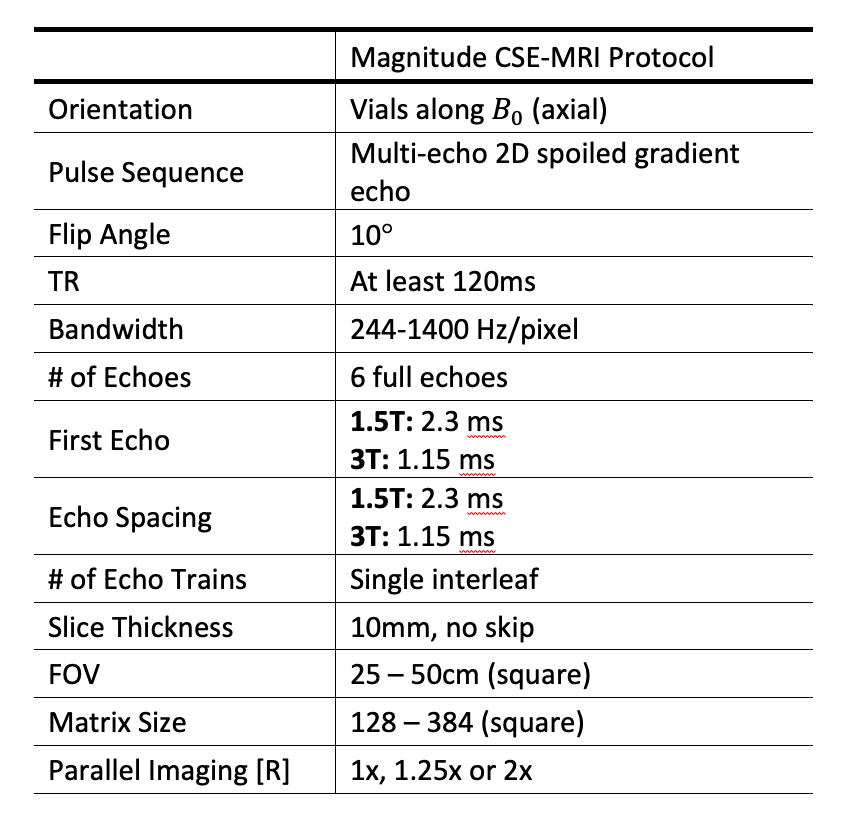
Table 1. Magnitude CSE-MRI acquisition
parameters. Guidelines were roughly adhered to for each MR system.
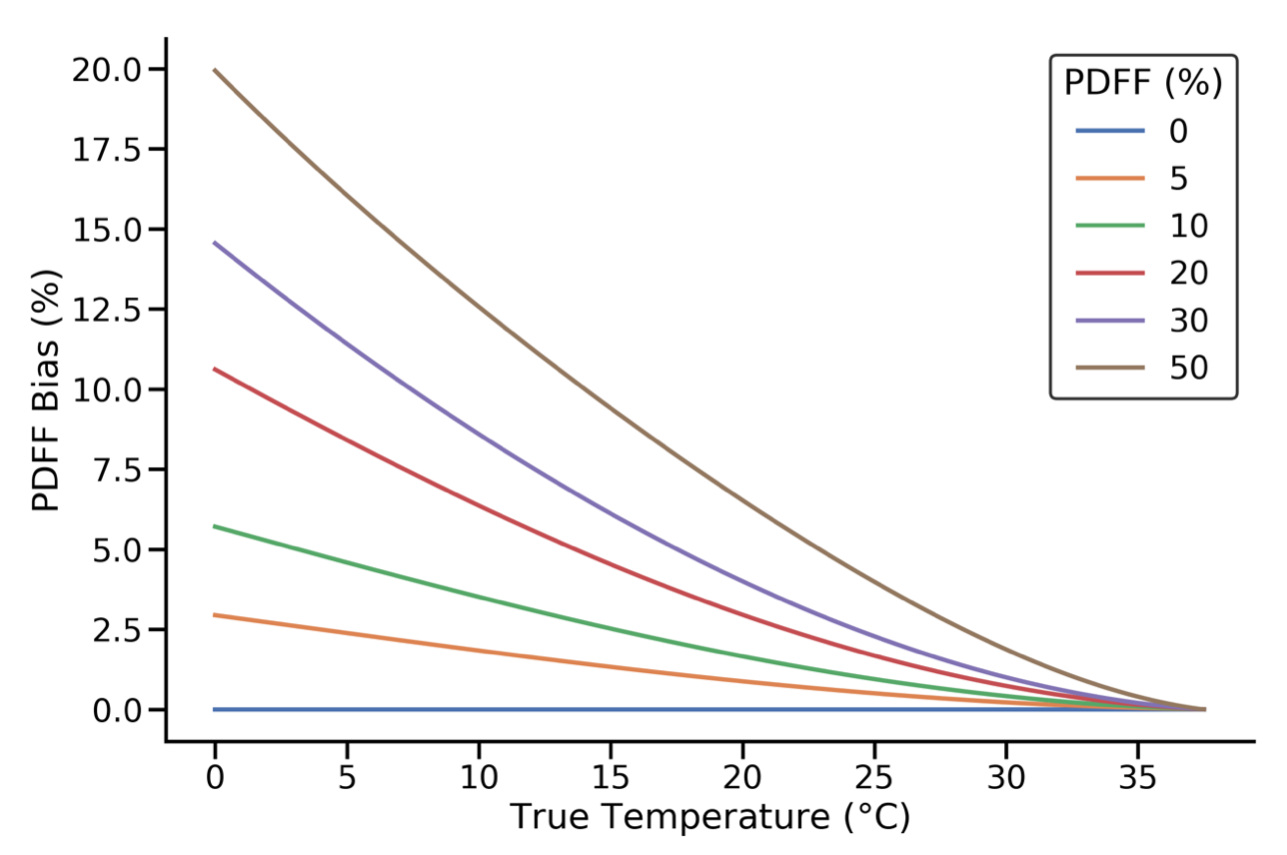
Figure 2. PDFF bias in simulations as a
function of temperature for six different true PDFF values with no temperature
correction to the signal model at 1.5T.
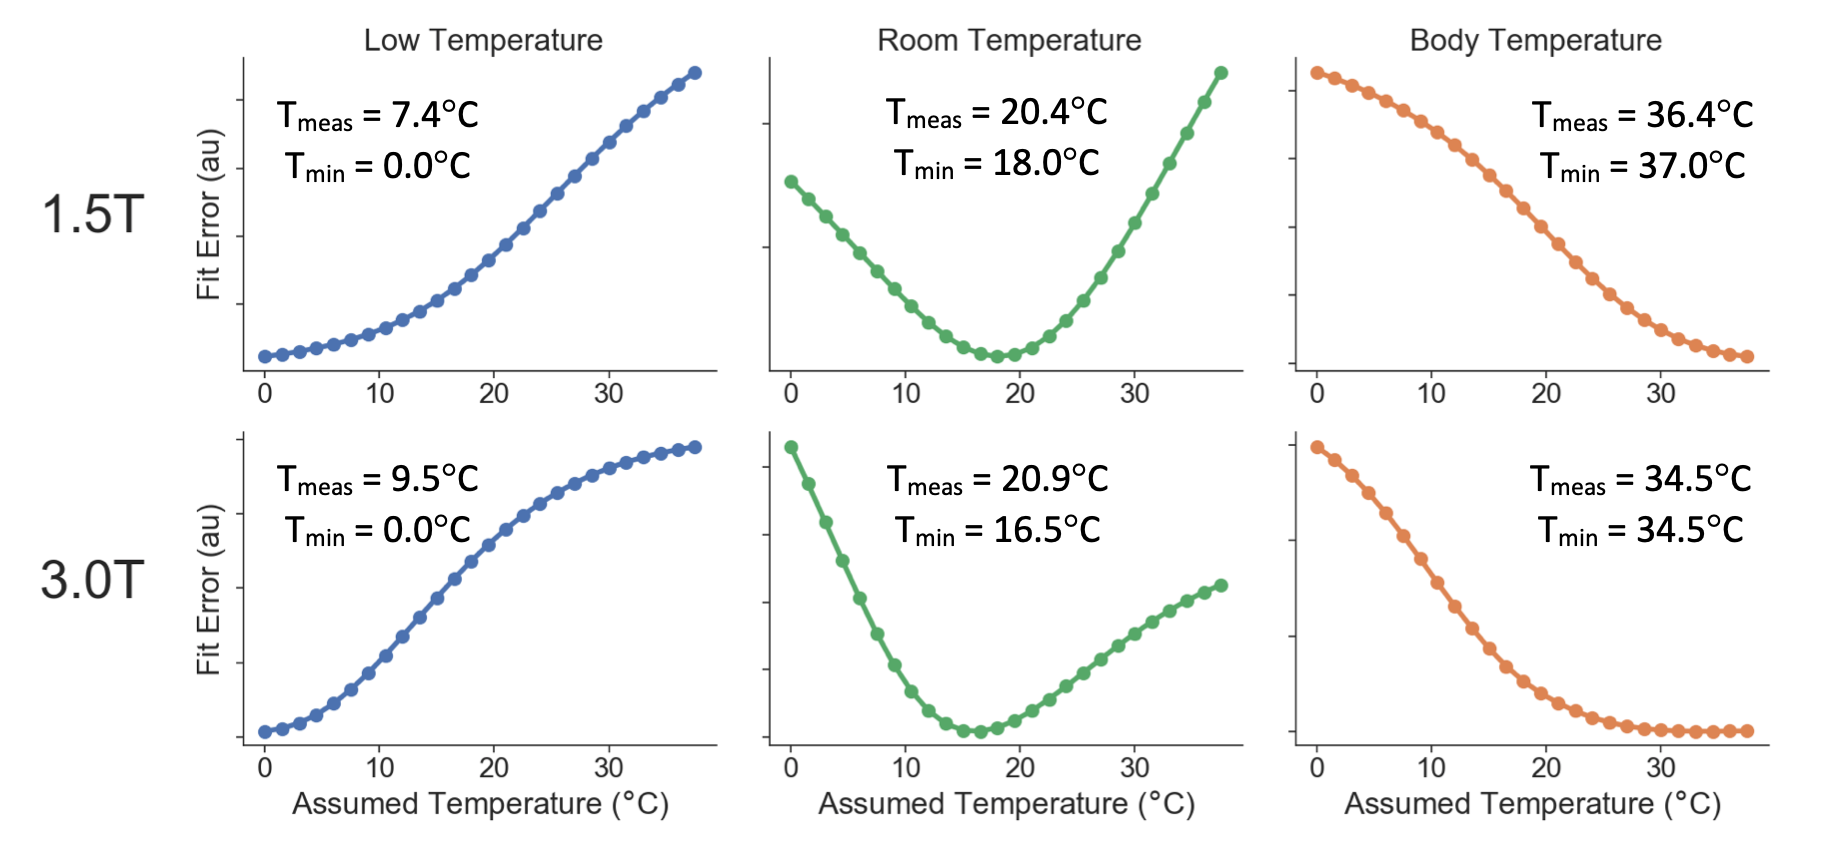
Figure 3. Global fit error
can be used to estimate the true temperature of the vials. Fit error is shown in
temperature-controlled experiments using two different field strengths (1.5T
and 3T) at three different phantom temperatures (approximately 2°C, 21°C, 37.0°C). Measured phantom surface
temperature, Tmeas, (which may be slightly different from the actual
phantom vial temperatures due to the thermal insulation of the phantom fill
solution) and temperature at minimum fit error, Tmin are shown.

Figure 4. a) Apparent vs. true PDFF in one
example phantom acquisition. Least squares fitting is used to estimate the
slope, m. The corrected signal model reduces the
difference in slope: true m (1.0) – estimated m. b) Slope difference for all
QIBA study acquisitions (at room temperature) taken using a
temperature-uncorrected and corrected signal model. The corrected
model significantly reduces slope difference (p = 0.001). The two
outliers (bottom left, b) in the uncorrected model had different echo times (TEinit = 1.66ms, ΔTE = 2.3ms), that are known to
affect PDFF bias.2