1008
Multi-Site, Multi-Vendor Validation of the Accuracy and Reproducibility of Fat Quantification using a Novel MRI and CT Compatible Fat Phantom1Radiology, University of Wisconsin-Madison, Madison, WI, United States, 2Medical Physics, University of Wisconsin-Madison, Madison, WI, United States, 3Biomedical Engineering, University of Wisconsin-Madison, Madison, WI, United States, 4Human Oncology, University of Wisconsin-Madison, Madison, WI, United States, 5Radiology, John Hopkins University, Baltimore, MD, United States, 6Radiology, Duke University, Durham, NC, United States, 7Center for Advanced Magnetic Resonance Development, Duke University, Durham, NC, United States, 8Medicine, Duke University, Durham, NC, United States, 9Radiology, University of Texas Southwestern, Dallas, TX, United States, 10Medicine, University of Wisconsin-Madison, Madison, WI, United States, 11Emergency Medicine, University of Wisconsin-Madison, Madison, WI, United States
Synopsis
Accurate quantification of liver fat content is needed for early detection, staging, and treatment monitoring of non-alcoholic fatty liver disease. Chemical shift encoded MRI techniques enable accurate fat quantification though proton density fat fraction maps. CT is capable of quantifying fat based on the decrease in attenuation with increasing liver fat concentration. Current MR quantitative fat phantoms do not accurately mimic CT-based attenuation in the presence of liver fat. Therefore, the purpose of this work was to develop and validate the performance of a novel multimodality phantom that mimics the signals of liver fat in both MRI and CT.
Introduction
Abnormal accumulation of intracellular triglycerides1 is the hallmark feature of non-alcoholic fatty liver disease (NAFLD), which causes liver diseases and contributes to cardiovascular disease2. About three million Americans will develop cirrhosis due to NAFLD by 20303. Thus, non-invasive and accurate quantification of liver fat is needed for the detection and treatment monitoring of NAFLD.MR-based chemical shift encoded (CSE) techniques enable accurate and reproducible fat quantification through measurement of proton density fat fraction (PDFF)1,4,5. However, the availability of MRI remains limited compared to X-ray computed tomography (CT). Previous studies showed that an increase in the liver fat concentration is quantitatively related to the reduction of CT number6–9. Thus, there is interest in using CT for the detection of NAFLD.
Quantitative MRI fat phantoms have been used in the validation of fat quantification for MRI. However, these phantoms do not accurately represent the x-ray attenuation properties of fatty liver when evaluated with CT. For these reasons, there is an unmet and urgent need to develop quantitative fat phantoms which can be used with both MR and CT.
The overall purpose of this work was to develop a MR and CT compatible phantom which mimics the signal behavior of fatty liver in both modalities. A multi-site, multi-modality, multi-vendor validation for the proposed phantom was performed to test the accuracy and reproducibility of fat quantification.
Methods
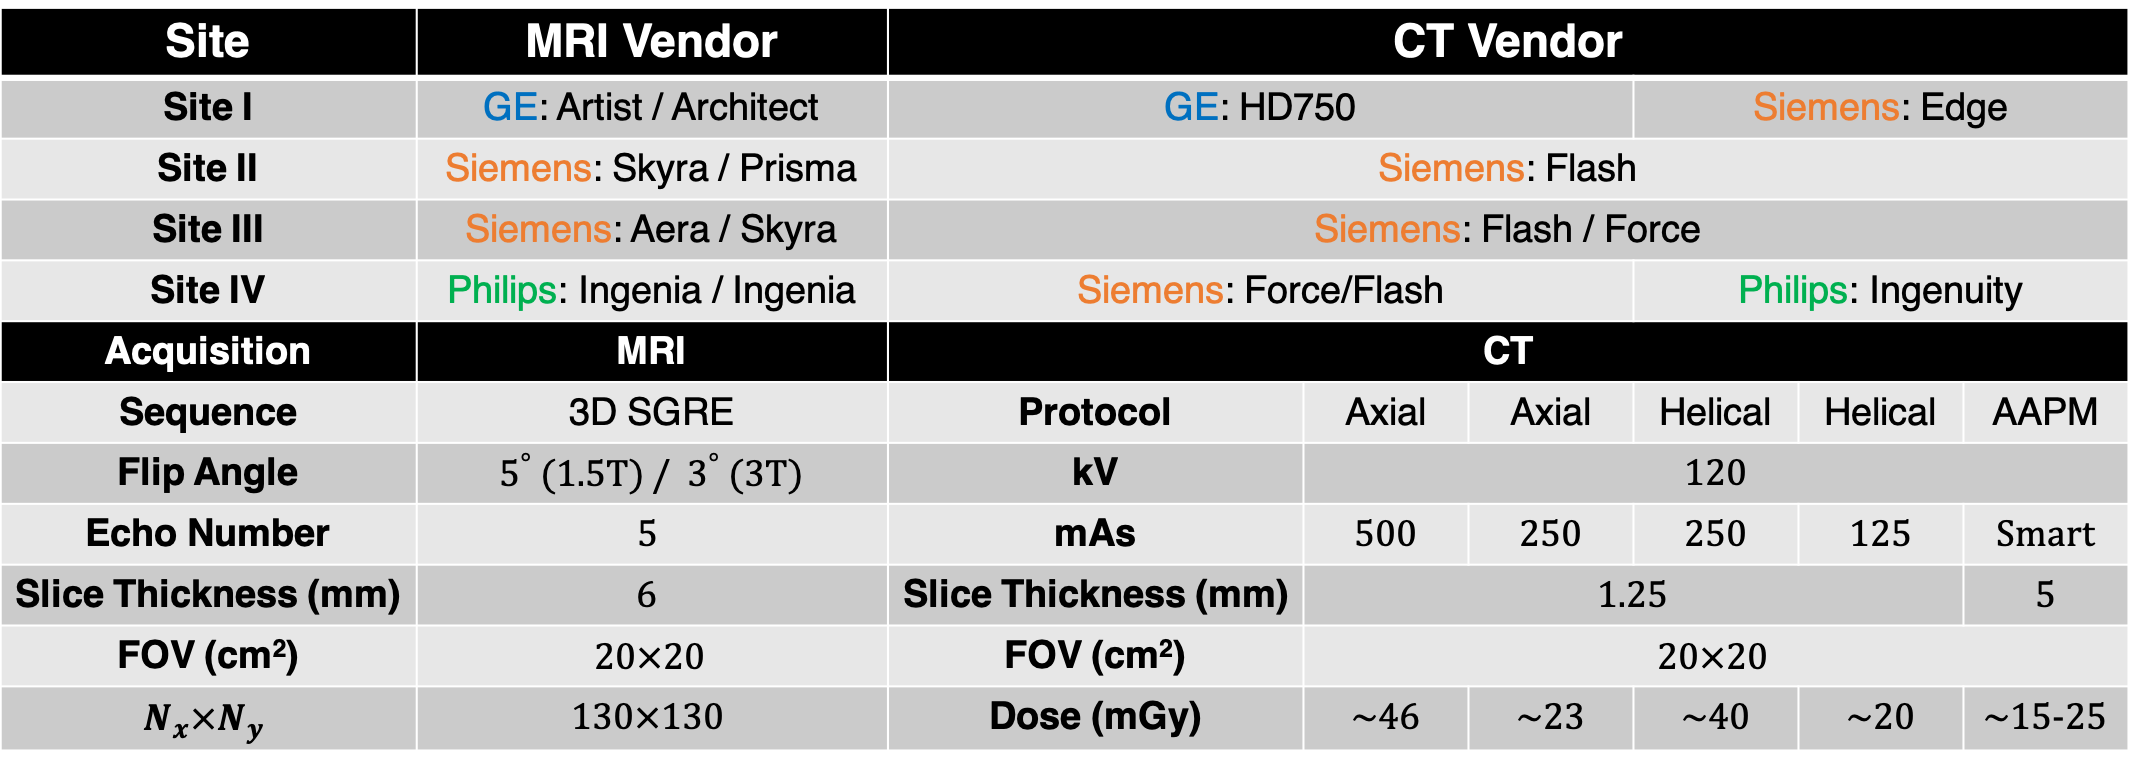
Phantom construction: A MR and CT compatible fat phantom was built by mixing peanut oil (to mimic liver triglycerides) with an agar-based emulsion (deionized water with agar, sodium dodecyl sulfate, and sodium benzoate (Sigma-Aldrich, St. Louis, MO)). The oil-emulsion volume ratio was designed and adjusted to obtain 12 different PDFF levels (0%, 2.5%, 5%, 7.5%, 10%, 15%, 20%, 25%, 30%, 40%, 50%, and 100%). The mixture was adjusted to mimic the CT attenuation of liver by infusing a small amount of iodinated contrast agent (7.3µL Omnipaque per 1 mL of oil-emulsion mixture). The concentration of iodine agent was selected to recreate the 65.9 HU of 0% fat fraction liver8. Vials were enclosed in a custom designed spherical housing filled with water to mimic the X-ray attenuation environment.Data acquisition and analysis: Multi-site, multi-vendor validation was performed using the proposed phantom. This study included four sites (Site I, Site II, Site III, and Site IV), two modalities (MRI and CT), and three vendors (GE, Siemens, and Philips). Detailed information is summarized in Table 1.
MRI: Multi-echo 3D spoiled gradient echo (SGRE) MRI data were collected at both 1.5T and 3T at each site and for each vendor, using product CSE-MRI methods. For each acquisition, MRI-PDFF maps were obtained from the vendor reconstruction. Acquisition parameters were included in Table 1.
CT: Five different abdominal CT protocols were performed with standard 120 kV but with different dose level (Axial High: 500 mAs; Axial Low: 250 mAs; Helical High: 250 mAs; Helical Low: 125 mAs; AAPM abdomen standard protocol10). The Helical High Dose (250 mAs) protocol was chosen as the reference CT acquisition. For each acquisition, CT-attenuation images were obtained from the vendor reconstruction. Acquisition parameters were included in Table 1.
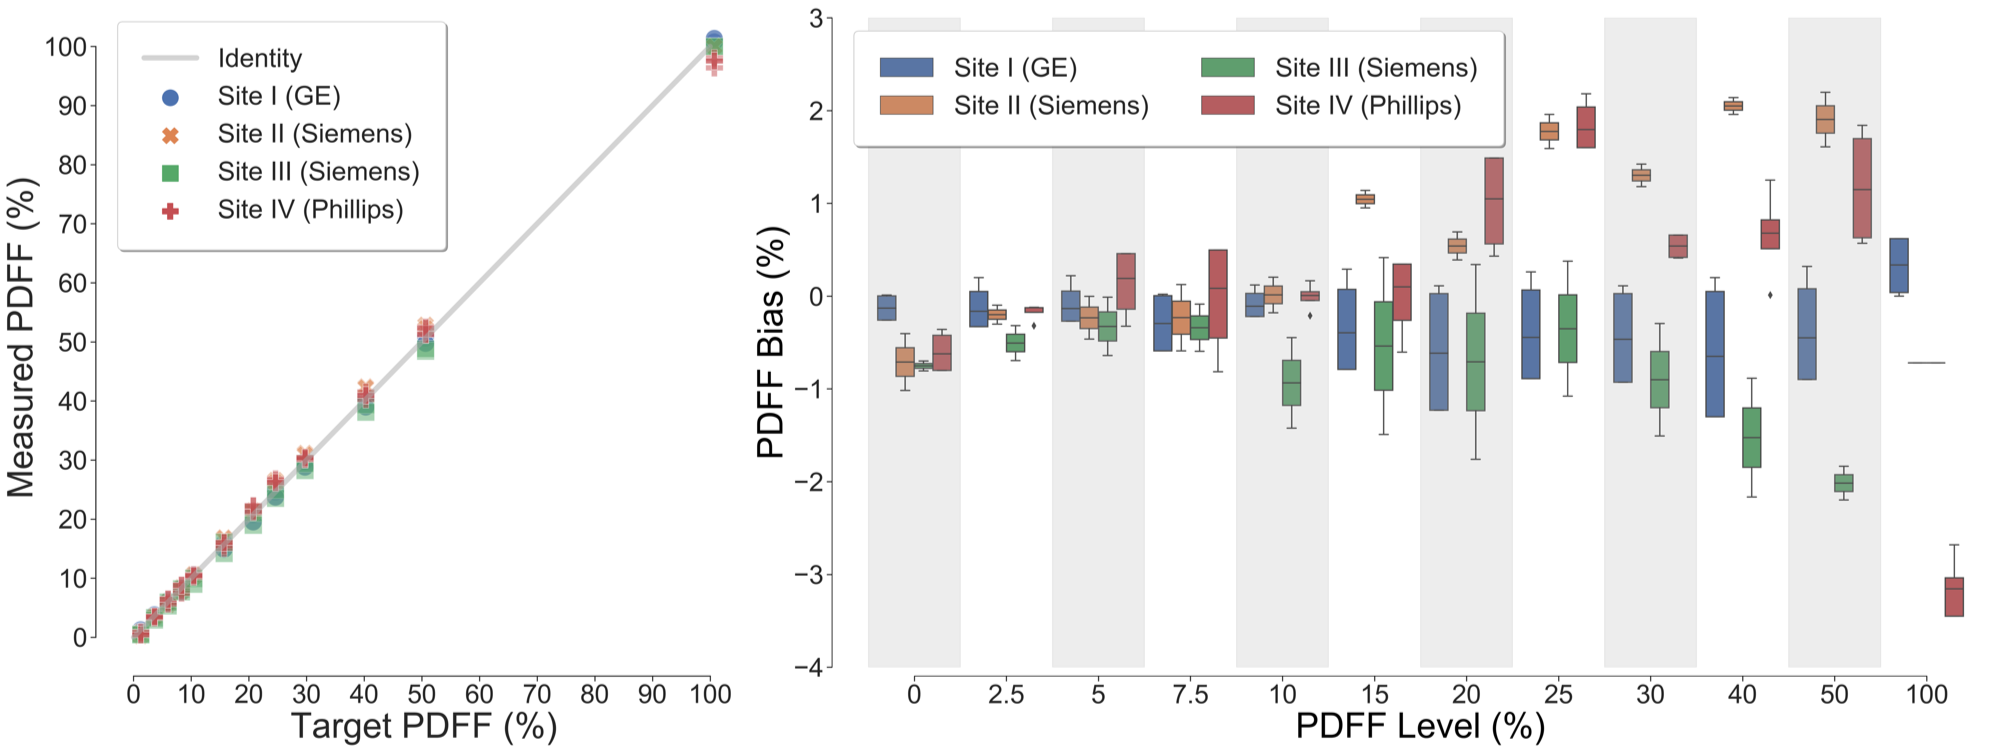
Data analysis: A 1.5 cm2 region of interest (ROI) was placed in the isocenter of each vial for both MRI PDFF image and CT attenuation image to obtain mean estimates of PDFF and CT number. Linear regression analysis was performed to study the relationship between MRI-PDFF and nominal PDFF, as well as CT number versus MRI-PDFF. PDFF bias analysis was performed by calculating the difference between measured PDFF and nominal PDFF across varying PDFF levels. CT number bias was performed by calculating the difference between measured CT number and in vivo fit across different PDFF levels. All data and statistical analysis were implemented with MATLAB (MathWorks, Natick, MA) and Python.
Results
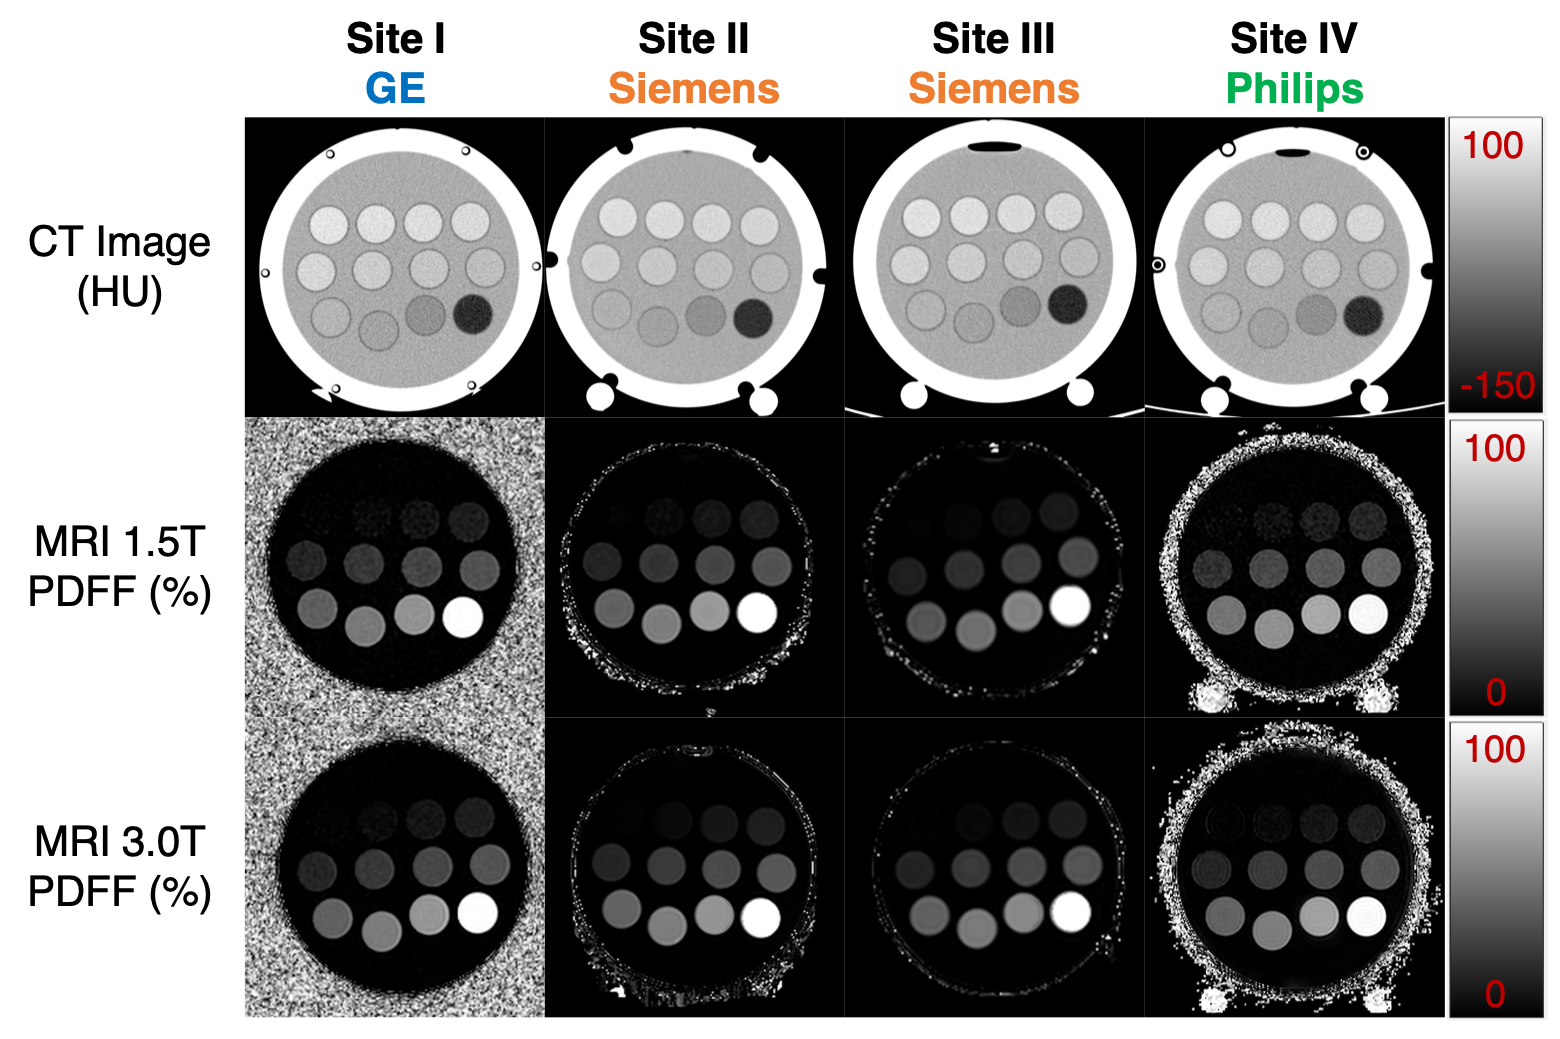
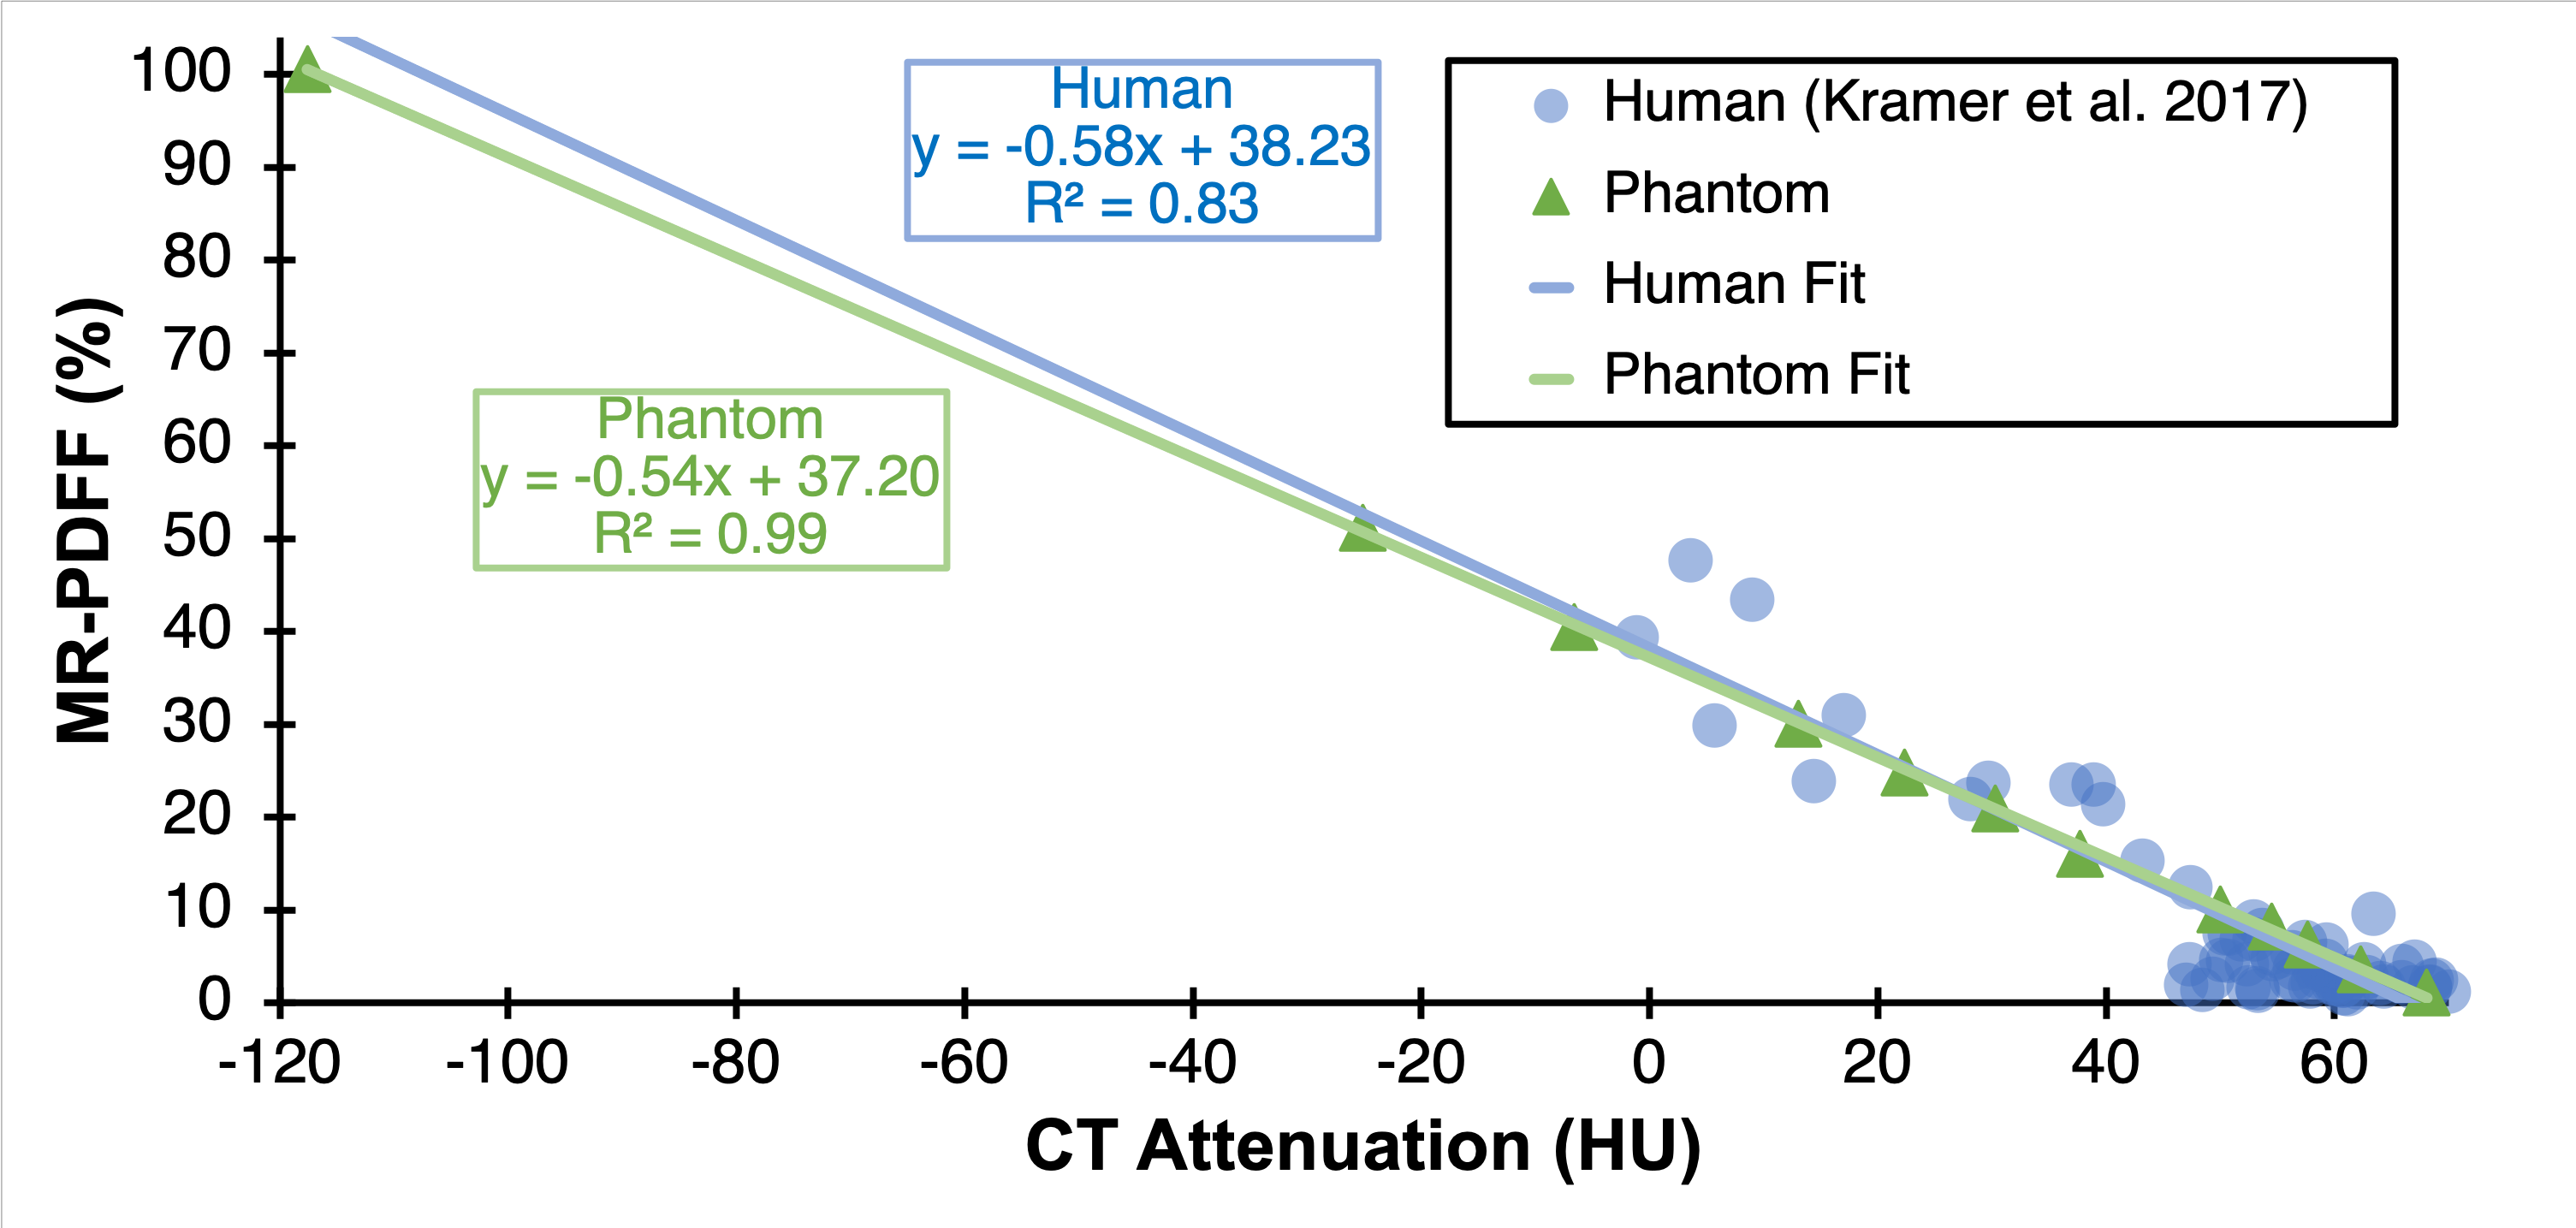
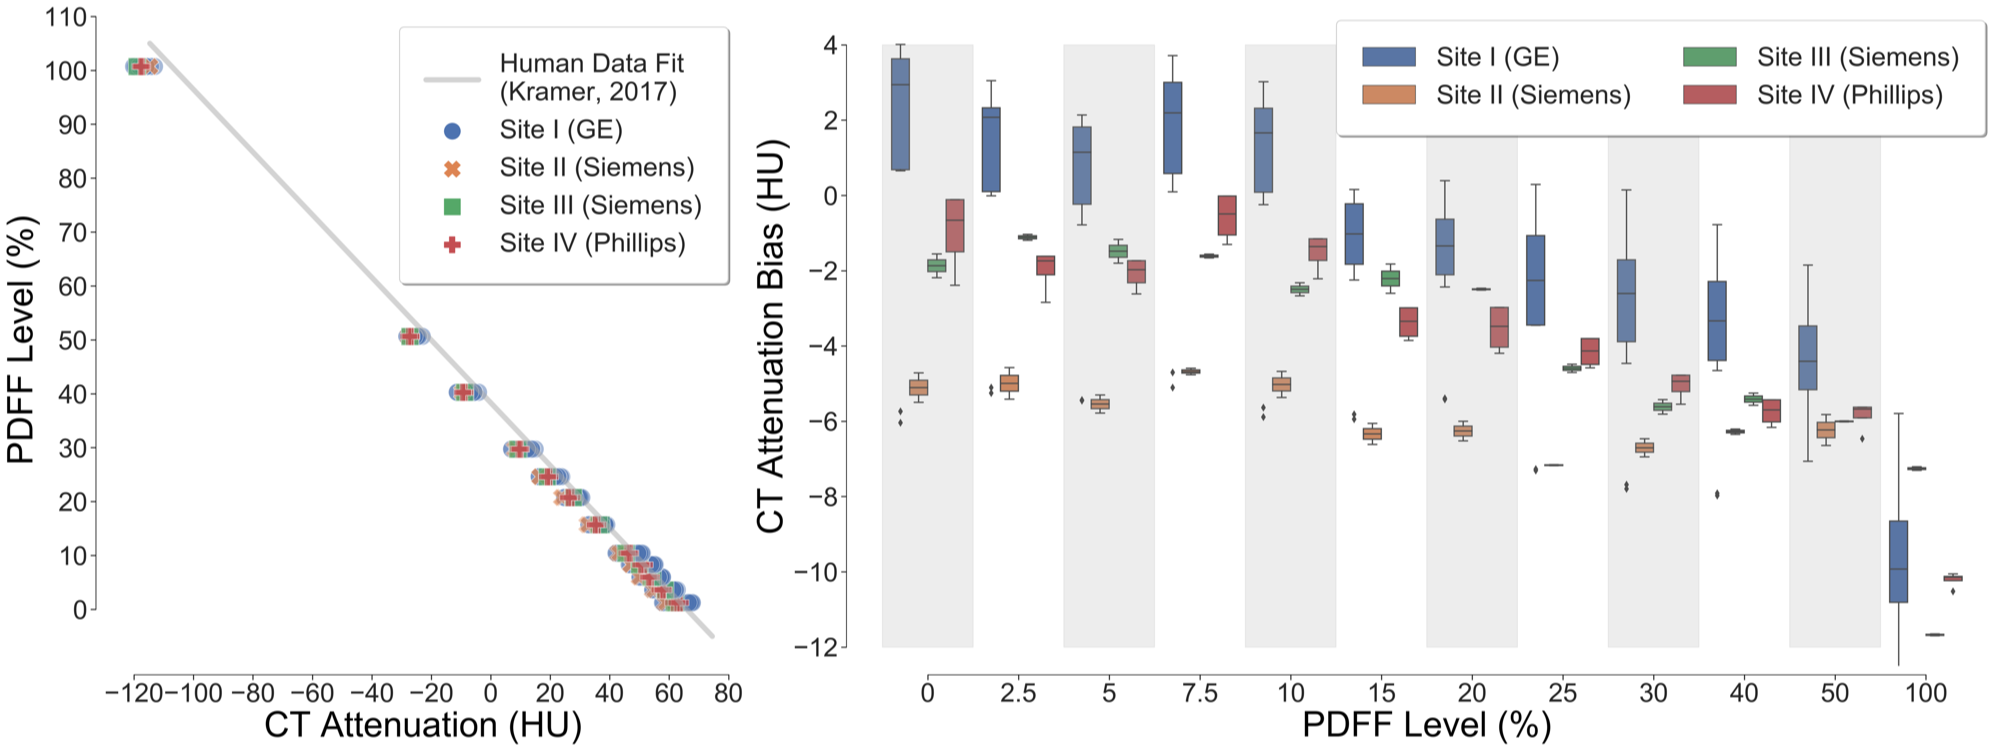
Figure 1 depicts representative CT-attenuation images (Helical High Dose) and MRI-PDFF maps from the four sites with three different vendors. Excellent image quality was achieved for both MRI and CT across all sites, scanners and vendors. Figure 2 shows an excellent agreement (R2>0.98) between measured PDFF and nominal PDFF across different sites and vendors. A small bias (-4% to 2%) was observed between sites (vendors). As shown in Figure 3, high correlation (slope=-0.54, intercept=37.20, R2=0.99) was observed between CT number and MRI-PDFF from the proposed phantom. The phantom measurements closely replicated the CT attenuation data from the in vivo data (slope=-0.58, intercept=38.23, R2=0.83)11. Excellent correlation was observed between CT number and MRI-PDFF from different sites (vendors) in Figure 4. However, the CT number bias showed dependence on vendors and scanner platforms.Discussion
In this work, we developed and validated a novel MR and CT compatible phantom that accurately mimics liver fat signals for both imaging modalities. Validation was performed in a multi-site, multi-vendor study. Robust recreation of liver fat biomarkers and reproducibility across sites and vendors was achieved for fat quantification with both MRI and CT. The proposed fat phantom may enable wide reproducible application of liver fat quantification techniques using MRI as well as CT across institutions and vendors. Further, this phantom would enable the calibration of various CT systems to provide a one-to-one correspondence of CT number with MRI-PDFF.Acknowledgements
The authors wish to acknowledge support from the NIH (R41-EB025729), as well as the State of Wisconsin and Discovery to Product SEED program. The authors also acknowledge GE Healthcare who provides research support to the University of Wisconsin-Madison and Duke University, Siemens Healthcare who provides research support to the University of Wisconsin-Madison, the John Hopkins University, Duke University, and the University of Texas-Southwestern, Phillips Healthcare who provides research support to the University of Texas-Southwestern. We also thank Calimetrix for helpful discussions.References
1.Reeder SB, Sirlin C. Quantification of Liver Fat with Magnetic Resonance Imaging. Magn Reson Imaging Clin N Am. 2010;18(3):337-357. doi:10.1016/j.mric.2010.08.013
2.Targher G, Day CP, Bonora E. Risk of Cardiovascular Disease in Patients with Nonalcoholic Fatty Liver Disease. N Engl J Med. 2010;363(14):1341-1350. doi:10.1056/NEJMra0912063
3.Rinella ME. Nonalcoholic Fatty Liver Disease: A Systematic Review. JAMA. 2015;313(22):2263-2273. doi:10.1001/jama.2015.5370
4.Reeder SB, Hu HH, Sirlin CB. Proton Density Fat-Fraction: A Standardized MR-Based Biomarker of Tissue Fat Concentration. J Magn Reson Imaging JMRI. 2012;36(5):1011-1014. doi:10.1002/jmri.23741
5.Yokoo T, Serai SD, Pirasteh A, et al. Linearity, Bias, and Precision of Hepatic Proton Density Fat Fraction Measurements by Using MR Imaging: A Meta-Analysis. Radiology. 2018;286(2):486-498. doi:10.1148/radiol.2017170550
6.Puchner SB, Lu MT, Mayrhofer T, et al. High-Risk Coronary Plaque at Coronary CT Angiography Is Associated with Nonalcoholic Fatty Liver Disease, Independent of Coronary Plaque and Stenosis Burden: Results from the ROMICAT II Trial. Radiology. 2015;274(3):693-701. doi:10.1148/radiol.14140933
7.Hahn L, Reeder SB, del Rio AM, Pickhardt PJ. Longitudinal Changes in Liver Fat Content in Asymptomatic Adults: Hepatic Attenuation on Unenhanced CT as an Imaging Biomarker for Steatosis. Am J Roentgenol. 2015;205(6):1167-1172. doi:10.2214/AJR.15.14724
8.Kramer H, Pickhardt PJ, Kliewer MA, et al. Accuracy of Liver Fat Quantification With Advanced CT, MRI, and Ultrasound Techniques: Prospective Comparison With MR Spectroscopy. AJR Am J Roentgenol. 2017;208(1):92-100. doi:10.2214/AJR.16.16565
9. Pickhardt PJ, Hahn L, Muñoz del Rio A, Park SH, Reeder SB, Said A. Natural history of hepatic steatosis: observed outcomes for subsequent liver and cardiovascular complications. AJR Am J Roentgenol. 2014;202(4):752-758. doi:10.2214/AJR.13.11367
10.AAPM Standard Adult Abdomen/Pelvis CT Protocol
11.Pickhardt
PJ, Graffy PM, Reeder SB, Hernando D, Li K. Quantification of Liver Fat Content
With Unenhanced MDCT: Phantom and Clinical Correlation With MRI Proton Density
Fat Fraction. Am J Roentgenol. 2018;211(3):W151-W157.
doi:10.2214/AJR.17.19391
Figures