0976
Structural Analysis of Whole Mouse Brain by Magnetic Resonance Histology1Department of Radiology, Duke University, Durham, NC, United States, 2Department of Neurology, Duke University, Durham, NC, United States
Synopsis
Diffusion MRI (dMRI) encompasses a broad range of scales, physical mechanisms and models and applications from clinical to the basic sciences. The recent development of compressed sensing allowed us to extend the spatial and contrast resolution to define more subtle brain architecture beyond the meso scale, solidly in the microscopic domain. We report here dMRI at spatial resolution down to 25 μm i.e. voxels that are more 500,000 times smaller than that of the routine clinical scans.
Purpose
To explore the cytoarchitecture of the mouse brain that is revealed in the scalar dMRI images with increased spatial and contrast resolution.Introduction
MRI has been widely used to probe the structure of the mouse brain, but directly correlating MRI findings to histology is still challenging due to the limited spatial resolution and limited understanding of the various image contrasts derived from water relaxation or diffusion properties1,2. Magnetic resonance histology has the potential to become an indispensable research tool to mitigate such challenges3. Diffusion MRI (dMRI) has pushed the contrast boundary of MR histology, again driven by technical advances in gradients and novel encoding strategies4. In the present study, we used high spatial resolution MRI datasets, including diffusion MRI (dMRI) at 25 µm and quantitative susceptibility mapping (QSM) at 21.5 µm to map the contrast differences and similarities to conventional histopathology.Methods
Animal experiments were carried out in compliance with the local animal care and use committee. Five wild-type adult male C57BL/6 mice were chosen for MR imaging. Brains were perfused using a transcardial perfusion with a 1:10 mixture of ProHance-buffered formalin. MR images were acquired using a 9.4 T 8.9-cm vertical bore magnet MRI system. We used a modified three-dimensional diffusion-weighted spin-echo pulse sequence to support k-space under sampling. Acceleration factors of 4.0 (67 μm) and 5.12 (25 μm) were used to accelerate the acquisition5,6. The diffusion sampling protocol included 61 unique diffusion directions with a b-value of 4000 s/mm2 and 6 non-diffusion-weighted (b0) measurements. All the other parameters kept the same: FOV = 18.8 mm x 12.8 mm x 12.8 mm; TE = 15.2 ms; and TR =100 m. The 3D multi-echo gradient echo scans were acquired at different spatial resolution: 21.5 μm with matrix size = 1024 × 512 × 512 and 6 echoes; 43 μm with matrix size = 512 × 256 × 256 with 12 echoes; 86 μm with matrix size = 256 × 128 × 128 with 20 echoes. All the other parameters remained unchanged: FOV = 22 mm × 11 mm × 11 mm, flip angle = 65º, bandwidth (BW) = 125 kHz, and repeating time (TR) = 100 ms. The tractography of generalized Q-sampling imaging was obtained by a modified streamline tracking algorithm implemented in DSI Studio software with maximum four fibers resolved in one voxel7.Results
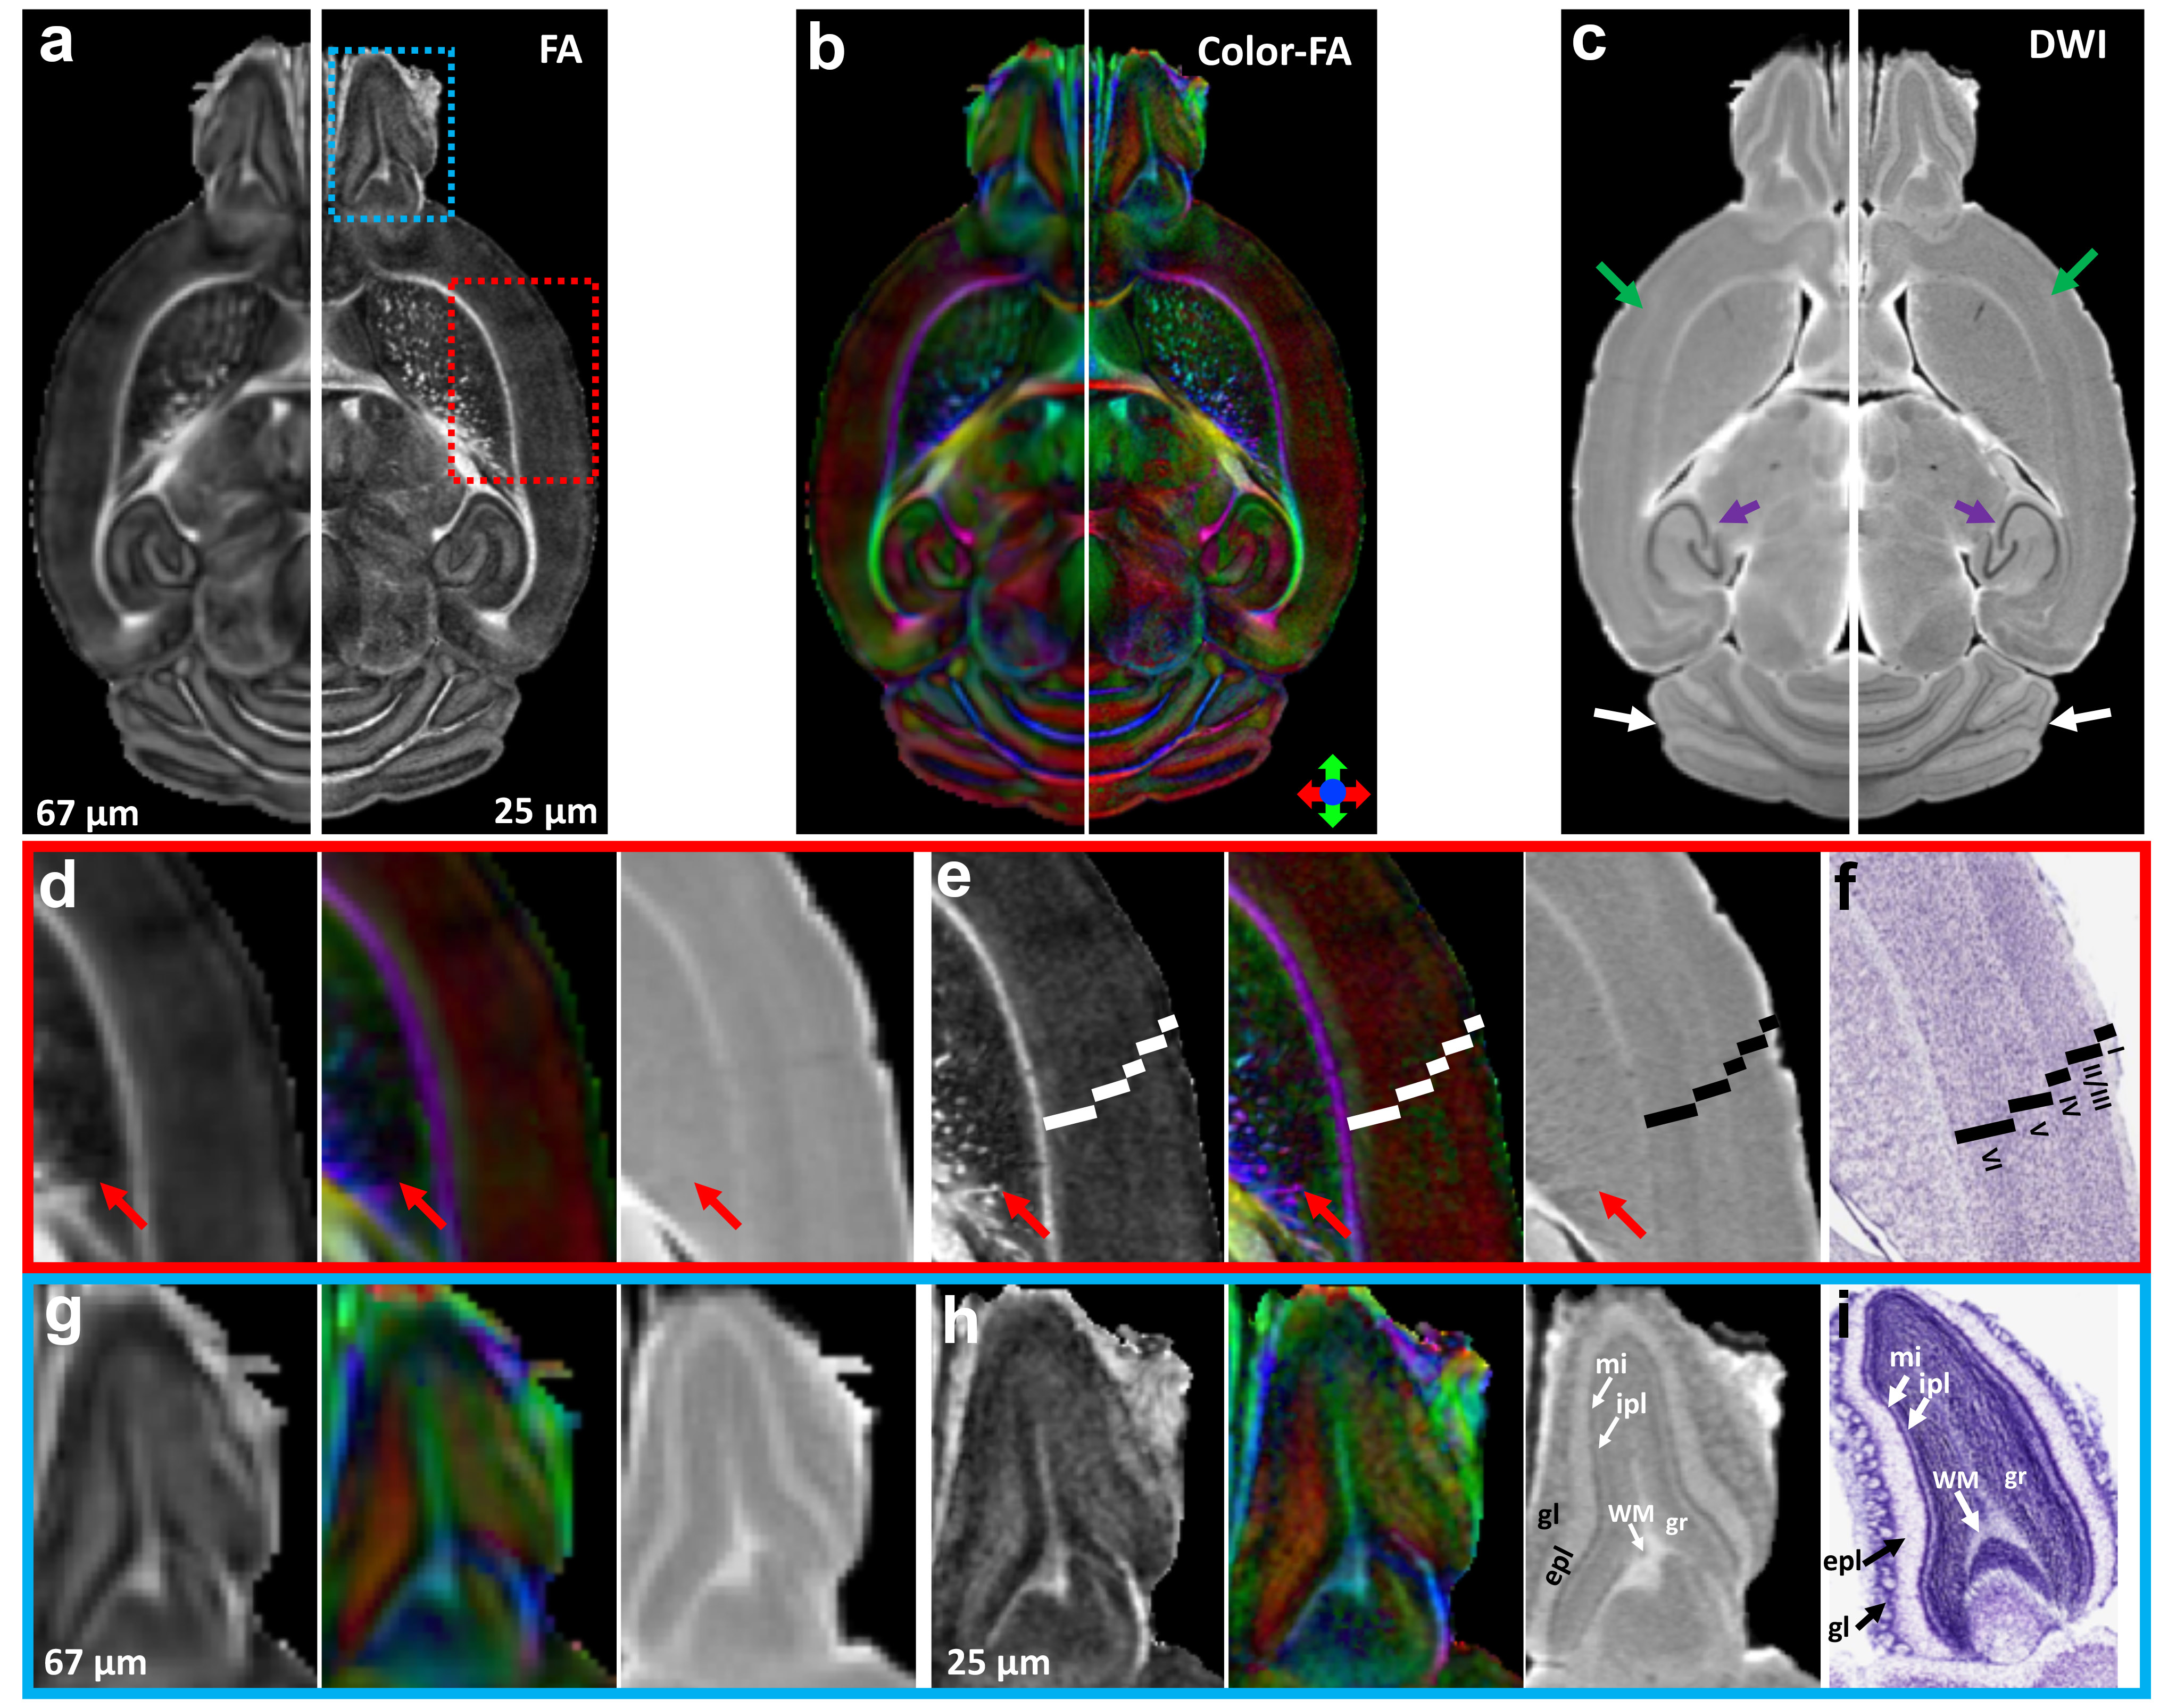
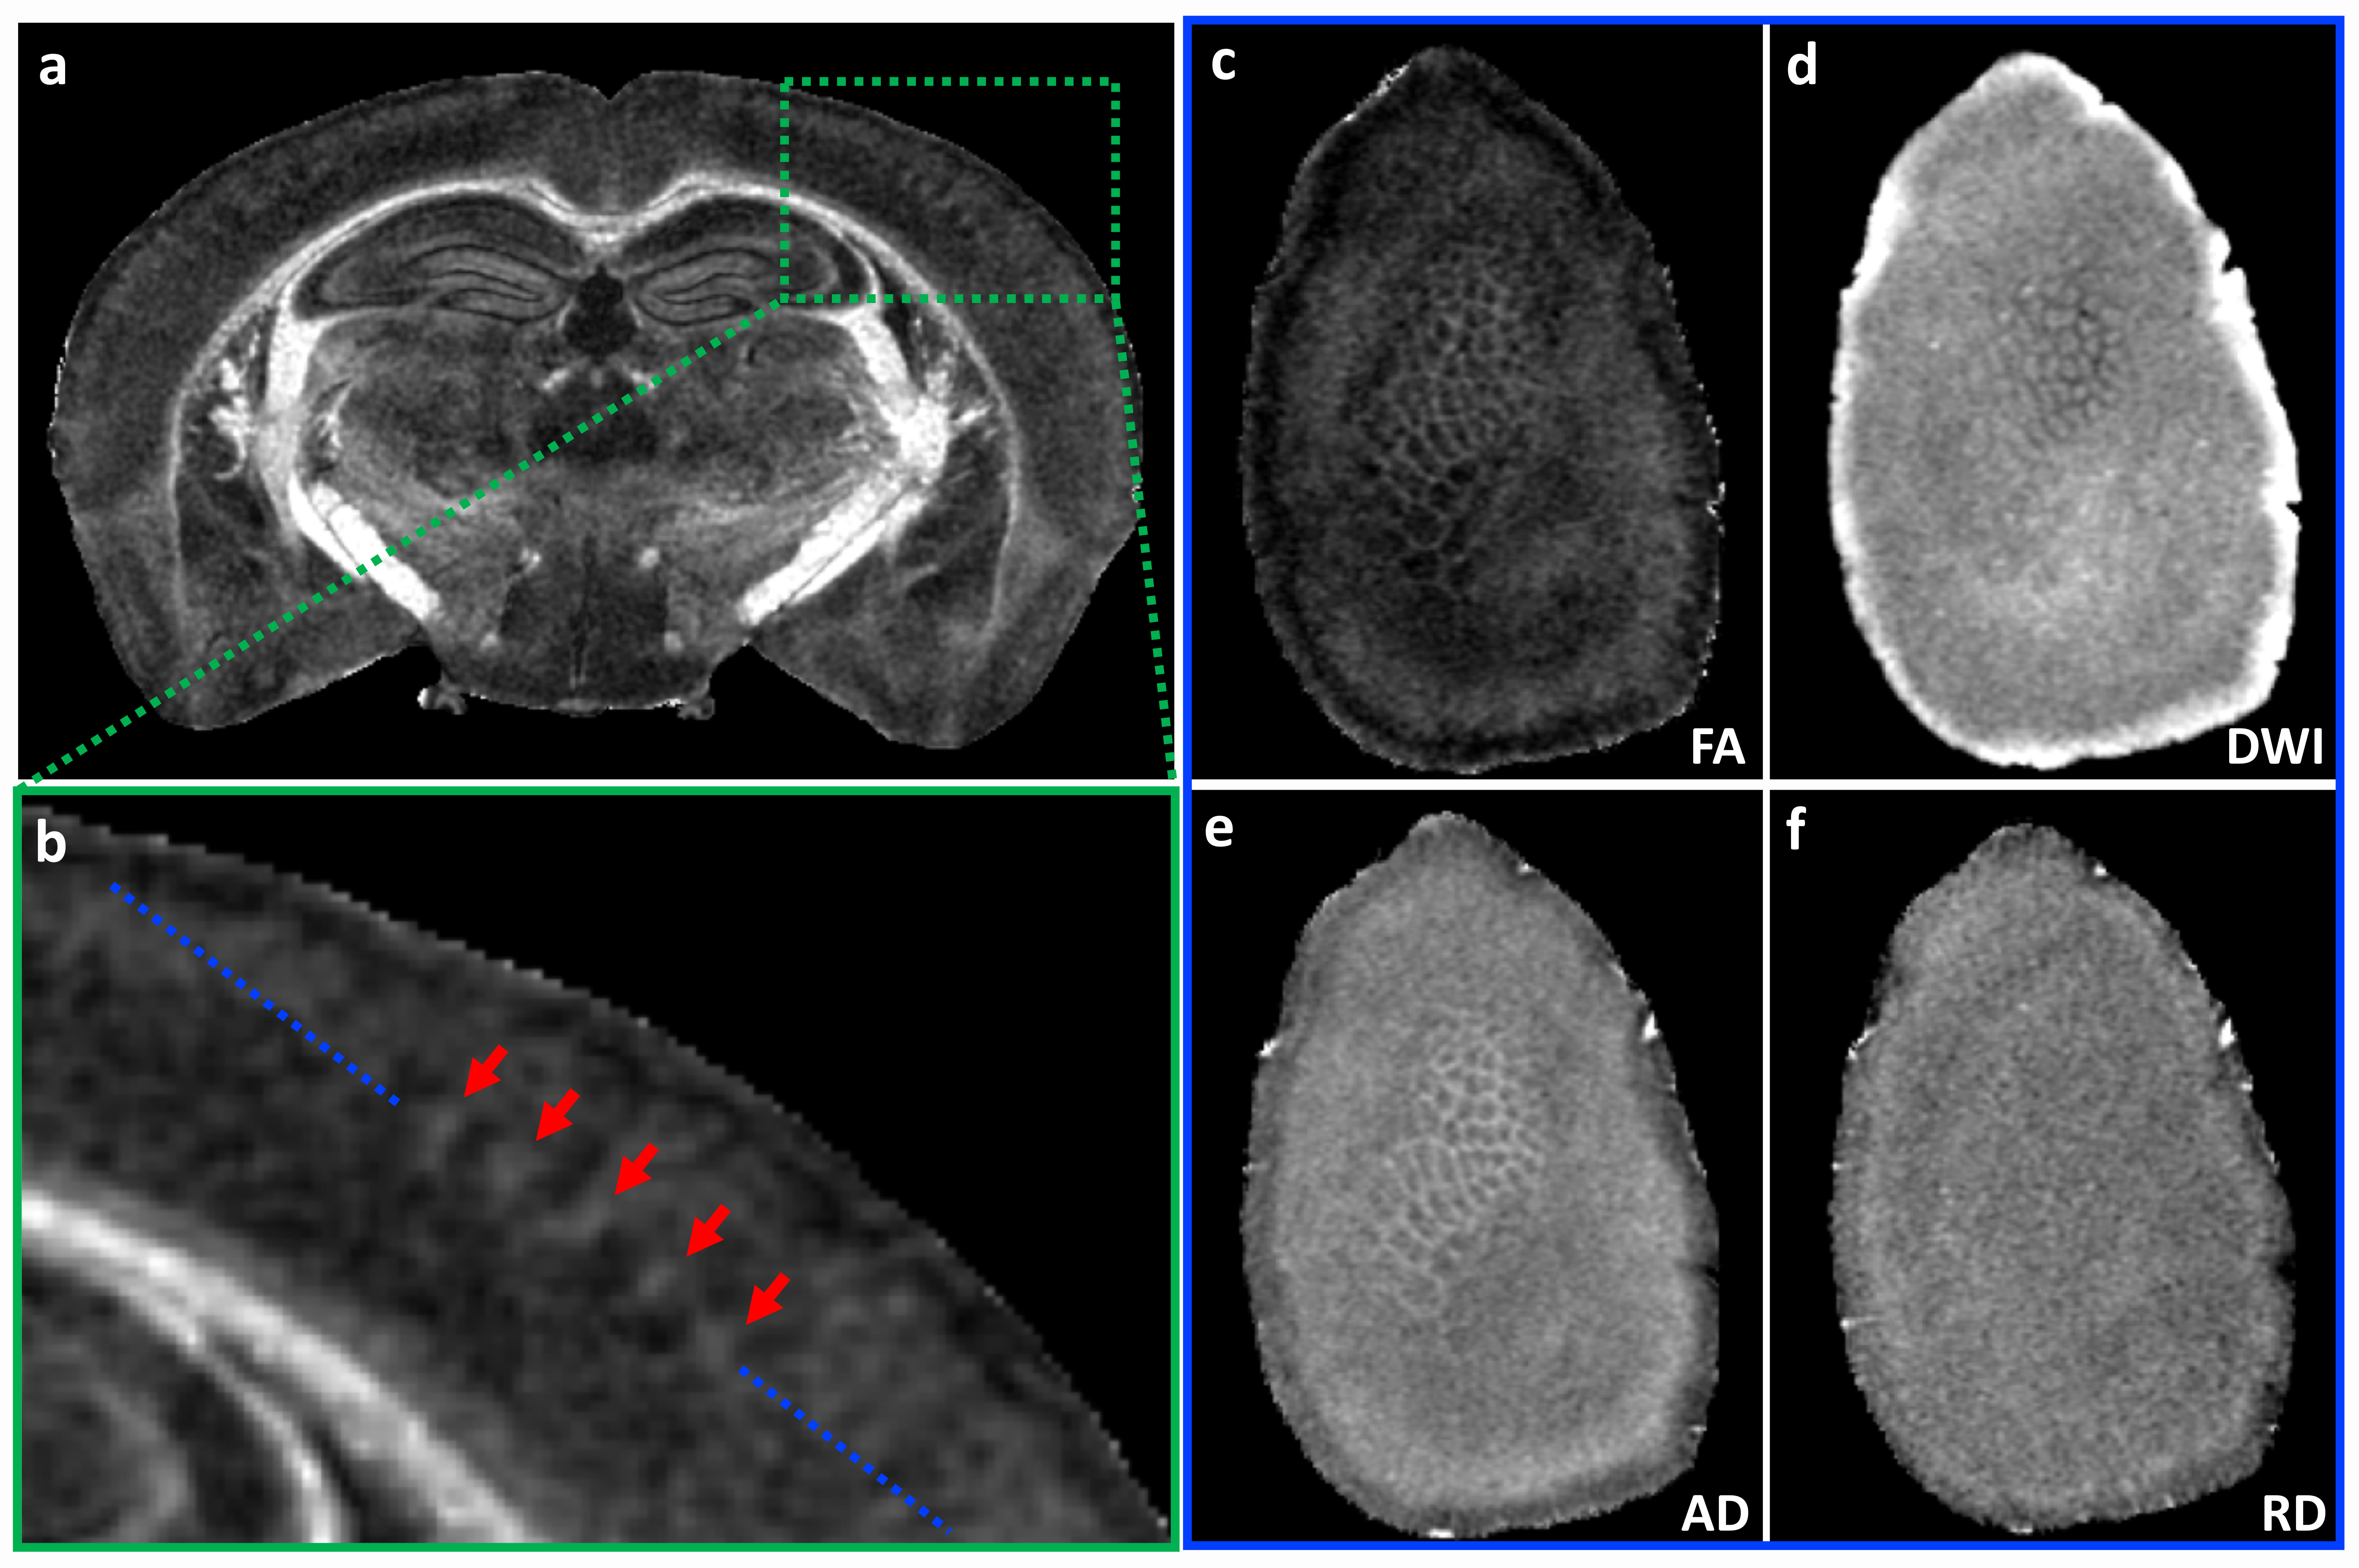
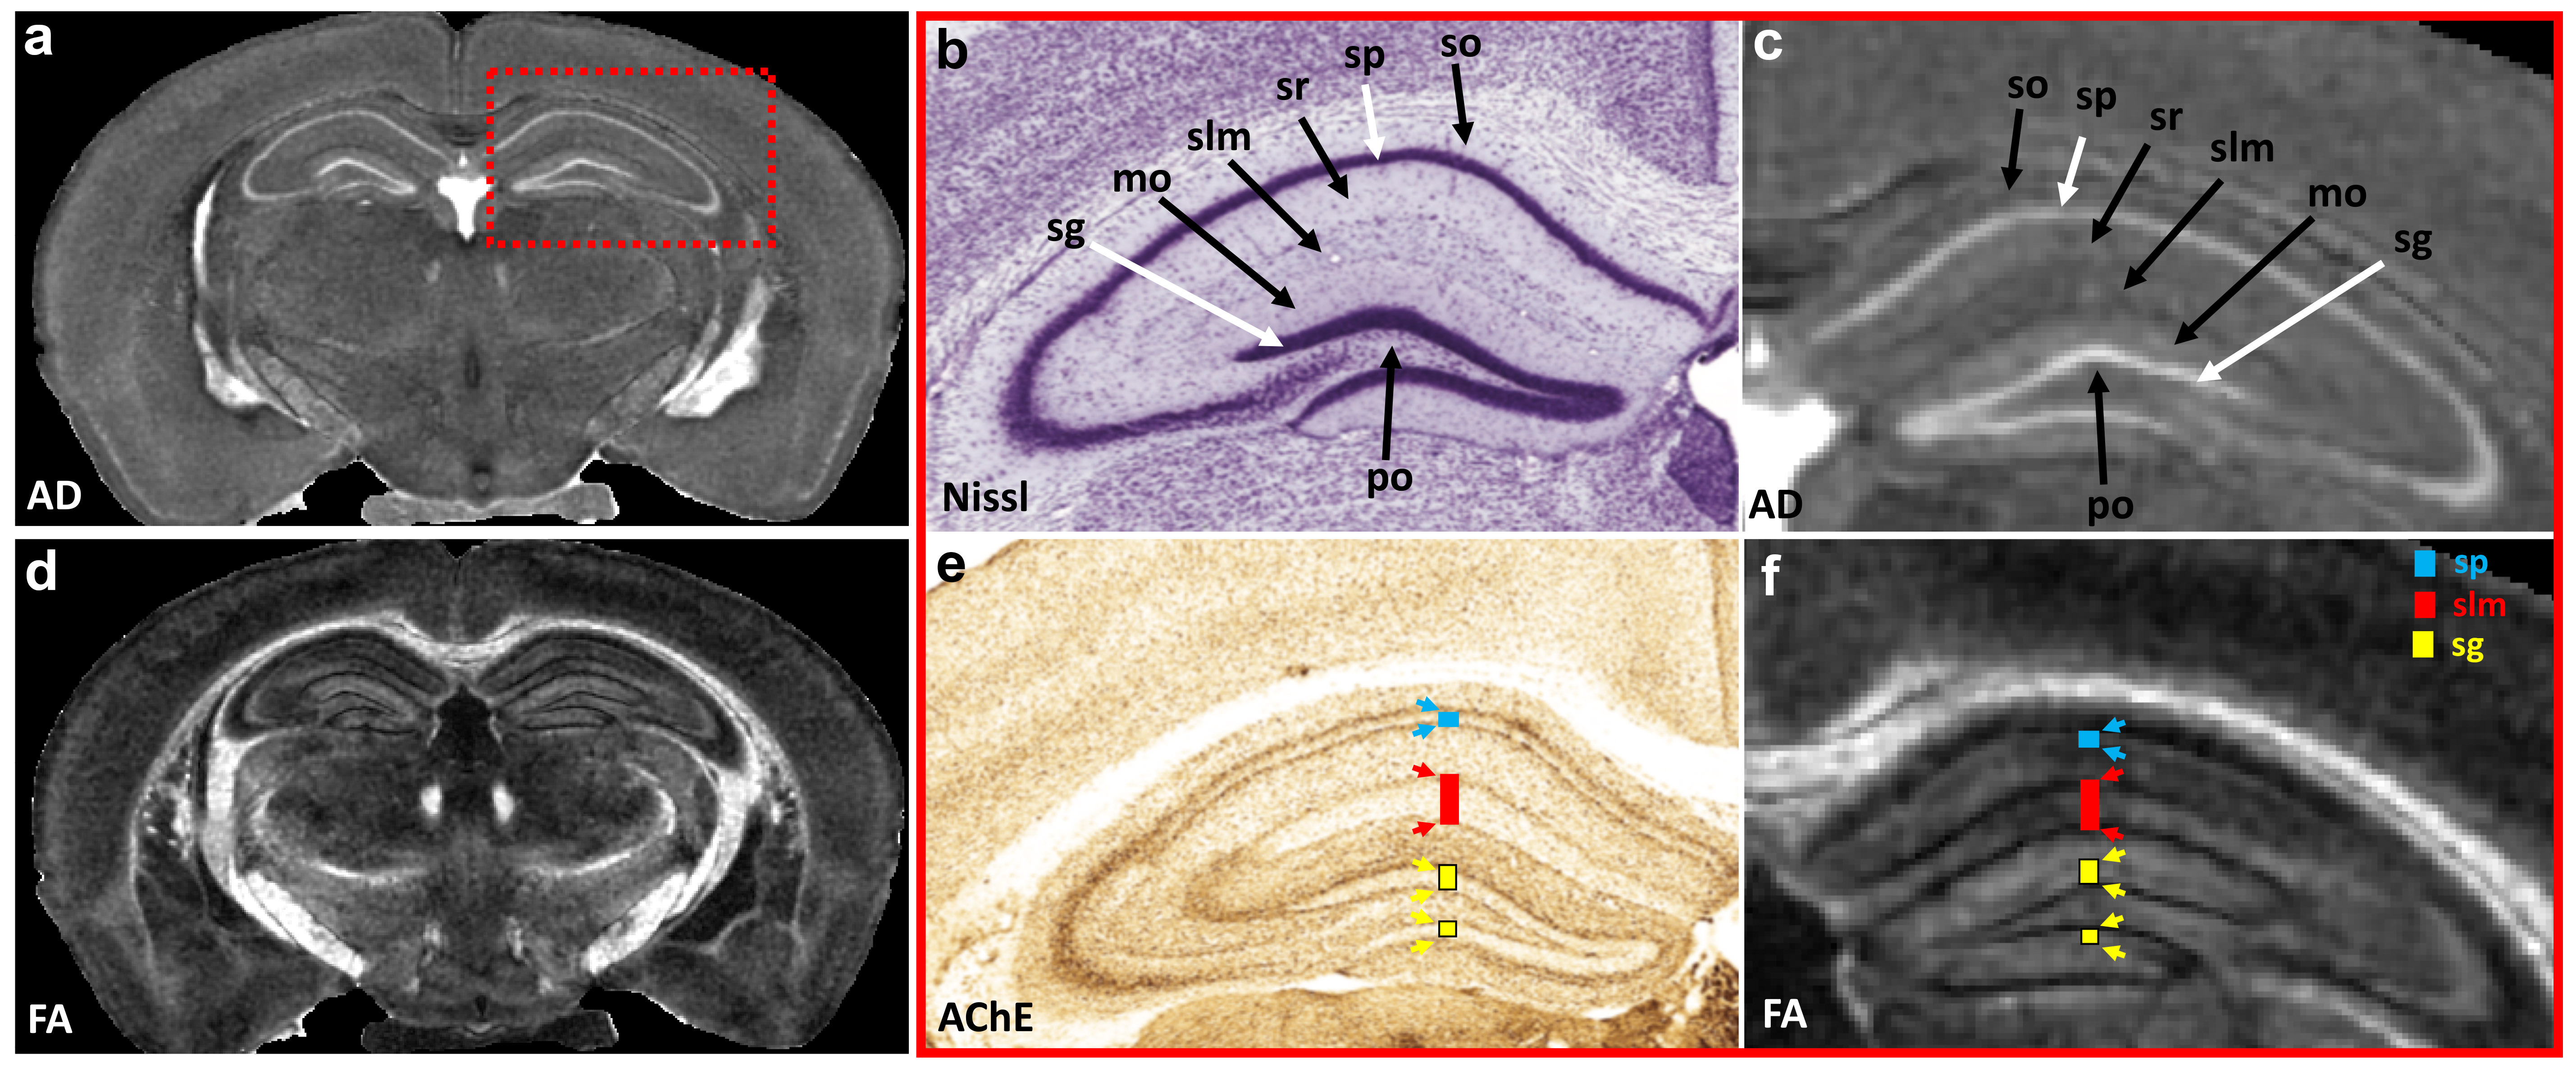
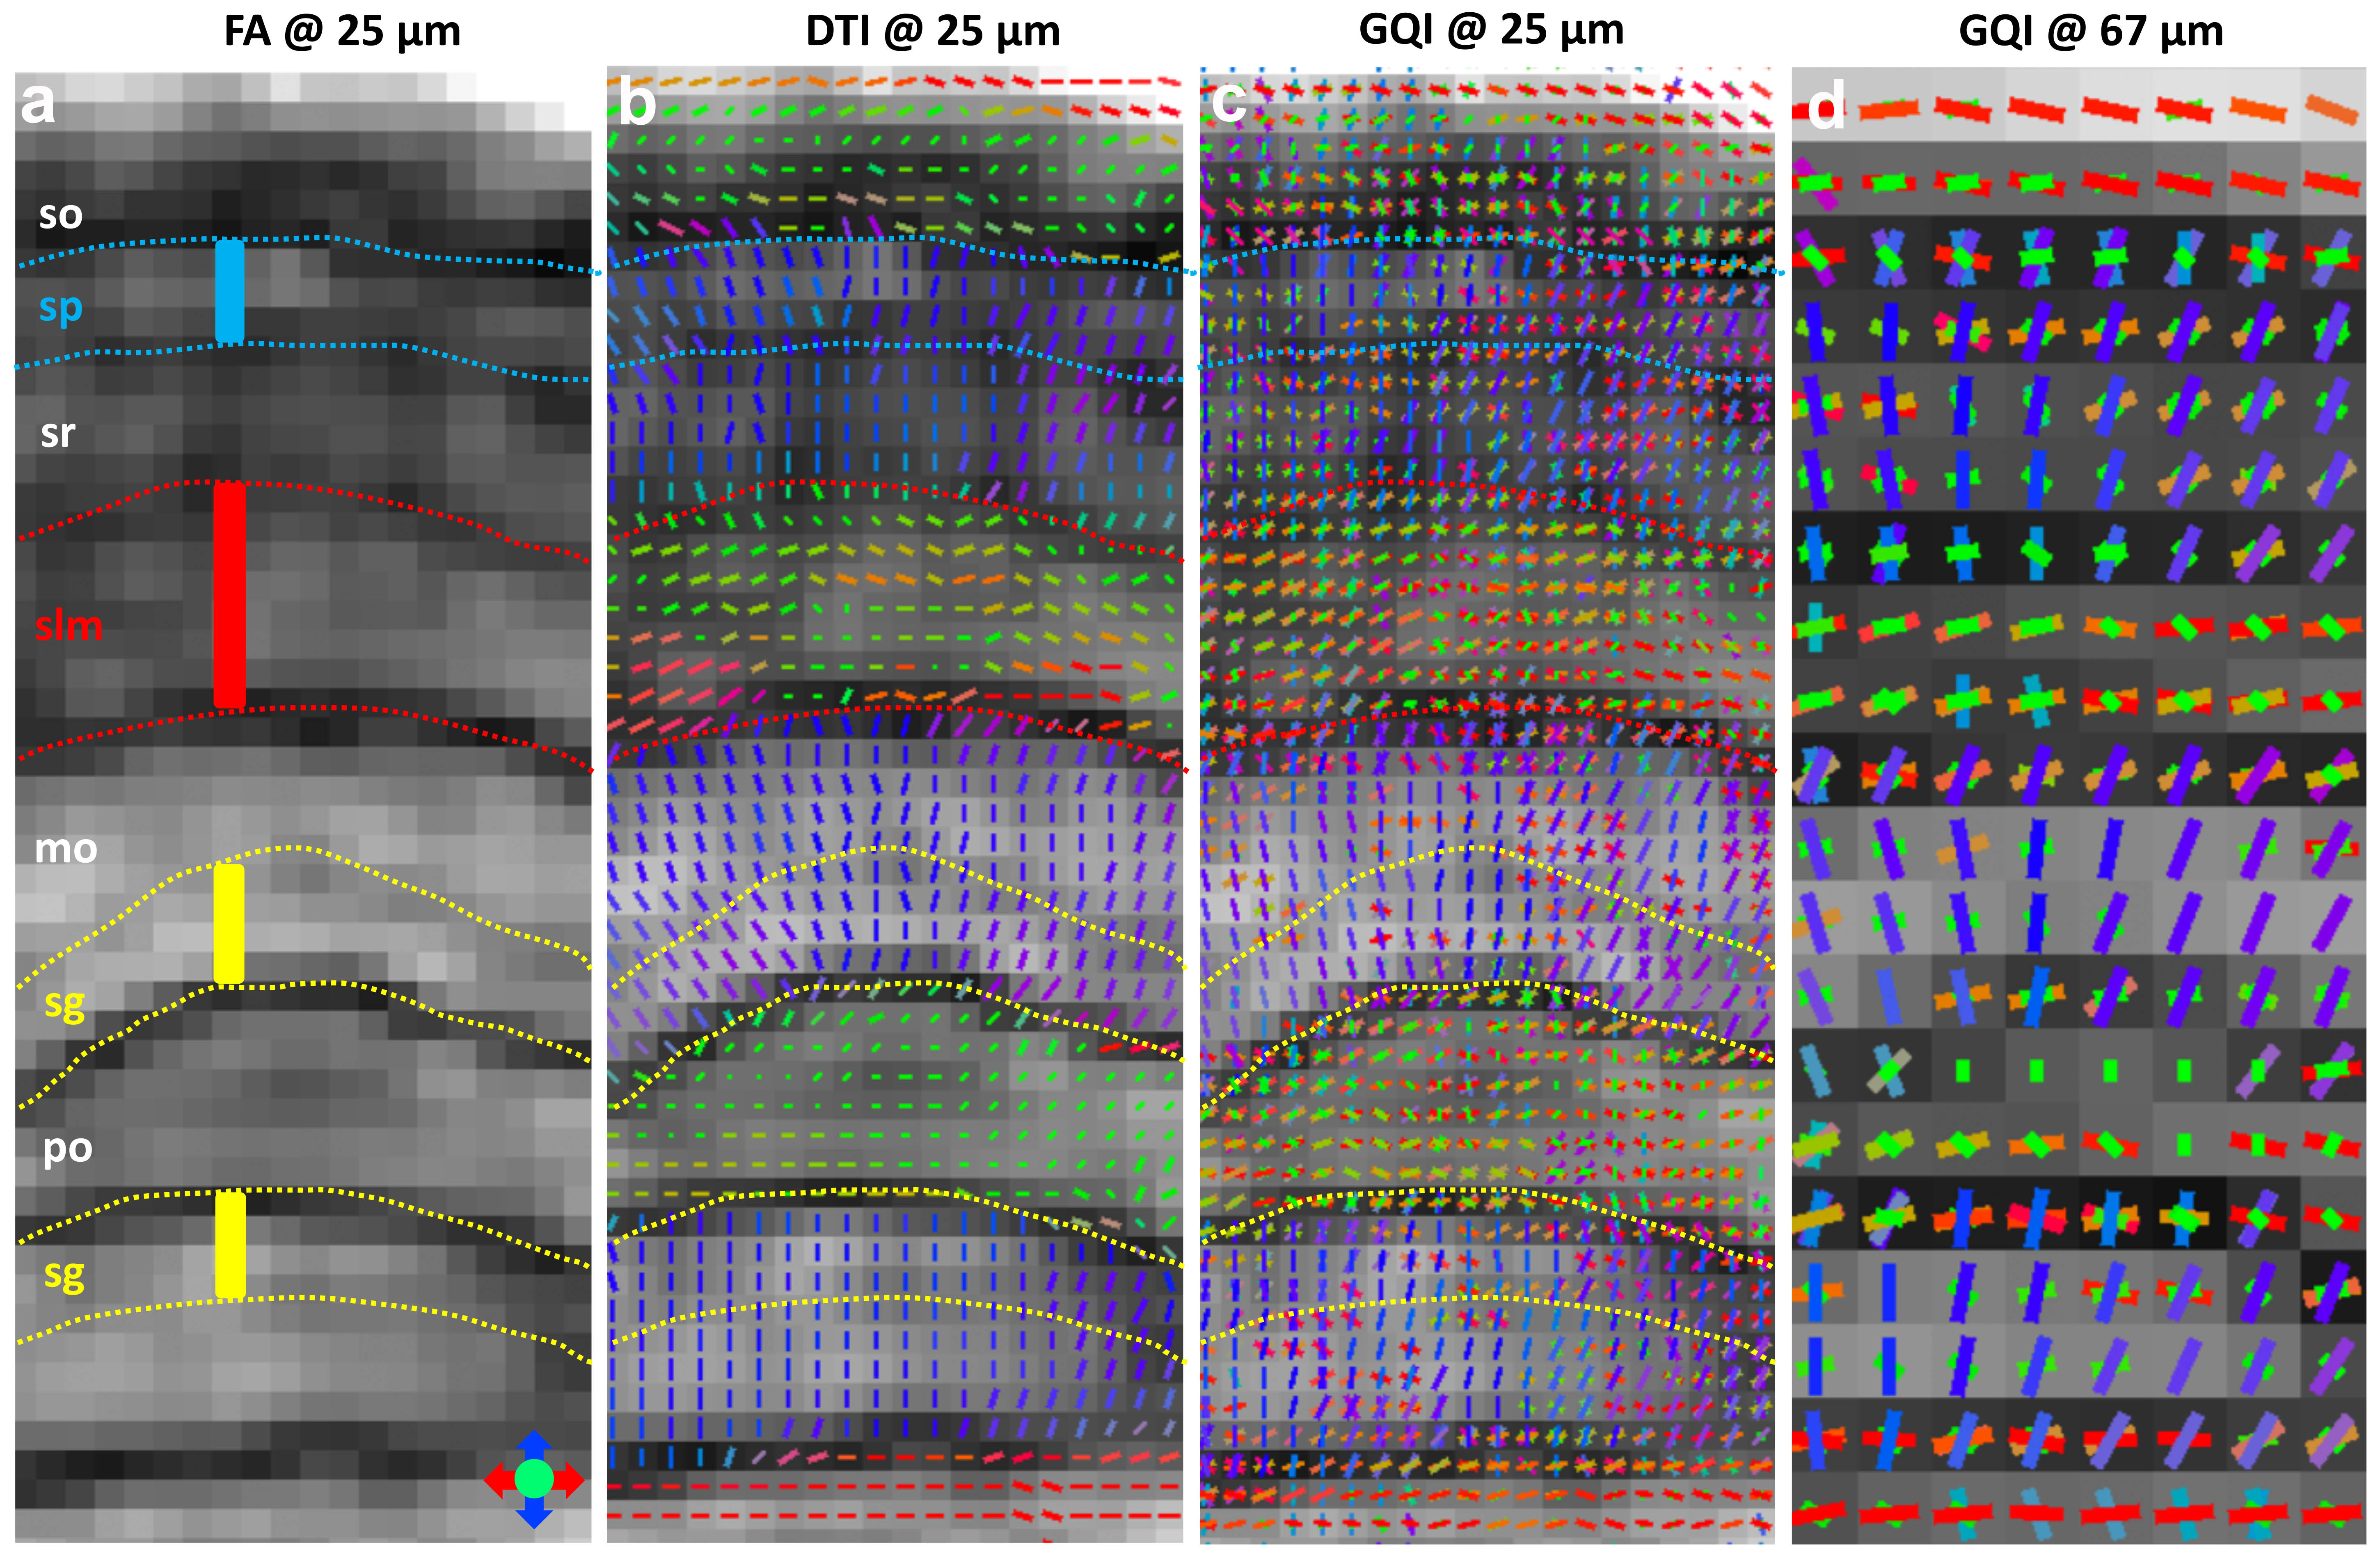
Figure 1 illustrates FA, color-FA, and diffusion weighted (DW) images at 67 µm (left panels of a, b, c) and 25 µm isotropic resolution (right panels of a, b, c). The utility of the higher resolution images is evident upon close inspection of the images, where the images in hippocampus, cortex, and cerebellum regions (purple, green, and white arrows in c) are much sharper at 25 µm resolution. Histological structure in the olfactory bulb, including differentiation of glomeruli, is more evident in the DWIs at 25 µm isotropic resolution (g), which is comparable to the appearance of these layers in standard Nissl preparations (i). The appearance of the barrel field in tangential slices (Figure 2) through the FA datasets reflects this distinctive cytoarchitecture (b and c). The walls of the barrels exhibit higher FA (c) and AD (e) compared to the centers of the barrels, while the reverse contrasts are seen in DWIs (d). In order to investigate the properties of the boundaries in CA1 and the dentate gyrus, Figure 3 shows AD (a, c) and FA images (d, f) at 25 µm isotropic resolution compared with a conventional Nissl stain (b) and the acetylcholinesterase activity (AChE) (e). The cell-rich sp and sg layers show higher axial diffusivity values than the other hippocampus regions. Additional histological features are evident in the FA images (f) that bear striking resemblance to histochemical features revealed by AChE reaction (e). Crossing fibers are resolved across the hippocampus, especially in the plexiform layers (so and slm) of the CA fields (Figure 4), which feature prominent intrinsic and associational connections that intersect the basal (so) and apical (slm) dendrites of pyramidal neurons at orthogonal angles. We further investigated the appearance of the dorsal hippocampus in QSM imaging at different spatial resolutions (Figure 5). The cell-dense layers are more paramagnetic than the plexiform layers, resulting in close correspondence between the appearance of the pyramidal and granule cell layers in the Nissl stain and in the high-resolution QSM images (a and b).Discussion and Conclusion
QSM images and dMRI measurements generate multiple scalar images with contrast dependent on widely varying physical properties. Compressed sensing has enabled us to extend the spatial resolution to 25 um which now enables mapping these multiple data sets to more traditional histologic statins. This extension of MR histology allows for the visualization of detailed neuroanatomic structures in the mouse brains, including layers in the hippocampus, details of the cerebral cortex, barrel area, and olfactory bulb. Combining these different MRI metrics at such high spatial resolution further helps to reduce the neuroanatomy ambiguity in subtle structures of the brain.Acknowledgements
This work was supported by the NIH/NIBIB National Biomedical Technology Resource Center (P41 EB015897 to G. Allan Johnson), NIH 1S10OD010683-01 (to G. Allan Johnson), 1R01NS096720-01A1 (to G. Allan Johnson) and Charles E. Putman MD Vision Award of the Department of Radiology, Duke University School of Medicine (to Nian Wang and Charles E. Spritzer).References
1. Aggarwal M, Jones MV, Calabresi PA, Mori S, Zhang JY (2012) Probing mouse brain microstructure using oscillating gradient diffusion MRI. Magnetic Resonance in Medicine 67 (1):98-109.
2. Calabrese E, Badea A, Cofer G, Qi Y, Johnson GA (2015) A Diffusion MRI Tractography Connectome of the Mouse Brain and Comparison with Neuronal Tracer Data. Cereb Cortex 25 (11):4628-4637.
3. Johnson GA, Calabrese E, Badea A, Paxinos G, Watson C (2012) A multidimensional magnetic resonance histology atlas of the Wistar rat brain. Neuroimage 62 (3):1848-1856.
4. Wang N, Anderson RJ, Badea A, Cofer G, Dibb R, Qi Y, Johnson GA (2018) Whole mouse brain structural connectomics using magnetic resonance histology. Brain Struct Funct 223 (9):4323-4335.
5. Wang N, Mirando AJ, Cofer G, Qi Y, Hilton MJ, Johnson GA. Diffusion tractography of the rat knee at microscopic resolution. Magnetic resonance in medicine 2019;81(6):3775-3786.Sweigart MA, Athanasiou KA. Toward tissue engineering of the knee meniscus. Tissue Eng 2001;7(2):111-129.
6. Wang N, Zhang J, Cofer G, Qi Y, Robert A, White L, Johnson GA (2019) Whole mouse brain structural connectomics using magnetic resonance histology. Brain Struct Funct 224 (5):1797-1813.
7. Yeh FC, Wedeen VJ, Tseng WY. Generalized q-sampling imaging. IEEE Trans Med Imaging 2010;29(9):1626-1635.
Figures