0975
Analysis of hub-regions from the structural connectomes of preterm-born and control adolescents
Hassna Irzan1,2, Michael Hütel2, Sebastien Ourselin2, Neil Marlow3, and Andrew Melbourne1,2
1Medical Physics and Biomedical Engineering, University College London, London, United Kingdom, 2Biomedical Engineering and Imaging Sciences, King's College London, London, United Kingdom, 3Institute for Women's Health, London, United Kingdom
1Medical Physics and Biomedical Engineering, University College London, London, United Kingdom, 2Biomedical Engineering and Imaging Sciences, King's College London, London, United Kingdom, 3Institute for Women's Health, London, United Kingdom
Synopsis
Preterm birth has been linked to white matter abnormalities in infants, however the functional implications of these abnormalities are poorly understood. Thus, the long-term effect of such alterations needs further investigation. By combining graph theory and statistical analysis methods, we identify and investigate the hub structure of the preterm brain. The results suggest that while the hub structure is preserved, the connectivity strength and capacity of information flow is reduced and that is linked to reduced brain volume as well as preterm birth.
Introduction
Extremely preterm birth (<27 weeks of gestation) has been linked to white matter (WM) abnormalities in infants1 but the functional implications of these abnormalities are poorly understood. Thus, the long-term effect of these alterations on adolescents needs further investigation. Brain WM wiring can be represented by a network of all possible pairwise connections between brain regions. Such representation provides valuable insights about the structure of the brain-network. Specifically, in this work, we analyse the hub structure of extremely preterm (EP) born subjects compared to their full term (FT) born socioeconomically matched peers. Because of their role as focal points for the information transfer in the network, any dysfunction of hub regions may have disproportional effect on the integrity of the remaining network. In this analysis, we aim to investigate if the EP birth leads to altered hub brain structure.Methods
Diffusion-weighted MRI volumes were corrected for thermal noise, Gibbs-ringing artefact, eddy current-induced distortion and subject movements artefacts. T1-weighted images were bias-corrected using N4ITK algorithm. Tissue parcellations of the corrected T1-weighted volumes were obtained using Geodesic Information Flow (GIF)2. We applied Constrained Spherical Deconvolution3 to estimate the fiber orientation distribution in each voxel and performed Anatomically Constrained Tractography (ACT)4. From GIF template, we consider 121 cortical regions as nodes V of network G(V,E). The connection E between each node-region V is quantified after applying Spherical-Deconvolution Informed Filtering of Tracks5. Weighted structural networks were computed for 81 EP born adolescents (51 females, 30 males) along with 50 FT born adolescents (30 females, 20 males) as proposed by 6.Different brain regions are identified as hubs depending on the specific centrality measure applied. To devise a more robust identification of these regions we propose a consensus-based approach by combining rankings across centrality measures as in7. We perform consensus classification for each average network of EP and FT born subjects. Hubs display a high level of connectivity strength S(j) and high betweenness centrality B(j) as well as high nodal efficiency Enodal(j). Each node is assigned a score of one each time 1) the node is in the top 25% of nodes with stronger S(j), or 2) it is placed in the top 25% of nodes with highest B(j) or 3) highest Enodal(j). With a maximum of 3 scores, nodes that scored 2 or higher are classified as hubs. Figure 1 shows the main steps of hubs identification.
Statistical analysis is performed to detect group differences regarding S(j), B(j) and Enodal(j) in hubs. The analysis is performed using student t-test. Group, gender membership and brain volume may be confounding variables. There is difference in brain volume between females and males as well as between EP and FT born subjects as shown in figure 2. To account for this, we devise 4 nested GLM models, where we compare the full model (the model containing all regressors) to a set of restricted models. Specifically:
- Y=β0X0+β1X1+β2X2+β3X3+ε
- Y=β0X0+β1X1+β2X2+ε
- Y=β0X0+β1X1+β3X3+ ε
- Y=β0X0+β1X1+ε
Results
The putative hubs identified for EP and FT born groups are shown in figure.3. There is an overall agreement between the two groups. The statistical analyses indicated that there is a significant decrease (p=2.6e-8) in S(j) in EP (μ=8.9±1.1) with respect to FT (μ=10.3±1.3) born subjects. To a lesser extent, Enodal(j) is reduced (p=1.7e-4) in EP (μ=0.23±0.03) with respect to FT (μ=0.21±0.03). B(j) is comparable (p=0.3) between EP (μ=0.105±0.010) and FT (μ=0.104±0.009). The F-test analysis on nested GLM models revealed that brain volume and group membership (model.3) are the most accurate to describe the variance in S(j) and Enodal(j) (top figure.4). The brain volumes describe 37% and 29.5% of the variance in S(j) and Enodal(j) respectively. The group membership accounts for 12% of the variance in S(j) and 4.4% of the variance in Enodal(j) (bottom figure.4).Discussion/conclusions
We proposed a consensus-based method to identify hubs in EP and FT born network. The identified regions are comparable between the groups and consistent with previous studies7 on healthy subjects by identifying bilateral caudate, thalamus, putamen, precuneus, superior fontal gyrus and precuneus(Figure.3). The statistical analysis revealed that, although the EP and FT born subject have comparable hubs regions, the hubs in the EP group have a statistically significant reduced connectivity strength as well as nodal efficiency, while the betweenness centrality is comparable. The F-test on nested GLM models suggests that the observed difference is explained by brain volume difference and EP birth. The analysis of variance on model.3 suggests that although the brain volume influence is greater, the prematurity is significant to induce lower S(j) and Enodal(j). The results suggest that while the core structure of the EP born brain is preserved, the connectivity and capacity of information flow is reduced and that is linked to reduced brain volume as well as EP birth.Acknowledgements
We acknowledge the EPSRC-funded UCL Centre for Doc-toral Training in Medical Imaging (EP/L016478/1), the National Institute forHealth Research (NIHR) and the MRC (MR/J01107X/1)References
- Gareth Ball, Libuse Pazderova, Andrew Chew, Nora Tusor, Nazakat Merchant, Tomoki Arichi, Joanna M. Allsop, Frances M. Cowan, A. David Edwards, Serena J. Counsell, Thalamocortical Connectivity Predicts Cognition in Children Born Preterm, Cerebral Cortex, Volume 25, Issue 11, November 2015, Pages 4310-4318.
- M. J. Cardoso, M. Modat, R. Wolz, A. Melbourne, D. Cash, D. Rueckert, and S. Ourselin, Geodesic information flows: Spatially-variant graphs and their application to segmentation and fusion, IEEE Transactions on Medical Imaging, vol. 34, no. 9, pp. 1976–1988, 2015
- J-Donald Tournier, Fernando Calamante, Alan Connelly, Robust determination of the fibre orientation distribution in diffusion MRI: Non-negativity constrained super-resolved spherical deconvolution, NeuroImage, Volume 35, Issue 4, 2007, pp 1459-1472.
- Robert E. Smith, Jacques-Donald Tournier, Fernando Calamante, Alan Connelly, Anatomically-constrained tractography: Improved diffusion MRI streamlines tractography through effective use of anatomical information, NeuroImage, Volume 62, Issue 3, 2012, Pages 1924-1938.
- Robert E. Smith, Jacques-Donald Tournier, Fernando Calamante, Alan Connelly, SIFT2: Enabling dense quantitative assessment of brain white matter connectivity using streamlines tractography, NeuroImage, Volume 119, 2015, Pages 338-351, ISSN 1053-8119.
- Tahedl, M. (2019, October 9). B.A.T.M.A.N.: Basic and Advanced Tractography with MRtrix for All Neurophiles. https://doi.org/10.17605/OSF.IO/FKYHT.
- Van den Heuvel MP, Mandl RC, Stam CJ, Kahn RS, Hulshoff Pol HE. Aberrant frontal and temporal complex network structure in schizophrenia: a graph theoretical analysis. J Neurosci. 2010;30(47):15915–15926. doi:10.1523/JNEUROSCI.2874-10.2010.
Figures
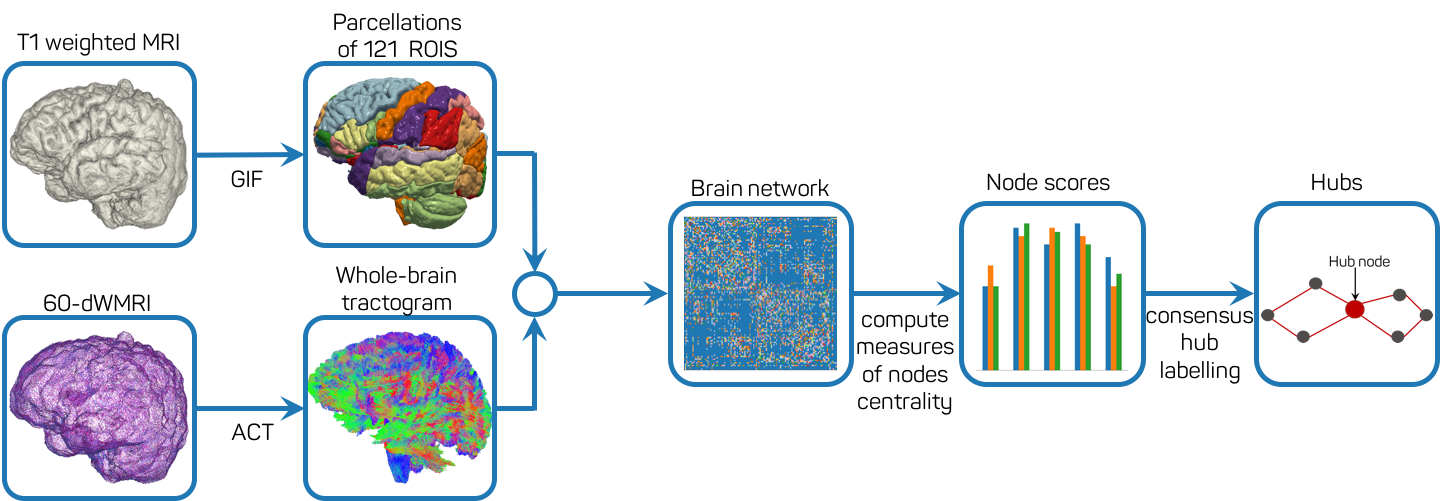
Outline of the main steps
to estimate brain networks and perform consensus-based identification of hubs.
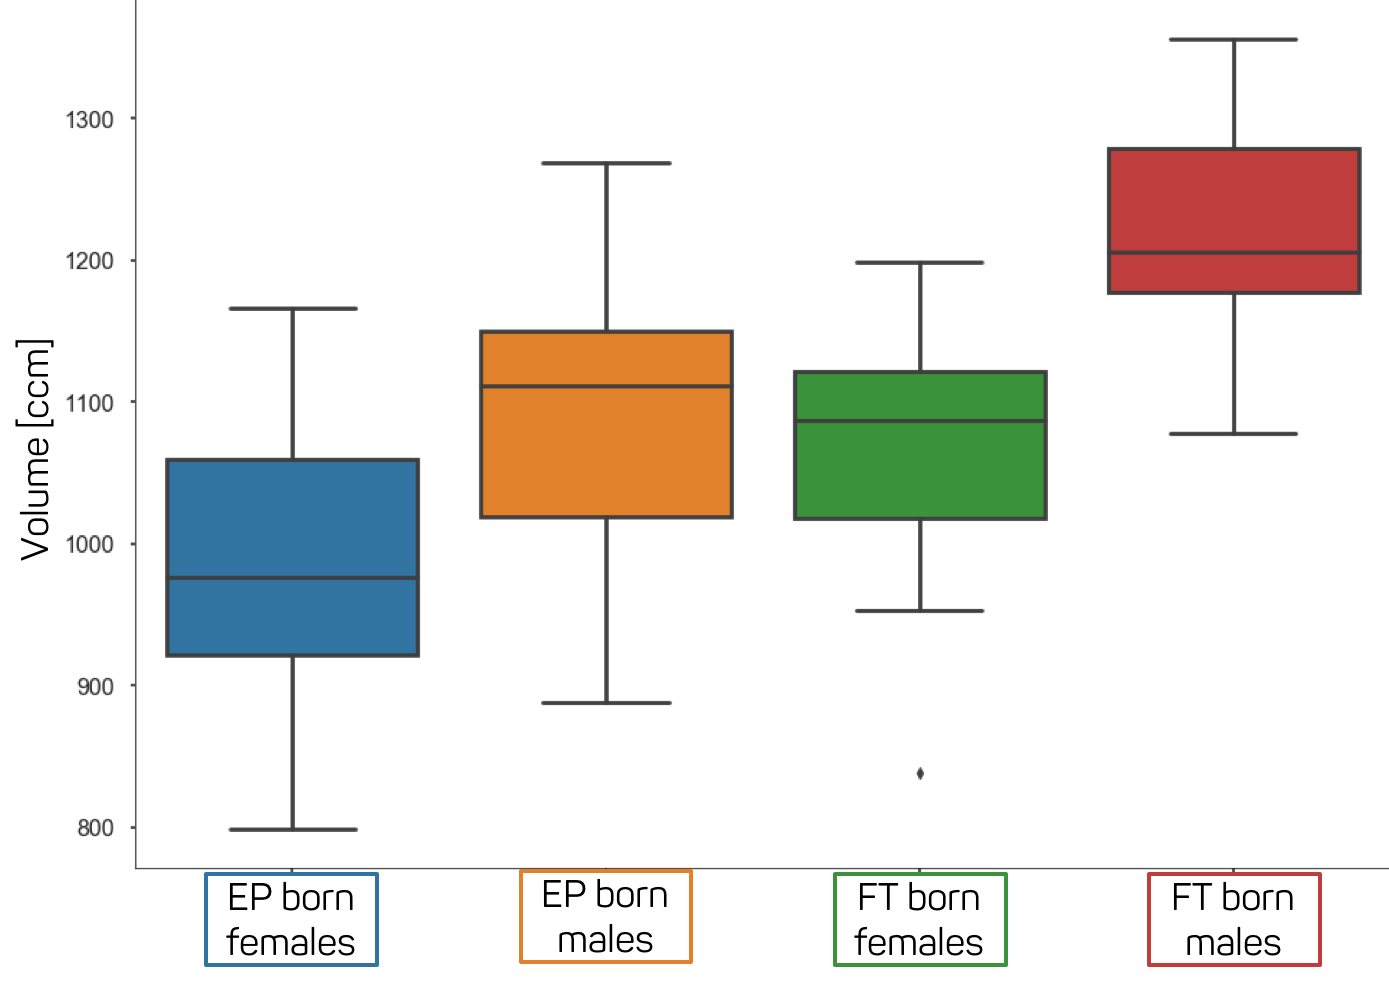
The distribution of
the brain volumes for FT born females and males as well as for EP born females
and males.
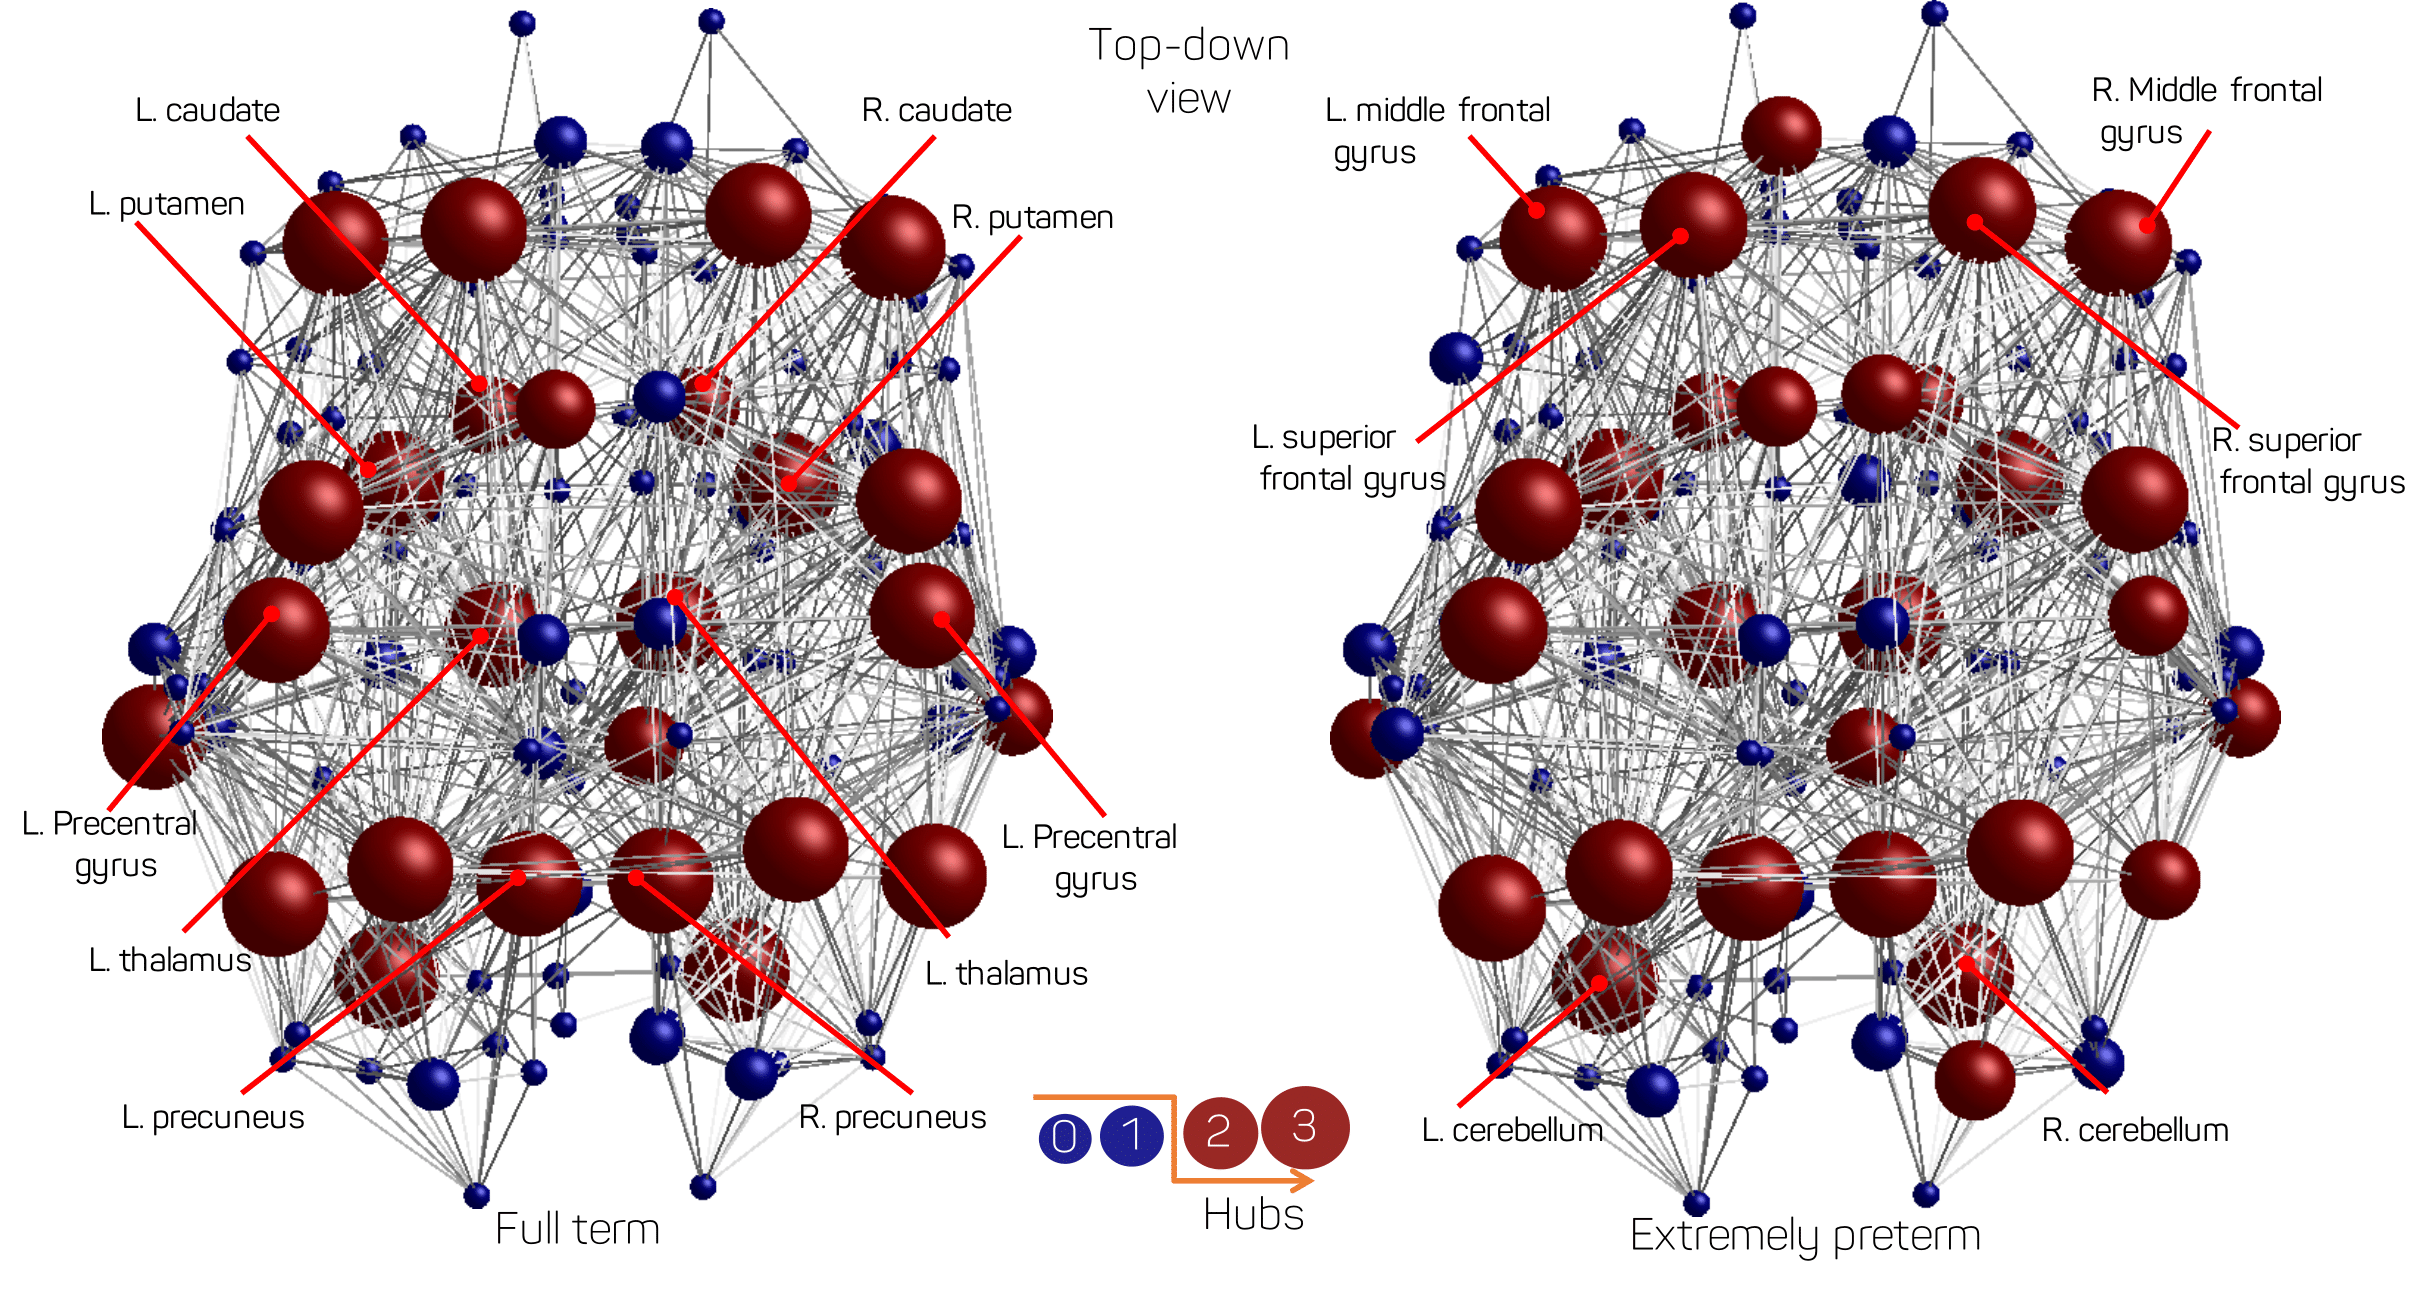
Node specific hubness scores for FT and EP born
subjects. Nodes with scores higher than or equal to 2 are classified as hubs
and are displayed in red. The size of the node indicates its score.
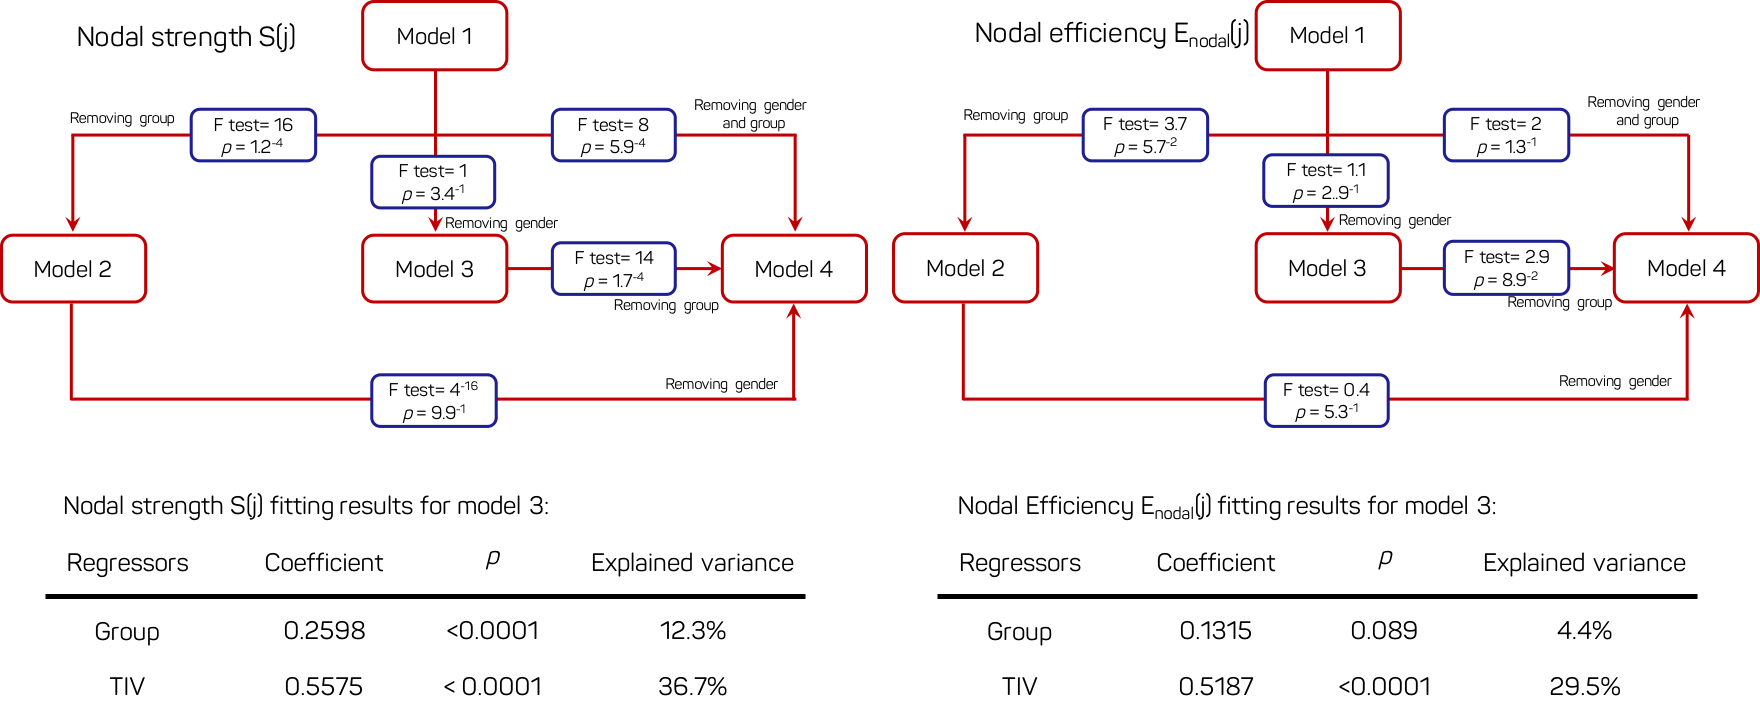
Top: F-test analysis (blue boxes) for comparing nested
models for S(j) and Enodal(j). The end of arrow indicates that the model is nested to the model at
the beginning of the arrow. Bottom: Results of the regression analysis for
model.3 for S(j) and Enodal(j).