0972
Simultaneous Imaging of Diffusion and Coherent Motion in Slow-Flow Compartments in the Brain1GE Global Research Center, Niskayuna, NY, United States, 2Hospital for Special Surgery, New York, NY, United States, 3Uniformed Services University of the Health Sciences, Bethesda, MD, United States, 4Walter Reed National Military Medical Center, Bethesda, MD, United States
Synopsis
We demonstrate a method for simultaneous imaging of diffusion and slow motion in vivo. We use both the magnitude and phase information from image data to reconstruct coherent and incoherent motion (flow and diffusion). We modified a PGSE diffusion imaging sequence so that b-value and encoded velocity can be set independently. We imaged healthy volunteers with a 2-shell sequence with bmax=2000 sec/mm2 and venc=0.24 mm/s at multiple phases during the cardiac cycle using peripheral gating. Results show a distinct periodic motion around the ventricles with RMS speed 0.065 mm/s, moving laterally during systole and medially during diastole
Introduction
Recent interest in understanding the waste removal processes in the brain has highlighted the need for in vivo imaging of sub-millimeter/second flow1-4. Diffusion imaging utilizes second-order water flow to characterize white matter microstructures and tractography. Conventional diffusion image processing relies on magnitude information; by using the remaining phase information, it becomes possible to simultaneously extract coherent motion profiles for the tissue, which can be related to CSF flow.In this work, we present an analysis for the selection of timing parameters of a diffusion imaging pulse sequence to optimize the simultaneous collection of both magnitude and phase data. We also discuss the subsequent reconstruction for coherent motion that can run in parallel to existing diffusion imaging reconstruction.
Methods
Standard diffusion imaging uses a pair of trapezoidal pulses to encode a given b-value with minimum TE. We modified a single-spin echo diffusion imaging sequence to create the SCIMI (Simultaneous Coherent-Incoherent Motion Imaging) sequence, which allows setting a given b-value and an encoded velocity independently by appropriately tuning timing parameters. For a given b-value, minimum TE is achieved by varying $$$\delta$$$ while keeping the spacing between the two lobes of the encoding gradient fixed, $$$\Delta=\delta+t_{180}$$$, where $$$t_{180}$$$ is the minimum time needed for the refocusing pulse and crusher gradients surrounding it. By allowing $$$t_{180}$$$ to stretch, the sequence gains the flexibility to simultaneously choose a venc value, at the cost of lengthening TE. To encode for both a given b-value and venc, the timing for the diffusion-encoding trapezoids is modified using the roots $$$\delta$$$ in the following equation:$$$c_2\delta^3+(\frac{c_2\zeta^2}{2}-3c_1)\delta+3c_1^2-c_2\zeta^3/10=0$$$
where $$$c_1=2bv_{enc}/\pi\gamma G$$$, $$$c_2=4bv_{enc}^2/\pi^2$$$, and $$$\zeta$$$ is the trapezoid ramp time. The combination of the values $$$c_1\propto bv_{enc}$$$ and $$$c_2\propto bv_{enc}^2$$$ encode the relevant parameters, while the ramp time can always be set using the maximum desired slew rate to keep TE as low as possible. The real positive values of are then used to determine the required $$$\Delta$$$ values according to
$$$\Delta=\frac{\delta^3-\zeta^3/10+\delta\zeta^2/2}{3\delta(\delta-c_1)}$$$
subject to $$$\Delta\ge\delta+t_{180,min}$$$ and $$$\delta\gt\zeta$$$.
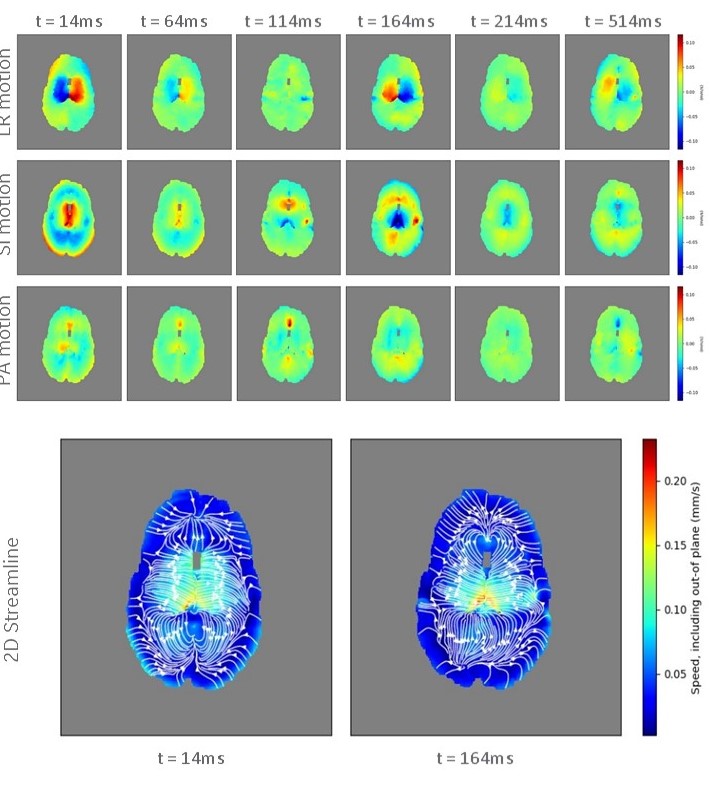
Imaging with such a sequence allows for conventional diffusion image reconstruction while a separate phase-sensitive reconstruction pipeline is used to measure coherent motion. Figure 1 details the method to reconstruct velocity profiles in 3D from the images. Using this, we imaged 5 healthy volunteers on a GE Healthcare Discovery MR750 (Waukesha, WI) scanner using a custom high-performance gradient coil set for brain imaging5 with a gradient strength of 200 mT/m and slew rate of 500 T/m/s. We imaged with a 2-shell sequence (30 directions: 8 in inner shell, 22 in outer shell) with bouter=2000sec/mm2, binner=1400sec/mm2, and venc=0.24mm/s. For each series of images, we varied the trigger delay (peripheral gating) to image axial slices containing the lateral ventricles at various phases in the cardiac cycle, using delay times of 14ms, 64ms, 114ms, 164ms, 214ms, and 514ms delays from the R-wave.
Results & Discussion
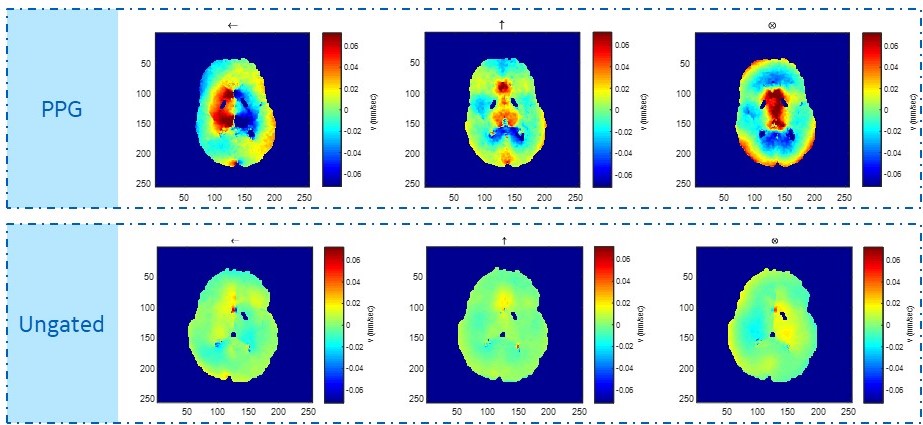
Figures 2 and 3 show some of the constraints when simultaneously setting the b-value and the venc. In Figure 2, several sample encoding pulses are shown for a variety of different venc values. As the venc decreases, the two lobes of the encoding pulses become narrower and further apart, increasing TE overall. The minimum TE sequence will always have the maximum venc allowed for a given b-value and gradient strength, as shown in Fig. 3. At higher b-values, the increase in TE is only nominal, while at low b-values and venc, this increase may make imaging impossible. With a stronger gradient coil, the maximum allowed venc increases and the effect of lowering the venc for a given b-value on TE is reduced.Figures 4 and 5 show the result of the velocity profile reconstruction. In Fig. 4, the difference between gated and ungated acquisition clearly demonstrates that with gating, there is a net coherent motion with RMS 0.065 mm/s in the region of interest. In Fig. 5, the different trigger delays provide a sequence of motion at different phases in the cardiac cycle. Immediately after R-wave (systole phase), there is significant lateral motion around the ventricles. This motion fades, and a clear reversal is seen at 164 ms, demonstrating the expected brain pulsatility motion. This motion accounts for both tissue movement due to pulsation and CSF flow through the tissue. Both the motion sequence and the measured velocities agree with independent phase-contrast scans performed on the same volunteers.
Conclusion
Our method for simultaneous imaging of coherent and incoherent (diffusion) motion in vivo uses magnitude reconstruction of diffusion data and phase-sensitive reconstruction to image coherent motion. Adjusting timing parameters of a diffusion pulse sequence to set b-values and venc values independently allows low venc values on the order of 0.1-0.5 mm/s. This range is well suited to studying CSF pulsatile flow through brain parenchyma.Analysis of this motion over the course of several hours, for example during a sleep study, may provide insight into the waste removal mechanisms of the brain. Slowly varying CSF mean velocity may be extracted by averaging the signal over multiple heartbeats to study CSF flow in interstitial spaces.
Acknowledgements
Funding for this research was provided in part by CDMRP W81XWH-16-2-0054.
The views expressed in this abstract are those of the authors and do not reflect the official policy or position of the Uniformed Services University of the Health Sciences, Walter Reed National Military Medical Center, the Department of Defense, of the U.S. Government.
References
1. Jessen NA, Munk AS, Lundgaard I, et al. The Glymphatic System: A Beginner's Guide. Neurochem Res. 2015 Dec;40(12):2583-99.
2. Iliff JJ, Lee H, Yu M, et al. Brain-wide pathway for waste clearance captured by contrast-enhanced MRI. J Clin Invest. 2013 Mar;123(3):1299-309.
3. Soellinger, M., Rutz, A., Kozerke, S., Boesiger, P. (2009). 3D cine displacement-encoded MRI of pulsatile brain motion Magnetic Resonance in Medicine 61(1), 153 162. https://dx.doi.org/10.1002/mrm.21802
4. Yildiz, S., Thyagaraj, S., Jin, N., Zhong, X., Pahlavian, S., Martin, B., Loth, F., Oshinski, J., Sabra, K. (2017). Quantifying the influence of respiration and cardiac pulsations on cerebrospinal fluid dynamics using real-time phase-contrast MRI Journal of Magnetic Resonance Imaging 46(2), 431 439. https://dx.doi.org/10.1002/jmri.25591
5. Foo TK, Tan ET, Vermilyea ME, et al. Highly efficient head-only magnetic field insert gradient coil for achieving simultaneous high gradient amplitude and slew rate at 3.0T (MAGNUS) for brain microscopic imaging. Magn Reson Med. 2019 (in press).
Figures
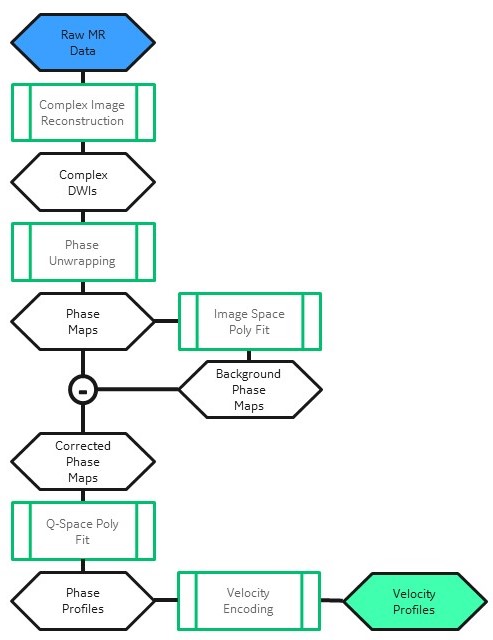

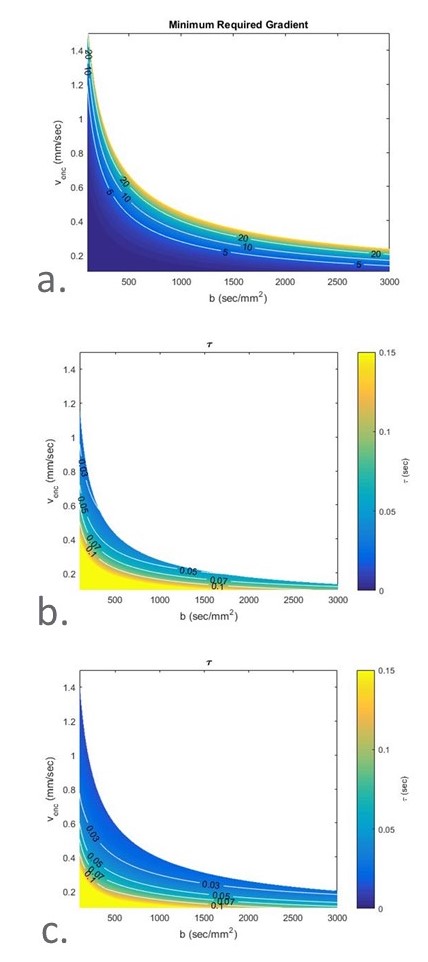
Figure 3: Resulting time parameters for a given b, venc encoding combination. a) The minimum gradient strength in G/cm required given a minimum t180 of 8ms. Stronger gradients are required to achieve higher venc values for a given b; b, c) The total time for the encoding pulses for a gradient strength of 5 G/cm (b) and 20 G/cm (c) and a minimum t180 of 8ms. With a stronger gradient, more of the b-venc space become available and the total time for a given b and venc encoding decreases.